Horizontal and Vertical Financial Statement Analysis
VerifiedAdded on 2020/05/28
|21
|3421
|167
AI Summary
The task requires examining financial data through horizontal and vertical analyses. Horizontal analysis focuses on comparing line items across different periods, identifying trends, percentage changes in net operating income, loans, assets, liabilities, and equity from FY2015 to FY2017. Vertical analysis evaluates each item as a proportion of a base figure within the same year, enabling assessment of structure and allocation efficiency. The balance sheet breakdown shows shifts in asset distribution, with an increase in 'Other Assets' over three years, while loans decrease. Liabilities and shareholders' equity changes are also highlighted. The income statement's vertical analysis reveals expenses as percentages of net operating income before impairment charges, reflecting operational efficiency trends. Overall, these analyses help uncover financial health, stability, and performance insights.

Running head: ACCOUNTING
Accounting
Name of the Student:
Name of the University:
Authors note:
Accounting
Name of the Student:
Name of the University:
Authors note:
Paraphrase This Document
Need a fresh take? Get an instant paraphrase of this document with our AI Paraphraser
1ACCOUNTING
Table of Contents
1. Executive summary................................................................................................................2
2. Introduction............................................................................................................................2
3. Income statement...................................................................................................................3
4. Statement of Financial position..............................................................................................4
5. Cash Flow Statement..............................................................................................................6
6. Financial Ratio Analysis:.......................................................................................................7
7. Horizontal and Vertical Analysis.........................................................................................13
Reference..................................................................................................................................15
Appendices...............................................................................................................................17
Appendix 1 (BALANCE SHEET).......................................................................................17
Appendix 2 (INCOME STATEMENT)...............................................................................17
Appendix 3 Horizontal and vertical analysis.......................................................................18
2ACCOUNTING
1. Executive summary
In the following report, we are going to analyse the financial statements of a banking
company having its business operation in Australia and New Zealand. In terms of size and
assets held it is the second largest bank operating in both the countries. In pursuance of
analysing its financial position and performance we will take into consideration not only the
data of the current year but also will be conducting trend analysis to gauge the impact of the
decision and action taken by the company towards wealth creation of the shareholders. There
are many financial and non-financial matters to be considered by the shareholders before
investing in the shares of any company. On their behalf, we will be conducting these analyses
and will draw a conclusion about the present and future viability of the company’s financial
position and performance. The analysis will be based upon the data of the last three years of
the company’s operation in Australia. This data will be taken from the financial statements of
the company as laid down in the annual report of the company and will then be compared
with the industry standard. We will be using tools like horizontal analysis, vertical analysis,
and ratio analysis covering ratios relating to profitability, efficiency, solvency and liquidity of
the company. The trend obtained from comparing the data of the last three years will help us
to understand and present the data in graphical and other formats that will aide in the
understanding of the stakeholders about the financial position and performance of the
company.
2. Introduction
The company on which we will be presenting our analysis or report is Westpac
Banking Corporation or more commonly known as WESTPAC. It is a bank and also
provides various sorts of financial services. It has its headquarters in Sydney Westpac Place.
It has the largest number of branches with respect to any other bank carrying out operation
within Australia. The bank has around 1429 branches and 3850 ATMs all around Australia.
⊘ This is a preview!⊘
Do you want full access?
Subscribe today to unlock all pages.
Trusted by 1+ million students worldwide
3ACCOUNTING
In terms of assets held by the banks of Australia it is the second largest bank operating within
the country (Louis et al., 2014). It is not only operating in Australia but also has its business
footprints in New Zealand. In New Zealand too it is the second largest bank in terms of assets
held. In our report we will be analysing various key financial indicators to determine the real
and accurate picture of the company’s financial position and performance. In addition to
current year data we will be taking the data of past to financial years and will try to draw up a
trend analysis which will enable us to decide whether the company is capable enough to
create wealth for its shareholders. Finally, based on our analysis we will be drawing
conclusion in respect of the company’s financial position and performance.
3. Income statement
One of the many reasons that influence the decisions of the shareholders is profit
earned by the company in a specific period of time and the capability of the organisation to
earn profits in the future. Information regarding the amount of profit earned by the
organisation is contained in the income statement of the company. The income statement also
enables the shareholders to get a picture of the ways in which the company earned its profit
and about the reliability that can be placed upon the company regarding its future viability
and profitability (Zeff, 2016). The profit of an organisation is arrived at by deducting the
expenses from the income of the company. Owner’s equity increases with financial profits
and it decreases with financial losses.
Paraphrase This Document
Need a fresh take? Get an instant paraphrase of this document with our AI Paraphraser
4ACCOUNTING
2017 2016 2015
7100
7200
7300
7400
7500
7600
7700
7800
7900
8000
8100
COMPARISON OF INCOME STATEMENT FROM
2015 TO 2017
$ MILLIONS
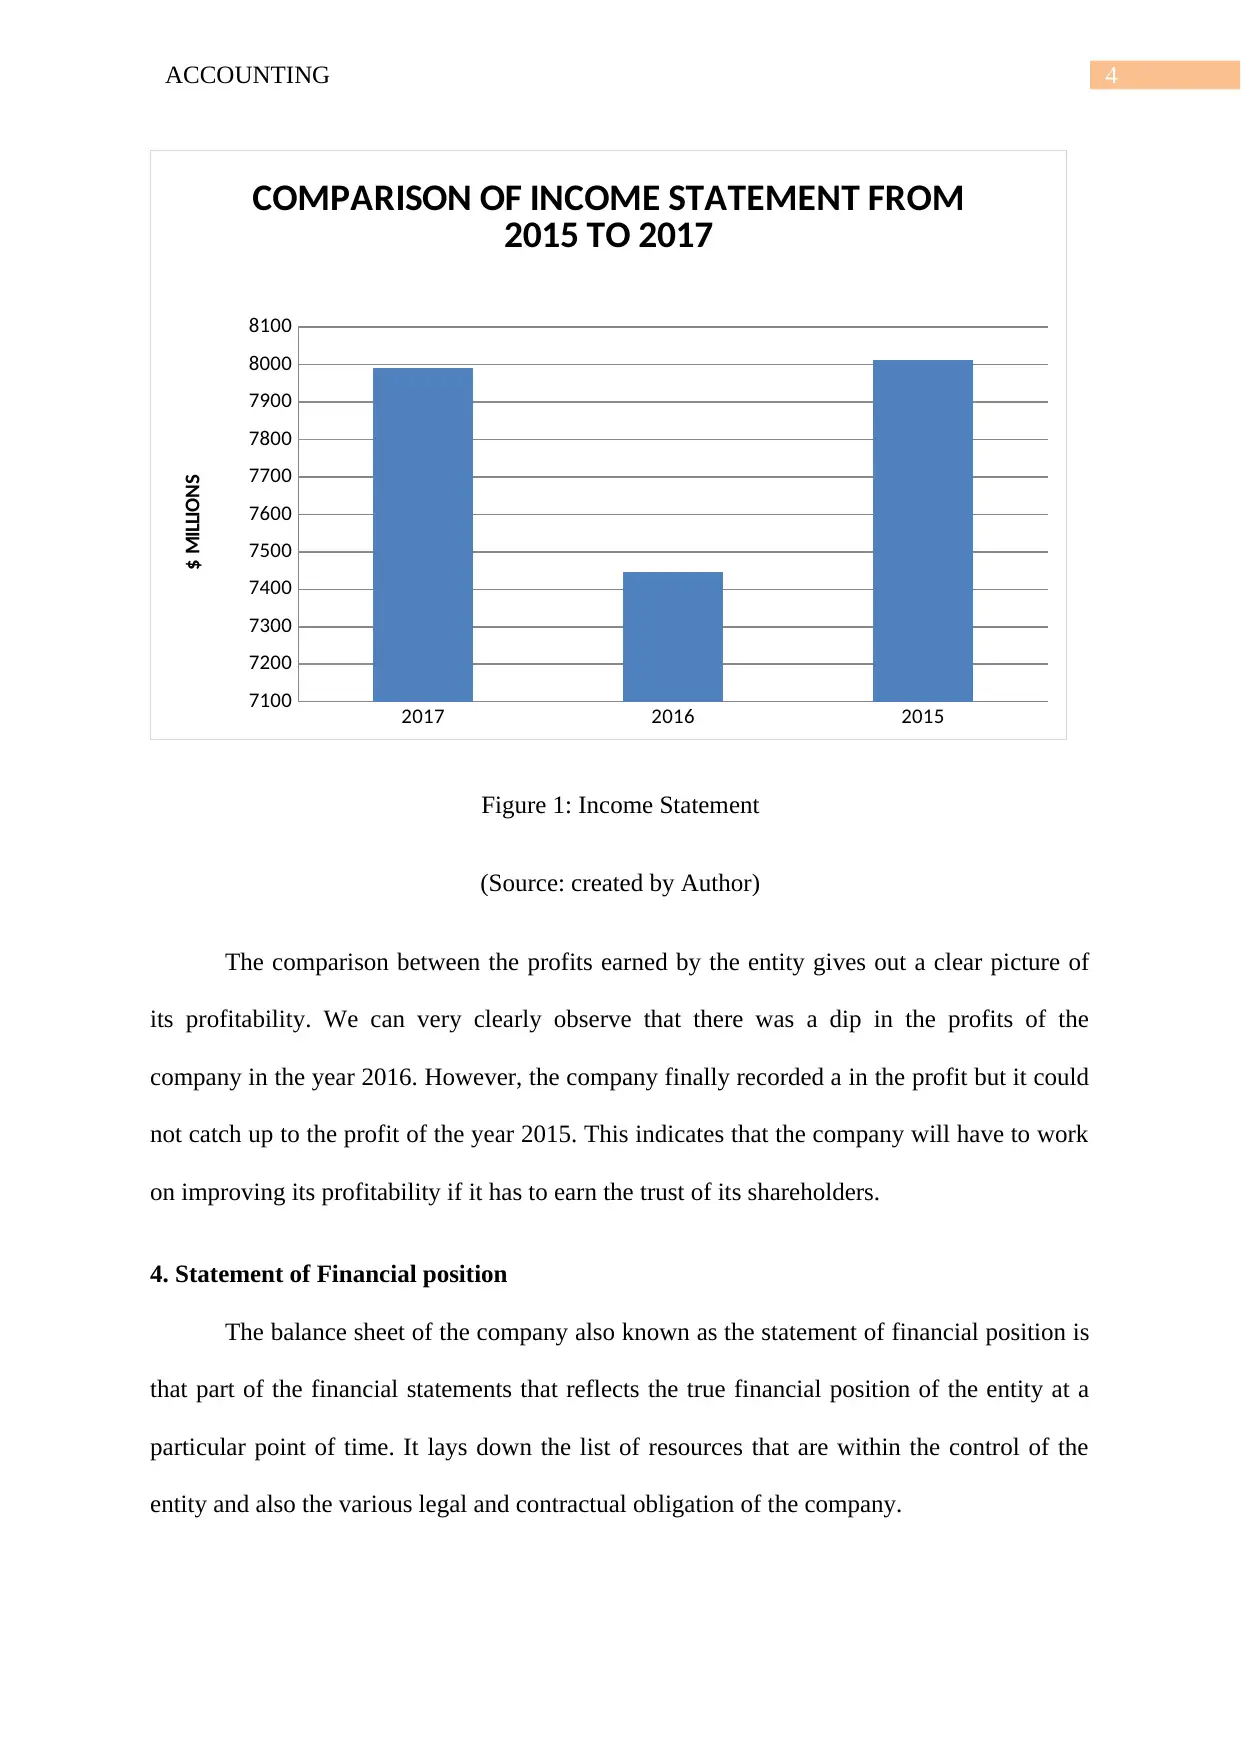
Figure 1: Income Statement
(Source: created by Author)
The comparison between the profits earned by the entity gives out a clear picture of
its profitability. We can very clearly observe that there was a dip in the profits of the
company in the year 2016. However, the company finally recorded a in the profit but it could
not catch up to the profit of the year 2015. This indicates that the company will have to work
on improving its profitability if it has to earn the trust of its shareholders.
4. Statement of Financial position
The balance sheet of the company also known as the statement of financial position is
that part of the financial statements that reflects the true financial position of the entity at a
particular point of time. It lays down the list of resources that are within the control of the
entity and also the various legal and contractual obligation of the company.
2017 2016 2015
7100
7200
7300
7400
7500
7600
7700
7800
7900
8000
8100
COMPARISON OF INCOME STATEMENT FROM
2015 TO 2017
$ MILLIONS
Figure 1: Income Statement
(Source: created by Author)
The comparison between the profits earned by the entity gives out a clear picture of
its profitability. We can very clearly observe that there was a dip in the profits of the
company in the year 2016. However, the company finally recorded a in the profit but it could
not catch up to the profit of the year 2015. This indicates that the company will have to work
on improving its profitability if it has to earn the trust of its shareholders.
4. Statement of Financial position
The balance sheet of the company also known as the statement of financial position is
that part of the financial statements that reflects the true financial position of the entity at a
particular point of time. It lays down the list of resources that are within the control of the
entity and also the various legal and contractual obligation of the company.
5ACCOUNTING
2017 2016 2015
$-
$100,000.00
$200,000.00
$300,000.00
$400,000.00
$500,000.00
$600,000.00
$700,000.00
$800,000.00
$900,000.00
Total Assets, Liabilities and equities
comparison
$MILLION
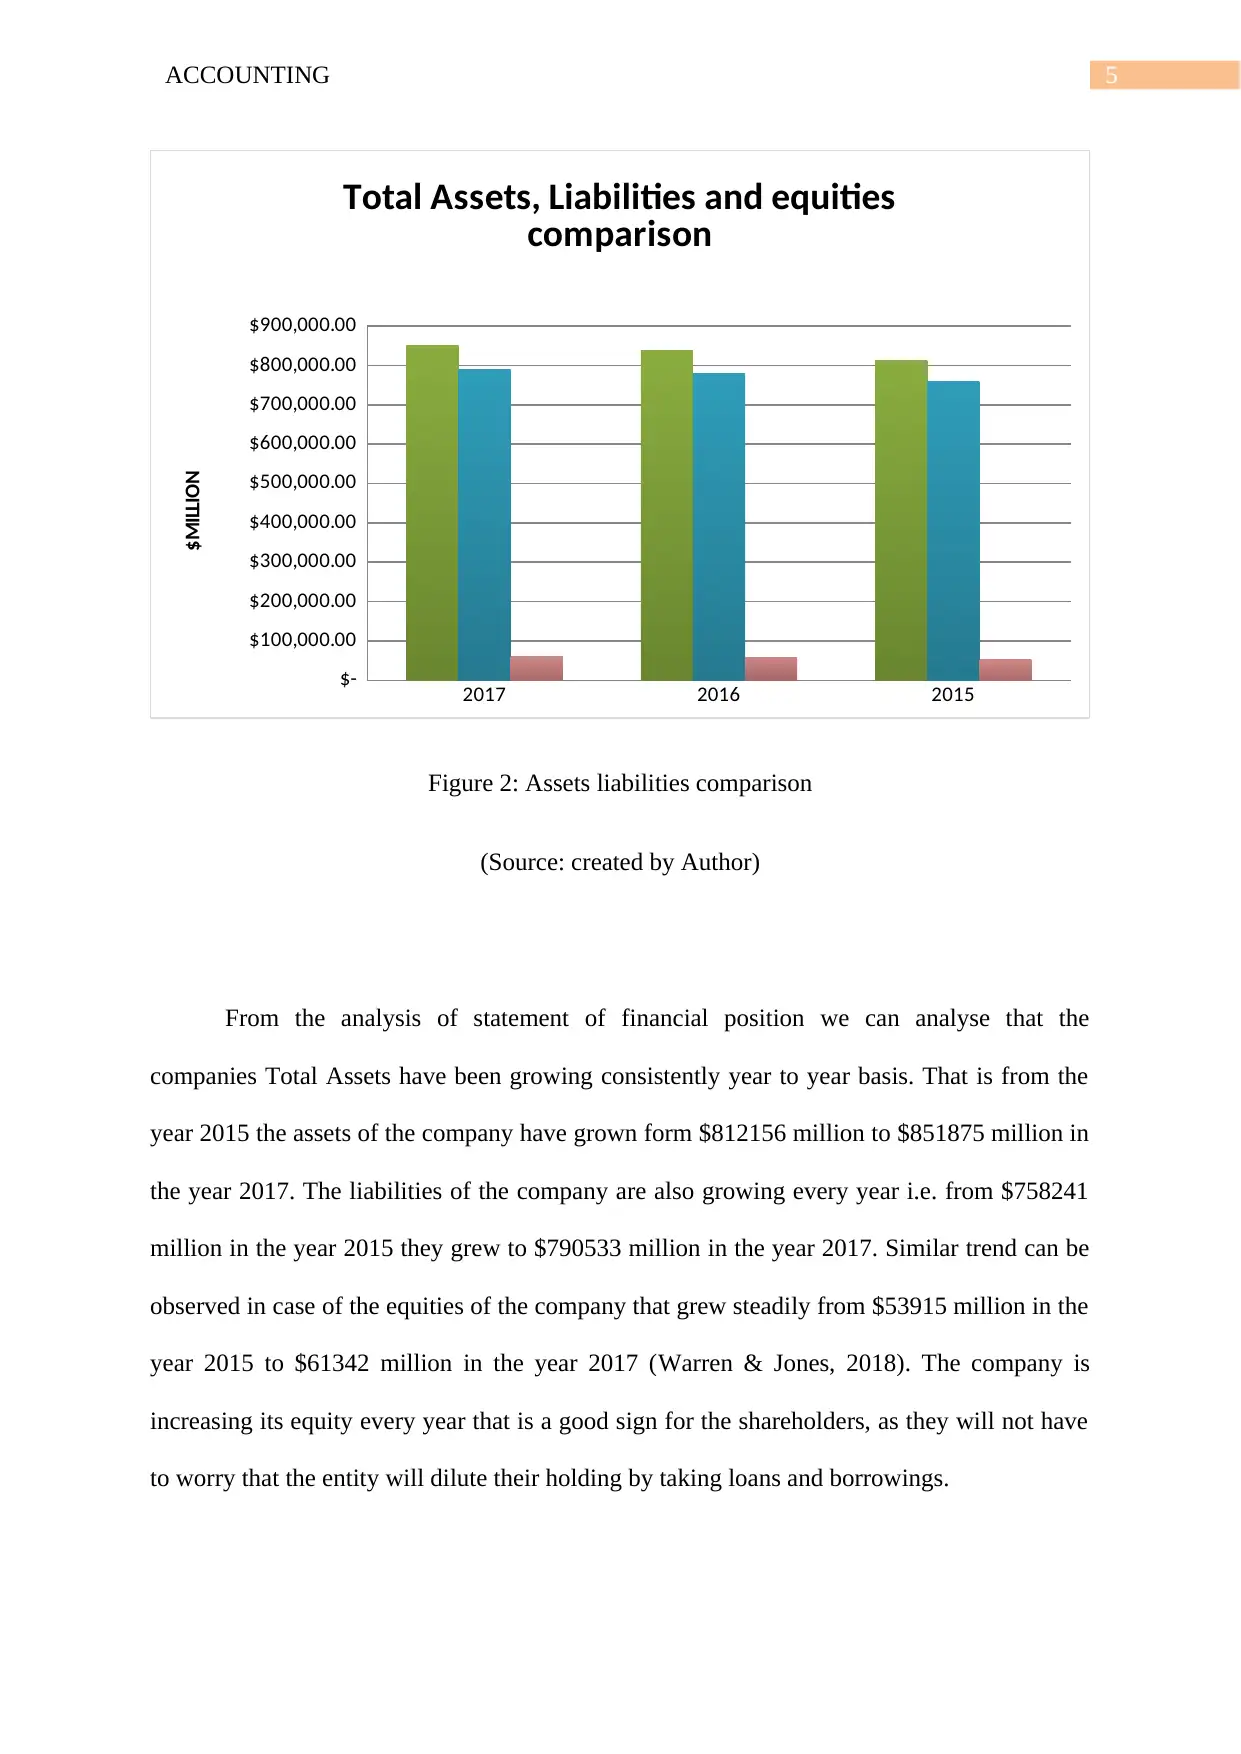
Figure 2: Assets liabilities comparison
(Source: created by Author)
From the analysis of statement of financial position we can analyse that the
companies Total Assets have been growing consistently year to year basis. That is from the
year 2015 the assets of the company have grown form $812156 million to $851875 million in
the year 2017. The liabilities of the company are also growing every year i.e. from $758241
million in the year 2015 they grew to $790533 million in the year 2017. Similar trend can be
observed in case of the equities of the company that grew steadily from $53915 million in the
year 2015 to $61342 million in the year 2017 (Warren & Jones, 2018). The company is
increasing its equity every year that is a good sign for the shareholders, as they will not have
to worry that the entity will dilute their holding by taking loans and borrowings.
2017 2016 2015
$-
$100,000.00
$200,000.00
$300,000.00
$400,000.00
$500,000.00
$600,000.00
$700,000.00
$800,000.00
$900,000.00
Total Assets, Liabilities and equities
comparison
$MILLION
Figure 2: Assets liabilities comparison
(Source: created by Author)
From the analysis of statement of financial position we can analyse that the
companies Total Assets have been growing consistently year to year basis. That is from the
year 2015 the assets of the company have grown form $812156 million to $851875 million in
the year 2017. The liabilities of the company are also growing every year i.e. from $758241
million in the year 2015 they grew to $790533 million in the year 2017. Similar trend can be
observed in case of the equities of the company that grew steadily from $53915 million in the
year 2015 to $61342 million in the year 2017 (Warren & Jones, 2018). The company is
increasing its equity every year that is a good sign for the shareholders, as they will not have
to worry that the entity will dilute their holding by taking loans and borrowings.
⊘ This is a preview!⊘
Do you want full access?
Subscribe today to unlock all pages.
Trusted by 1+ million students worldwide
6ACCOUNTING
5. Cash Flow Statement
The cash flow statement acts as a summary statement that shows us the movement of
cash that is in or out of the entity over a specified period of time. The cash flow analysis of
every entity becomes very important along with the accrual system of accounting because of
the fact the organisation will not able to function properly without having cash in hand and it
might threaten its solvency in the long run (Grant, 2016). The organisations often in pursuit
of over-trading and managing their losses in some part of the year tend to forget to cater to
needs of proper cash flow management. Our company that is WESTPAC as we have seen
was facing or recording fluctuating profits and at the same time it was able to increase its
assets and liabilities along with it. Hence we are concerned regarding any mismanagement or
serious issues in the cash flow of the company.
Year 2015 Year 2016 Year 2017
-25000
-20000
-15000
-10000
-5000
0
5000
10000
Analysis of Cash Flows from FY 2015-2017
$MILLION
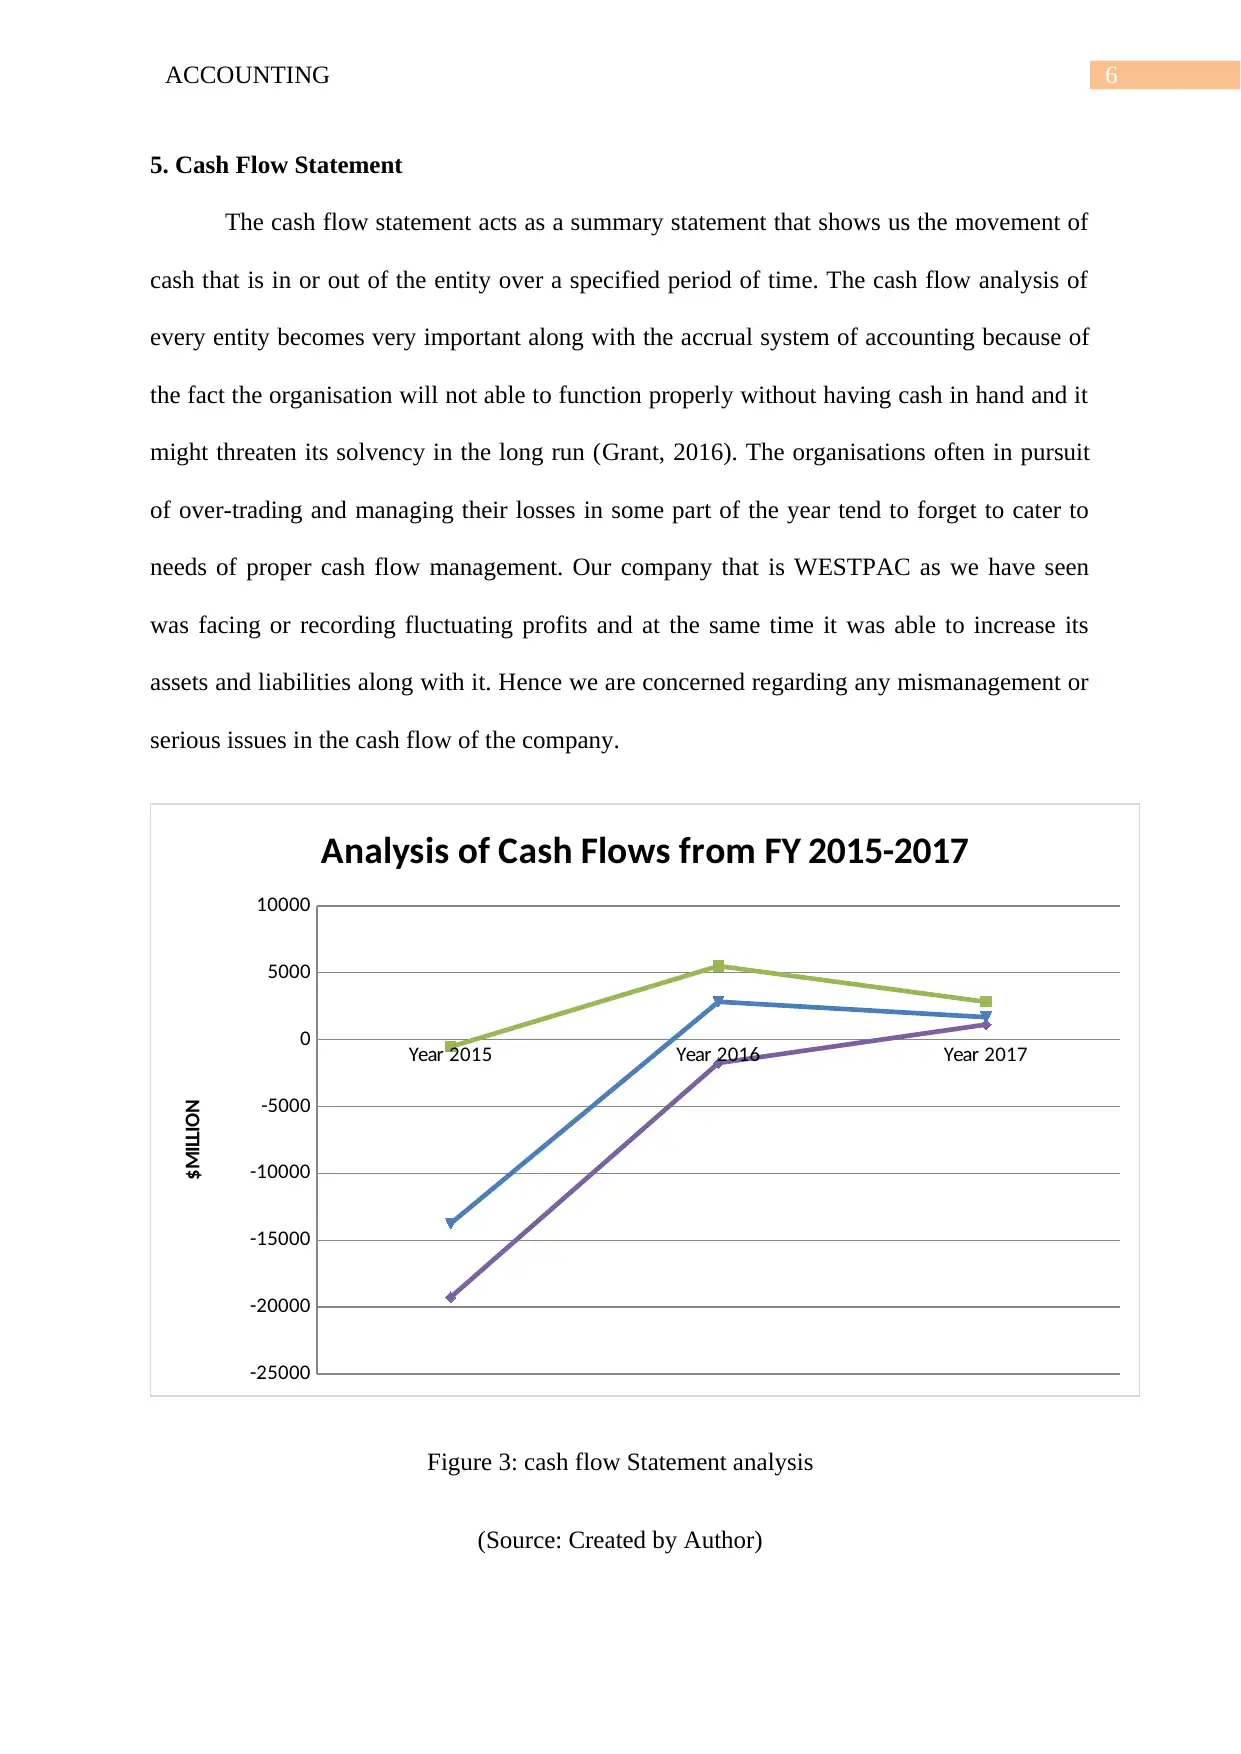
Figure 3: cash flow Statement analysis
(Source: Created by Author)
5. Cash Flow Statement
The cash flow statement acts as a summary statement that shows us the movement of
cash that is in or out of the entity over a specified period of time. The cash flow analysis of
every entity becomes very important along with the accrual system of accounting because of
the fact the organisation will not able to function properly without having cash in hand and it
might threaten its solvency in the long run (Grant, 2016). The organisations often in pursuit
of over-trading and managing their losses in some part of the year tend to forget to cater to
needs of proper cash flow management. Our company that is WESTPAC as we have seen
was facing or recording fluctuating profits and at the same time it was able to increase its
assets and liabilities along with it. Hence we are concerned regarding any mismanagement or
serious issues in the cash flow of the company.
Year 2015 Year 2016 Year 2017
-25000
-20000
-15000
-10000
-5000
0
5000
10000
Analysis of Cash Flows from FY 2015-2017
$MILLION
Figure 3: cash flow Statement analysis
(Source: Created by Author)
Paraphrase This Document
Need a fresh take? Get an instant paraphrase of this document with our AI Paraphraser
7ACCOUNTING
Cash flow from Operating Activities:
The cash flow from operating activities shows that how much cash an entity is able to
recover from its principle revenue generating source of income. From the analysis we can
find the company had increased its revenue from operating activities in the year 2016 but
again fell back to $2820 million though greater than that of year 2015 but very low than year
2016.
Cash flow from investing activities:
The investment pattern as reflected by the cash flow of the company shows how
considerably it has reduced its investment over the years. From ($18715million) in the year
2015 it has reduced to ($1698) in the year 2017.
Cash flow from Financing Activities:
This segment of the cash flow statement allows us to get the true picture of the way in
which the company is able to arrange its financial resources for carrying out its business
operations (Weygandt et al., 2015).
The analysis of the cash flow from financial activities shows that the company is
facing difficulty in arranging funds lately as the cash flow from financing activities have
reduced from $5513million in the year 2015 to $552million in the year 2017.
6. Financial Ratio Analysis:
1) PROFITABILITY RATIO:
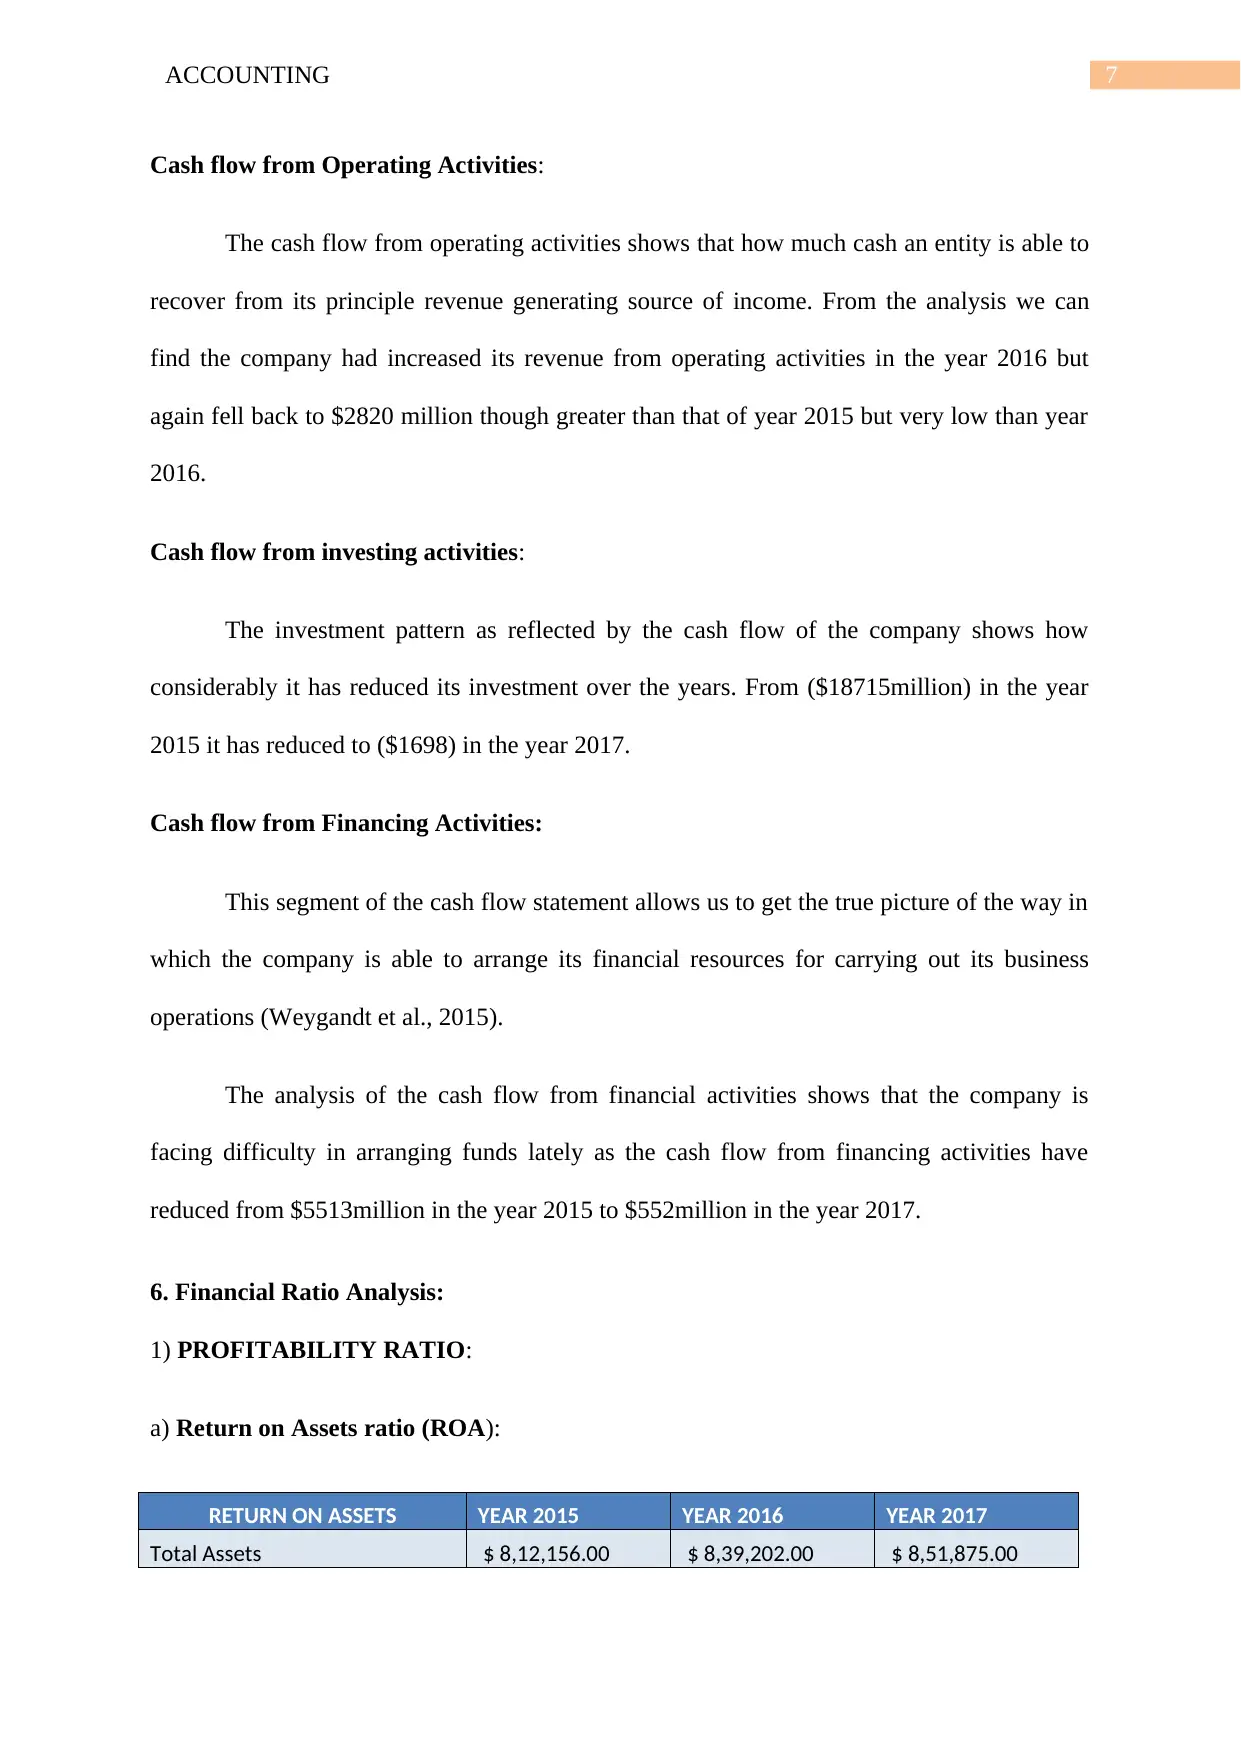
a) Return on Assets ratio (ROA):
RETURN ON ASSETS YEAR 2015 YEAR 2016 YEAR 2017
Total Assets $ 8,12,156.00 $ 8,39,202.00 $ 8,51,875.00
Cash flow from Operating Activities:
The cash flow from operating activities shows that how much cash an entity is able to
recover from its principle revenue generating source of income. From the analysis we can
find the company had increased its revenue from operating activities in the year 2016 but
again fell back to $2820 million though greater than that of year 2015 but very low than year
2016.
Cash flow from investing activities:
The investment pattern as reflected by the cash flow of the company shows how
considerably it has reduced its investment over the years. From ($18715million) in the year
2015 it has reduced to ($1698) in the year 2017.
Cash flow from Financing Activities:
This segment of the cash flow statement allows us to get the true picture of the way in
which the company is able to arrange its financial resources for carrying out its business
operations (Weygandt et al., 2015).
The analysis of the cash flow from financial activities shows that the company is
facing difficulty in arranging funds lately as the cash flow from financing activities have
reduced from $5513million in the year 2015 to $552million in the year 2017.
6. Financial Ratio Analysis:
1) PROFITABILITY RATIO:
a) Return on Assets ratio (ROA):
RETURN ON ASSETS YEAR 2015 YEAR 2016 YEAR 2017
Total Assets $ 8,12,156.00 $ 8,39,202.00 $ 8,51,875.00
8ACCOUNTING
Net Income $ 8,012.00 $ 7,445.00 $ 7,990.00
ROA (%) 0.99 0.89 0.94
In the banking, industry an asset turnover ratio of around 1 % is considered good. As
we can see from the analysis or comparison of the different year’s ratio the company has been
able to keep the return on asset close to 1%.
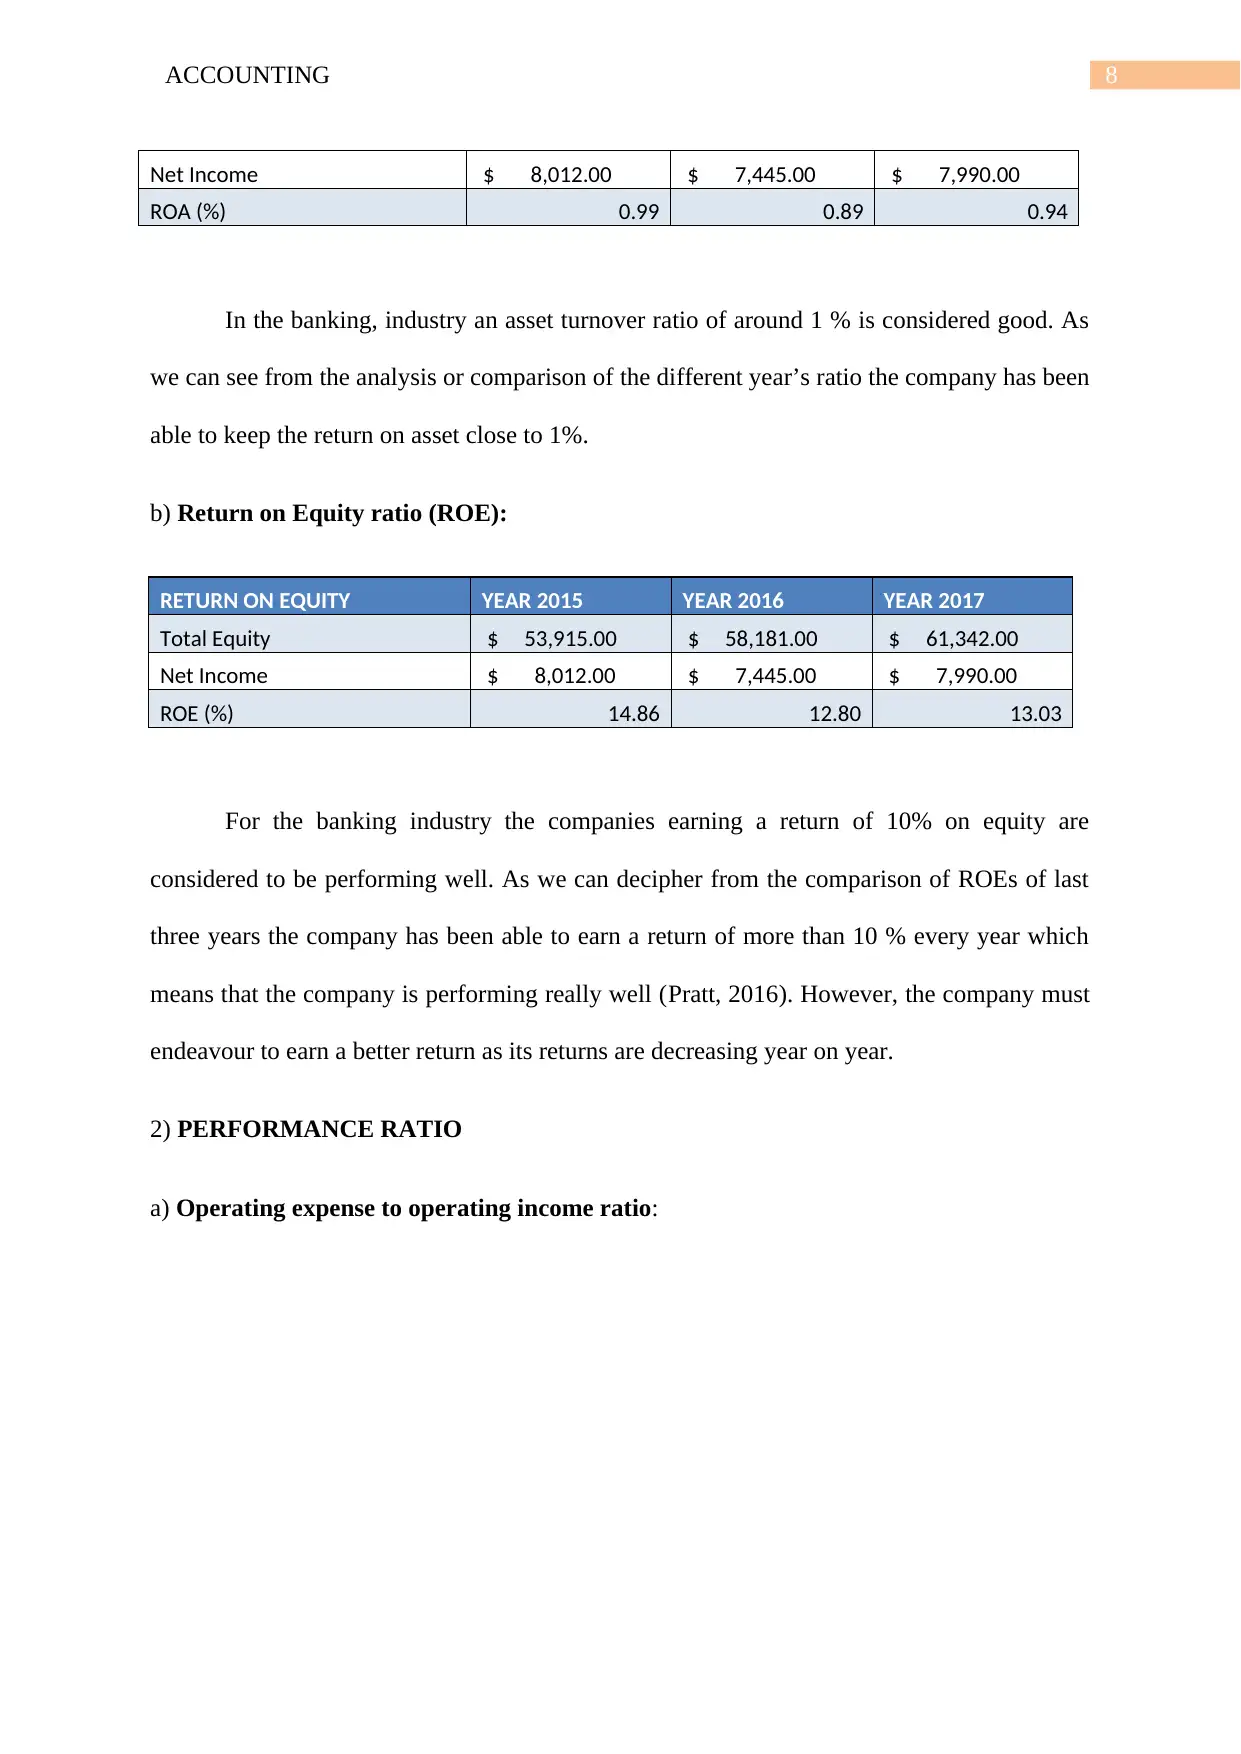
b) Return on Equity ratio (ROE):
RETURN ON EQUITY YEAR 2015 YEAR 2016 YEAR 2017
Total Equity $ 53,915.00 $ 58,181.00 $ 61,342.00
Net Income $ 8,012.00 $ 7,445.00 $ 7,990.00
ROE (%) 14.86 12.80 13.03
For the banking industry the companies earning a return of 10% on equity are
considered to be performing well. As we can decipher from the comparison of ROEs of last
three years the company has been able to earn a return of more than 10 % every year which
means that the company is performing really well (Pratt, 2016). However, the company must
endeavour to earn a better return as its returns are decreasing year on year.
2) PERFORMANCE RATIO
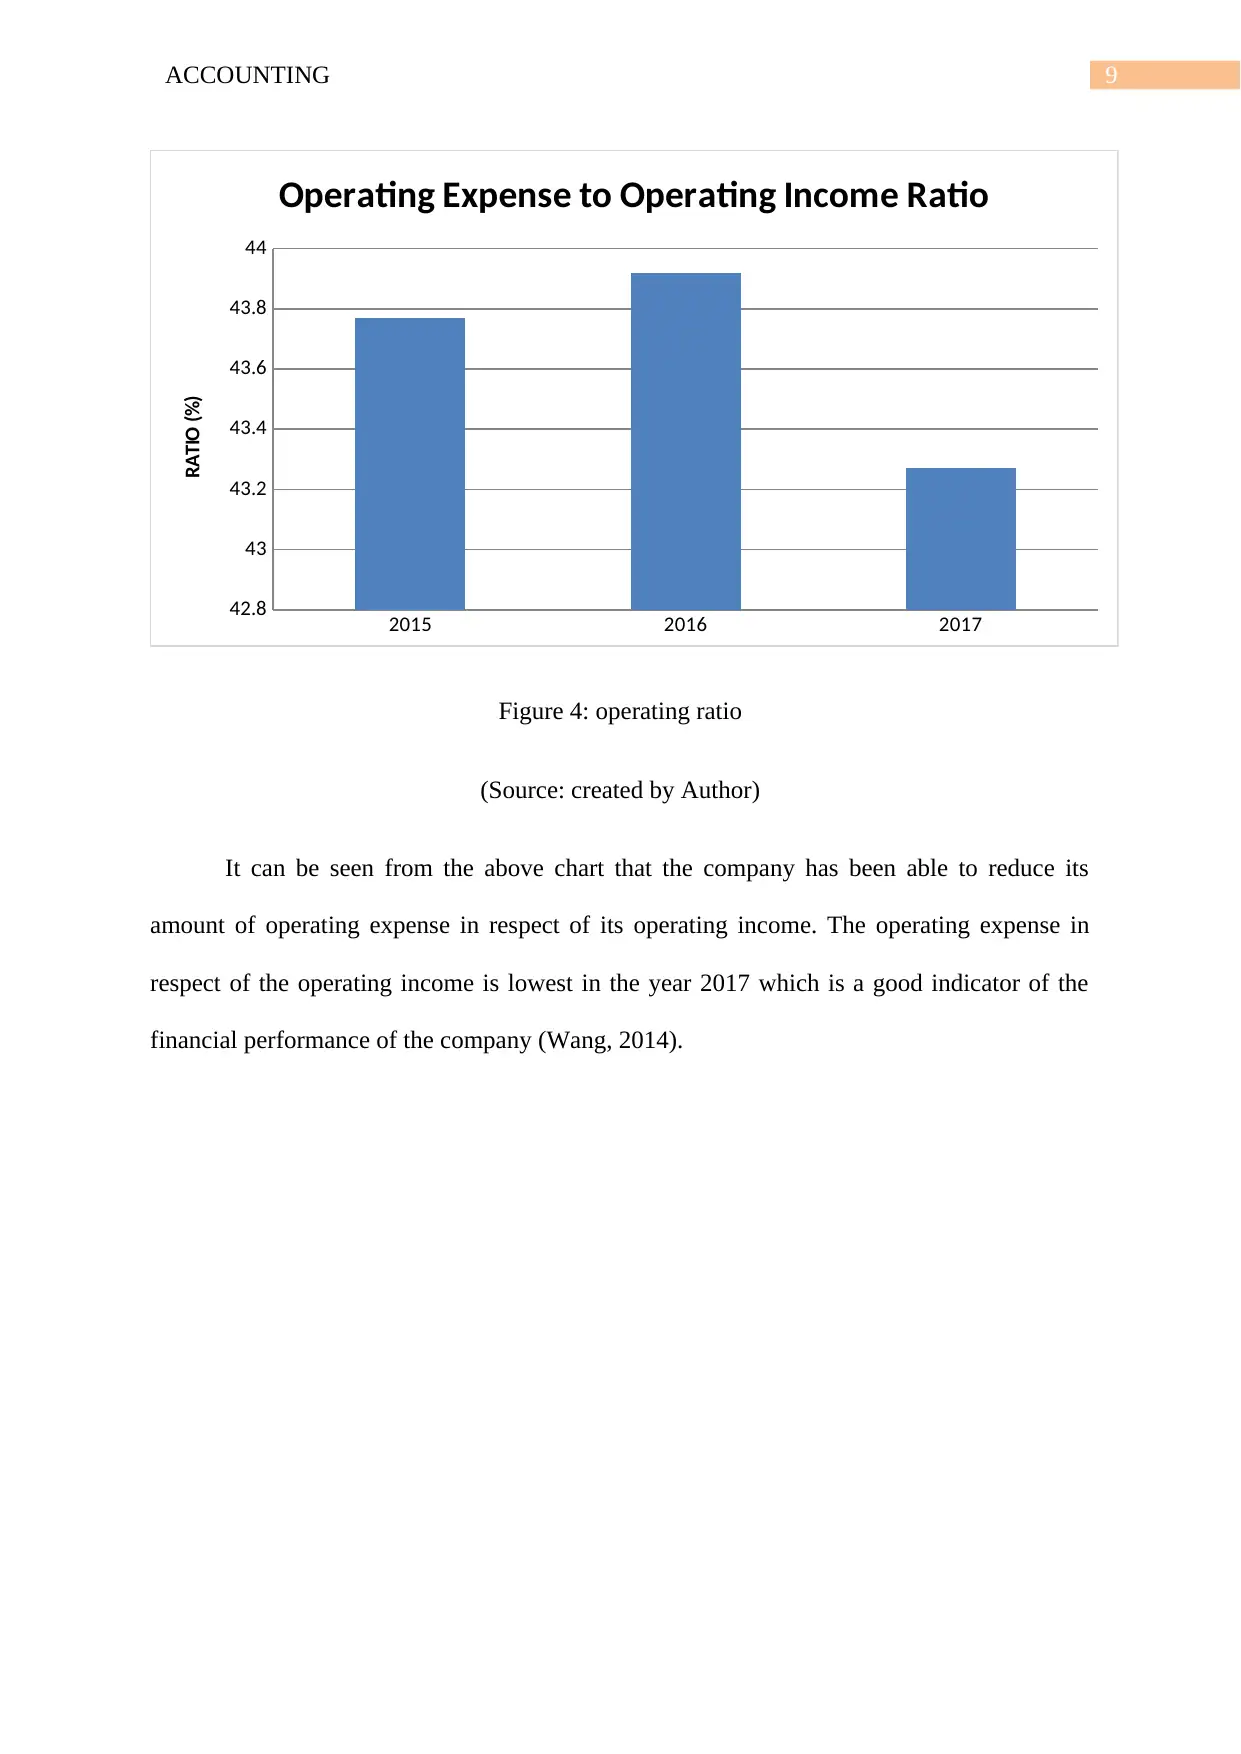
a) Operating expense to operating income ratio:
Net Income $ 8,012.00 $ 7,445.00 $ 7,990.00
ROA (%) 0.99 0.89 0.94
In the banking, industry an asset turnover ratio of around 1 % is considered good. As
we can see from the analysis or comparison of the different year’s ratio the company has been
able to keep the return on asset close to 1%.
b) Return on Equity ratio (ROE):
RETURN ON EQUITY YEAR 2015 YEAR 2016 YEAR 2017
Total Equity $ 53,915.00 $ 58,181.00 $ 61,342.00
Net Income $ 8,012.00 $ 7,445.00 $ 7,990.00
ROE (%) 14.86 12.80 13.03
For the banking industry the companies earning a return of 10% on equity are
considered to be performing well. As we can decipher from the comparison of ROEs of last
three years the company has been able to earn a return of more than 10 % every year which
means that the company is performing really well (Pratt, 2016). However, the company must
endeavour to earn a better return as its returns are decreasing year on year.
2) PERFORMANCE RATIO
a) Operating expense to operating income ratio:
⊘ This is a preview!⊘
Do you want full access?
Subscribe today to unlock all pages.
Trusted by 1+ million students worldwide
9ACCOUNTING
2015 2016 2017
42.8
43
43.2
43.4
43.6
43.8
44
Operating Expense to Operating Income Ratio
RATIO (%)
Figure 4: operating ratio
(Source: created by Author)
It can be seen from the above chart that the company has been able to reduce its
amount of operating expense in respect of its operating income. The operating expense in
respect of the operating income is lowest in the year 2017 which is a good indicator of the
financial performance of the company (Wang, 2014).
Paraphrase This Document
Need a fresh take? Get an instant paraphrase of this document with our AI Paraphraser
10ACCOUNTING
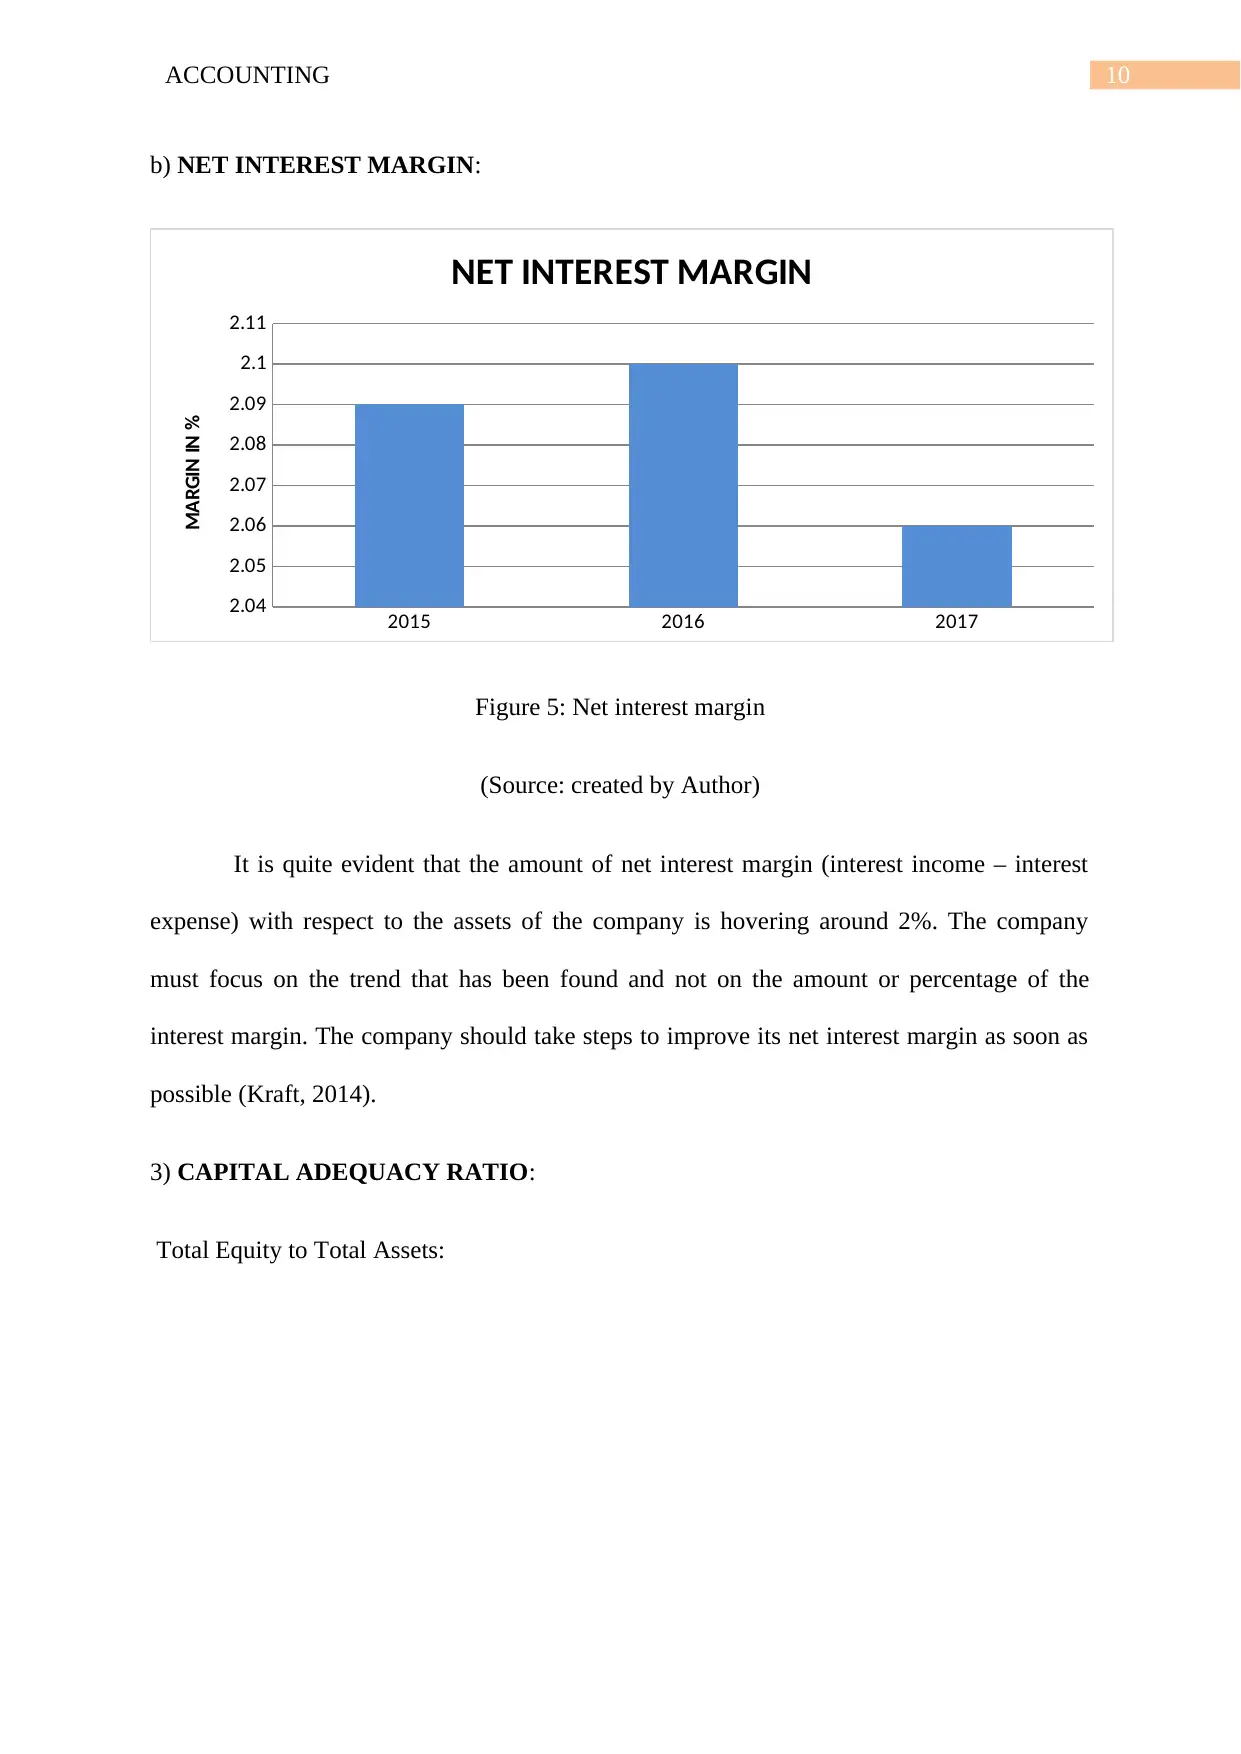
b) NET INTEREST MARGIN:
2015 2016 2017
2.04
2.05
2.06
2.07
2.08
2.09
2.1
2.11
NET INTEREST MARGIN
MARGIN IN %
Figure 5: Net interest margin
(Source: created by Author)
It is quite evident that the amount of net interest margin (interest income – interest
expense) with respect to the assets of the company is hovering around 2%. The company
must focus on the trend that has been found and not on the amount or percentage of the
interest margin. The company should take steps to improve its net interest margin as soon as
possible (Kraft, 2014).
3) CAPITAL ADEQUACY RATIO:
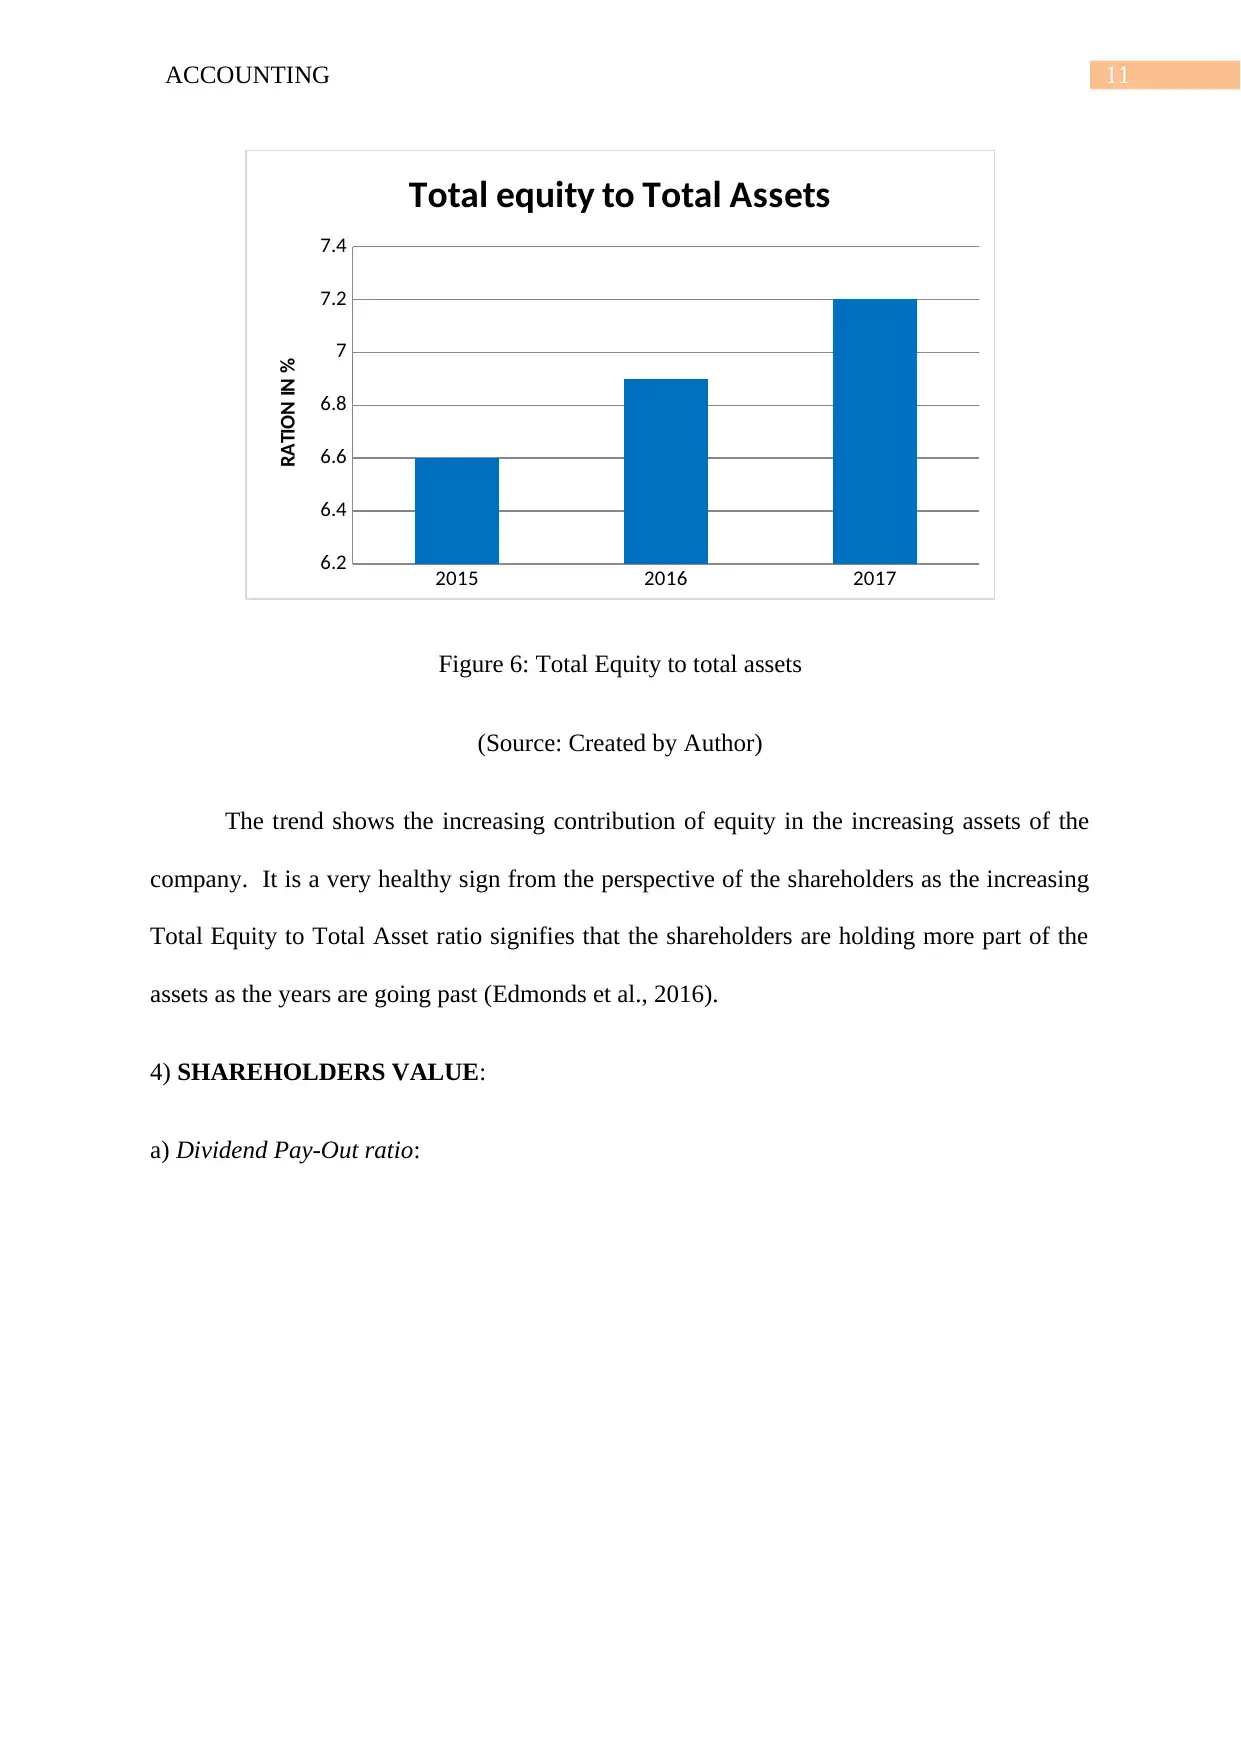
Total Equity to Total Assets:
b) NET INTEREST MARGIN:
2015 2016 2017
2.04
2.05
2.06
2.07
2.08
2.09
2.1
2.11
NET INTEREST MARGIN
MARGIN IN %
Figure 5: Net interest margin
(Source: created by Author)
It is quite evident that the amount of net interest margin (interest income – interest
expense) with respect to the assets of the company is hovering around 2%. The company
must focus on the trend that has been found and not on the amount or percentage of the
interest margin. The company should take steps to improve its net interest margin as soon as
possible (Kraft, 2014).
3) CAPITAL ADEQUACY RATIO:
Total Equity to Total Assets:
11ACCOUNTING
2015 2016 2017
6.2
6.4
6.6
6.8
7
7.2
7.4
Total equity to Total Assets
RATION IN %
Figure 6: Total Equity to total assets
(Source: Created by Author)
The trend shows the increasing contribution of equity in the increasing assets of the
company. It is a very healthy sign from the perspective of the shareholders as the increasing
Total Equity to Total Asset ratio signifies that the shareholders are holding more part of the
assets as the years are going past (Edmonds et al., 2016).
4) SHAREHOLDERS VALUE:
a) Dividend Pay-Out ratio:
⊘ This is a preview!⊘
Do you want full access?
Subscribe today to unlock all pages.
Trusted by 1+ million students worldwide
1 out of 21
Related Documents


Your All-in-One AI-Powered Toolkit for Academic Success.
+13062052269
info@desklib.com
Available 24*7 on WhatsApp / Email
![[object Object]](/_next/static/media/star-bottom.7253800d.svg)
Unlock your academic potential
Copyright © 2020–2026 A2Z Services. All Rights Reserved. Developed and managed by ZUCOL.