HND Business: Business Decision Making Report on Food for Friends
VerifiedAdded on 2020/06/03
|23
|3578
|300
Report
AI Summary
This report presents a detailed analysis of the business decision-making process for Food for Friends, a vegetarian restaurant planning to expand. The report begins by outlining the collection of primary and secondary data, including survey methodologies and questionnaire design to understand customer preferences. Data analysis techniques such as calculating central tendency, standard deviation, quartiles, percentiles, and correlation coefficients are employed to evaluate sales and profit data. Graphical representations are used to visualize trends and patterns. Further, the report incorporates project management tools like Gantt charts and financial analysis including Net Present Value (NPV) and Internal Rate of Return (IRR) to assess the financial viability of the expansion plan. The analysis provides recommendations based on the findings to support informed decision-making.

BUSINESS DECISION
MAKING
MAKING
Paraphrase This Document
Need a fresh take? Get an instant paraphrase of this document with our AI Paraphraser
Illustration Index
Illustration 1: Customers enjoy food................................................................................................4
Illustration 2: Satisfaction level on variety of food offered.............................................................4
Illustration 3: First preference of the customers..............................................................................5
Illustration 4: Satisfaction level from ambience..............................................................................6
Illustration 5: Column Chart............................................................................................................9
Illustration 6: Bar chart..................................................................................................................10
Illustration 7: Line chart.................................................................................................................10
Illustration 8: Scatter diagram........................................................................................................11
Illustration 9: Trend Line...............................................................................................................12
Illustration 10: Gantt Chart............................................................................................................16
Illustration 11: Critical path...........................................................................................................16
Index of Tables
Table 1: Data of sales and profits....................................................................................................6
Table 2: Calculation of central tendency.........................................................................................6
Table 3: Computation of standard deviation....................................................................................7
Table 4: Computation of Quartiles, Percentiles and coefficient of correlation...............................8
Table 5: Activities involved...........................................................................................................14
Table 6: Duration of activities and slack.......................................................................................14
Table 7: Computation of DCF and NPV........................................................................................16
Table 8: Computation of IRR........................................................................................................17
⊘ This is a preview!⊘
Do you want full access?
Subscribe today to unlock all pages.
Trusted by 1+ million students worldwide
INTRODUCTION
Decision making is an important activity that is conducted before investing in some new
business. It helps to assess that whether the investment will be feasible for the entity or not (Chen
and Hwang, 2012). Food for Friends is a vegetarian restaurant situated in historic South Lanes
which is planning to open its second restaurant in UK. The assignment discusses the primary
data collected to study the preferences of the customers. Further, sales and profits data is taken
into consideration to draw graphs and charts depicting the success of the restaurant. Gantt chart
is prepared to analyse the activities that conducted to start the restaurant. In the end, NPV and
IRR will be calculated to study the financial viability of the plan.
TASK 1
A.C. 1.1 Planning to collect primary and secondary data
Primary data is the first time collected data for anything which is not used before
anywhere. This data is the first hand data and it is specific research that is done for a specific
purpose. This can be modified according to the needs of the situation. This data can be collected
by anyone in any type like questionnaire, surveys, observation, communication i.e. direct and
indirect and many more. This data helps the market as it provides the proper information.
Secondary data is the second hand data as it is used by the others previously. It is an
information that already collected by the others. This data can be in any form like census,
internet searches and data are collected by the government that is used by the others according to
their needs. This data is time saving then the primary data as there is no need to research on
something as the data already exist.
If the market research is conducted by the company then they can use both type of data
according to the situation demands In market the primary data will give the information about
the new choices and the preferences of the customers and secondary data will tell about the
status of the product in the market. It will help to understand the growth, market, price, taste and
location preferences in order to understand that whether the decision of opening a second
restaurant is viable or not.
A.C.1.2 Survey methodology and sampling frame used
The survey conducted for Food for friends will consist of to type f data collection
methods. Primary data will be collected with the help of questionnaire, there data of 50
respondents will be collected. The questionnaire will consist of 10 questions which are relevant
1
Paraphrase This Document
Need a fresh take? Get an instant paraphrase of this document with our AI Paraphraser
to be asked in order to understand market perspective. It will have closed ended questions in
which respondent will require marking suitable option. The data received from these
respondents will be interpreted in order to find out the results. Random sampling method will be
used where the respondents will be selected on random basis. This technique will help to get
unbiased results from the population (Hacklin and Wallnöfer, 2012). Secondary data will be
collected based on the information already provided by Food for friends. Data of sales revenue
and profit will be taken into consideration to get valuable outcomes. It will help to understand
the historical sales and profit growth and relationship between both the figures to forecast the
future trend.
A.C. 1.3 Design of questionnaire
Primary data
Questionnaire
Name ….......................
Gender …....................
Age …........................
Question 1: Do you enjoy food served by Food for Friends?
Yes
No
Neutral
Question 2: Are you satisfied with the variety of food offered by Food for Friends?
Highly satisfied
Satisfied
Dissatisfied
Highly dissatisfied
Question 3: While visiting in a restaurant, what is the first thing you prefer the most?
Ambience
Service
Hygiene
Variety of menu
Price
Question 4: Are you satisfied with the ambience provided by Food for friends?
2
Highly satisfied
Satisfied
Dissatisfied
Highly dissatisfied
Rate the following services of Food for Friends from 1 to 5 where,
1 is very good, 2 is good, 3 is average, 4 is bad 5 is worst
Question 5: Attentiveness of staff 1 2 3 4 5
Question 6: Cleanliness
Question 7: Order time
Question 8: Environment
Question 9: Sitting arrangement
Question 10: Location of the restaurant
Question 11: What suggestion will you give to Food for friends restaurant?
Ans….................................................................................................................................................
...............................................................................................................................................
The questionnaire will help to assess the customer satisfaction level based on the services
provided by the restaurant. If the customers are not satisfied then it can raise the bar of quality
standards for its second restaurant. It will also help to analyse the preferred areas of the
customers and what are their expectations from the restaurant. The questionnaire contains yes or
no questions, multiple choice questions, ratings question and an open ended question which will
help to get suggestions from the customers.
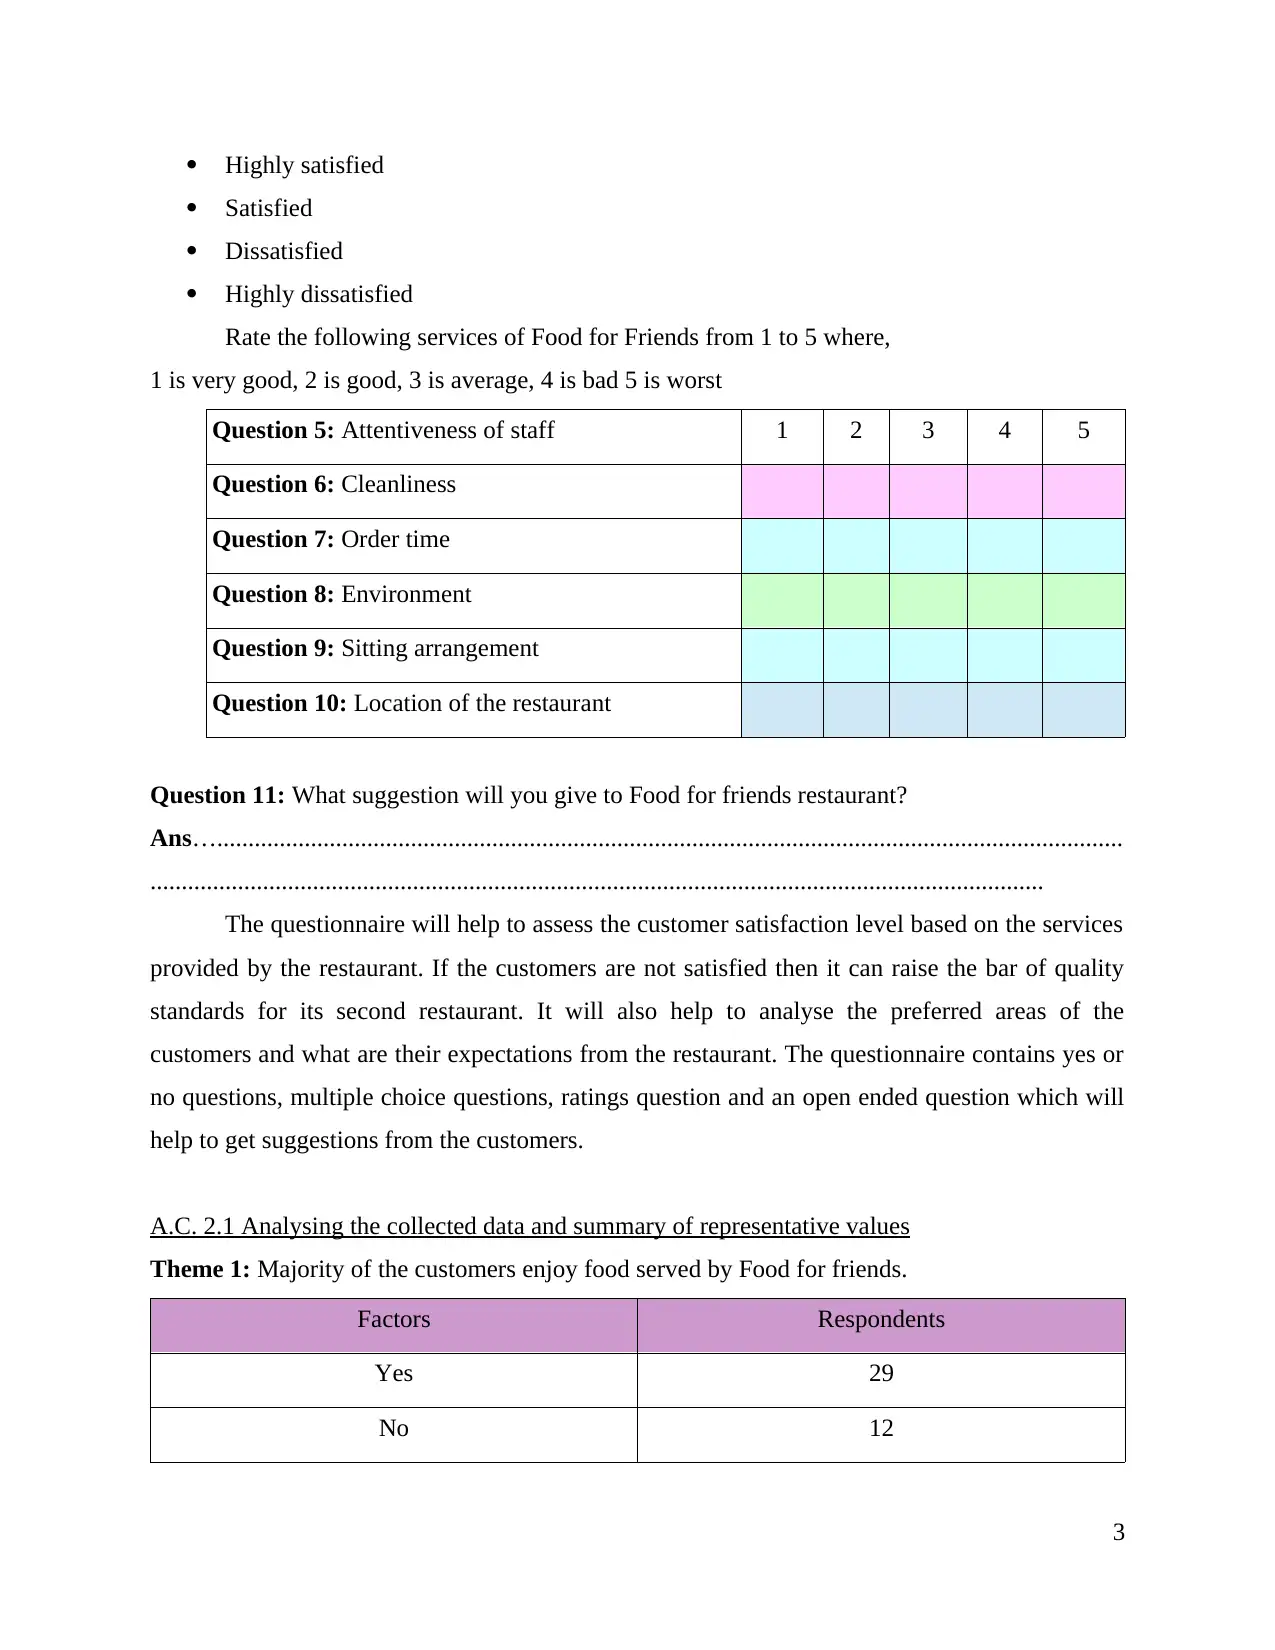
A.C. 2.1 Analysing the collected data and summary of representative values
Theme 1: Majority of the customers enjoy food served by Food for friends.
Factors Respondents
Yes 29
No 12
3
Satisfied
Dissatisfied
Highly dissatisfied
Rate the following services of Food for Friends from 1 to 5 where,
1 is very good, 2 is good, 3 is average, 4 is bad 5 is worst
Question 5: Attentiveness of staff 1 2 3 4 5
Question 6: Cleanliness
Question 7: Order time
Question 8: Environment
Question 9: Sitting arrangement
Question 10: Location of the restaurant
Question 11: What suggestion will you give to Food for friends restaurant?
Ans….................................................................................................................................................
...............................................................................................................................................
The questionnaire will help to assess the customer satisfaction level based on the services
provided by the restaurant. If the customers are not satisfied then it can raise the bar of quality
standards for its second restaurant. It will also help to analyse the preferred areas of the
customers and what are their expectations from the restaurant. The questionnaire contains yes or
no questions, multiple choice questions, ratings question and an open ended question which will
help to get suggestions from the customers.
A.C. 2.1 Analysing the collected data and summary of representative values
Theme 1: Majority of the customers enjoy food served by Food for friends.
Factors Respondents
Yes 29
No 12
3
⊘ This is a preview!⊘
Do you want full access?
Subscribe today to unlock all pages.
Trusted by 1+ million students worldwide
Neutral 9
Interpretation
Based on the above pie chart it can be interpreted that the customers are satisfied with the
food served by Food for Friends. Out of 50, 29 are satisfied and 12 are not satisfied.
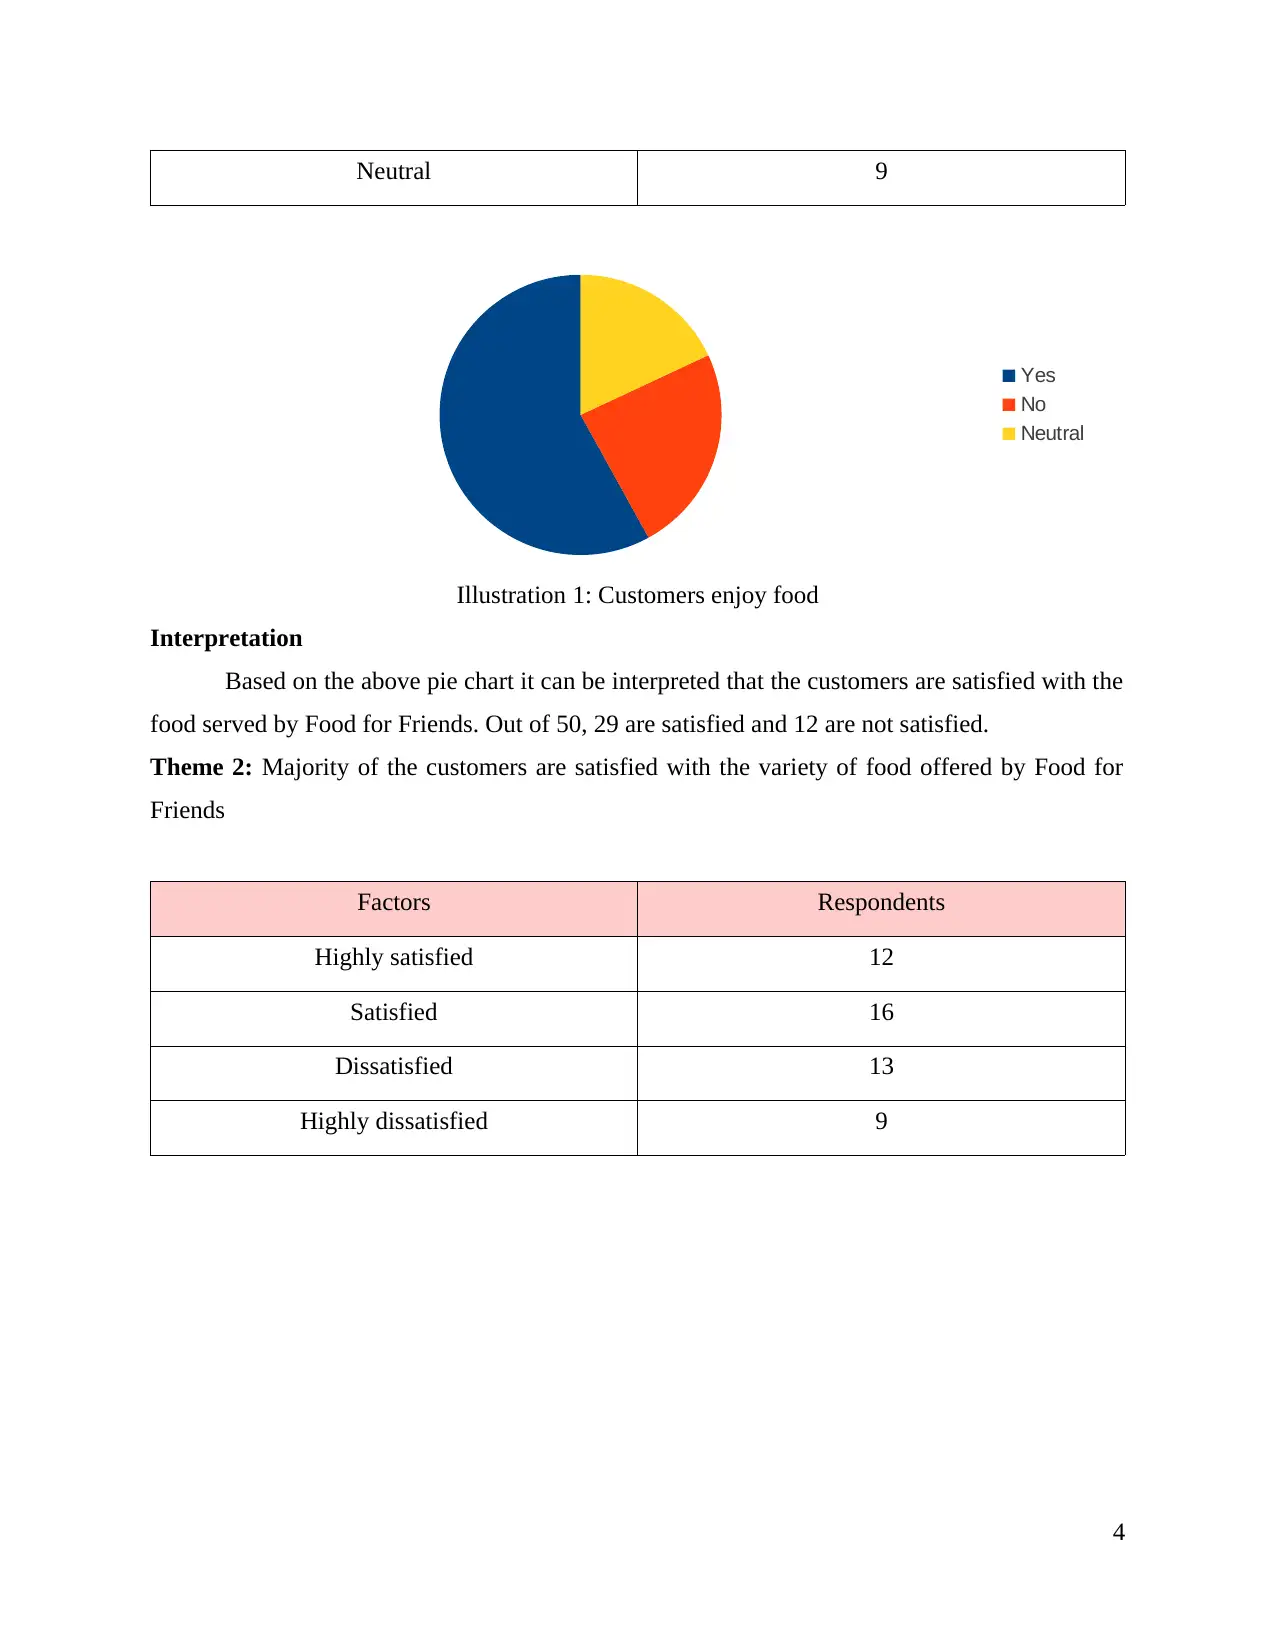
Theme 2: Majority of the customers are satisfied with the variety of food offered by Food for
Friends
Factors Respondents
Highly satisfied 12
Satisfied 16
Dissatisfied 13
Highly dissatisfied 9
4
Yes
No
Neutral
Illustration 1: Customers enjoy food
Interpretation
Based on the above pie chart it can be interpreted that the customers are satisfied with the
food served by Food for Friends. Out of 50, 29 are satisfied and 12 are not satisfied.
Theme 2: Majority of the customers are satisfied with the variety of food offered by Food for
Friends
Factors Respondents
Highly satisfied 12
Satisfied 16
Dissatisfied 13
Highly dissatisfied 9
4
Yes
No
Neutral
Illustration 1: Customers enjoy food
Paraphrase This Document
Need a fresh take? Get an instant paraphrase of this document with our AI Paraphraser
Interpretation
Out of 50 respondents, 16 customers are satisfied with the variety of food provided by
Food for Friends. However, 13 people are dissatisfied by the services. It is recommended that the
restaurant should increase the variety in its second restaurant in London.
Theme 3: Foremost preference of majority of the customers is hygiene while looking for the
restaurant
Factors Respondents
Ambiance 7
Service 5
Hygiene 15
Variety of menu 11
Price 12
5
Highly satisfied
Satisfied
Dissatisfied
Highly dissatisfied
Illustration 2: Satisfaction level on variety of food offered
Out of 50 respondents, 16 customers are satisfied with the variety of food provided by
Food for Friends. However, 13 people are dissatisfied by the services. It is recommended that the
restaurant should increase the variety in its second restaurant in London.
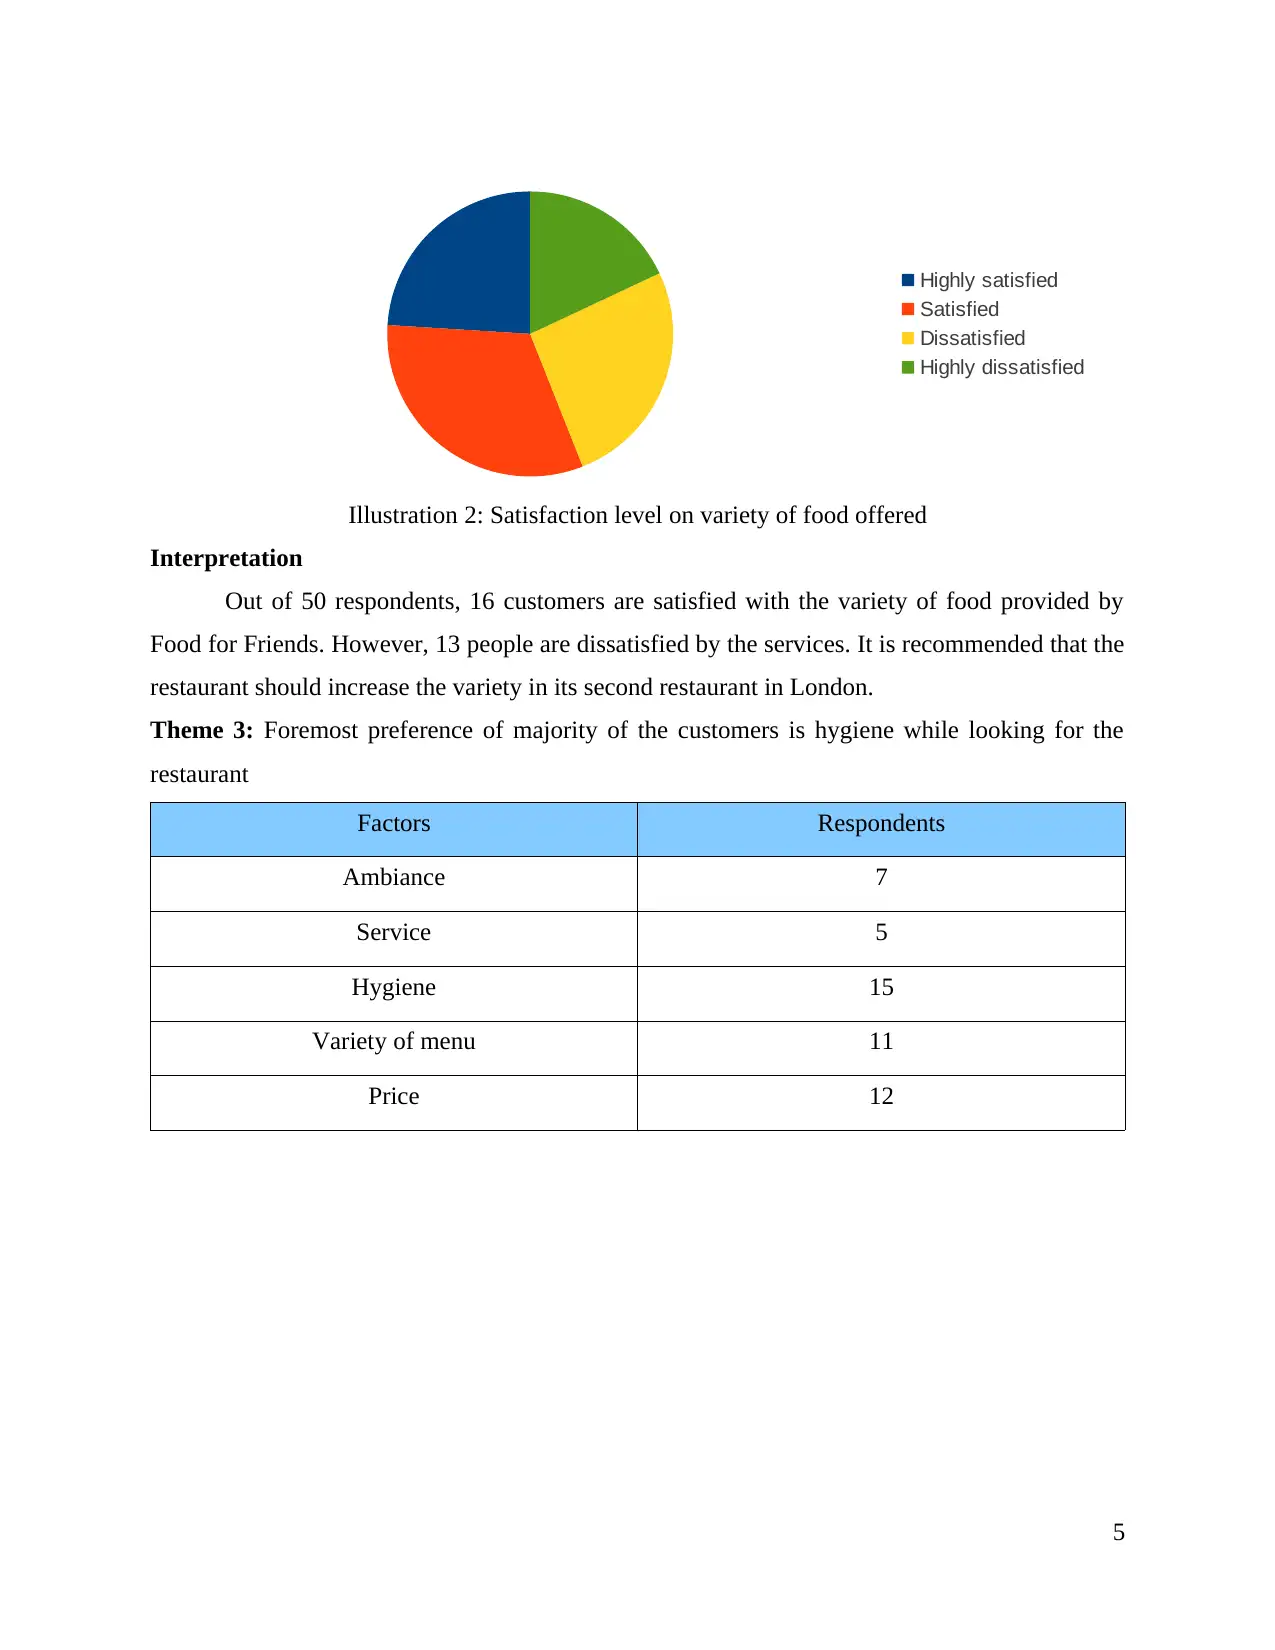
Theme 3: Foremost preference of majority of the customers is hygiene while looking for the
restaurant
Factors Respondents
Ambiance 7
Service 5
Hygiene 15
Variety of menu 11
Price 12
5
Highly satisfied
Satisfied
Dissatisfied
Highly dissatisfied
Illustration 2: Satisfaction level on variety of food offered
Interpretation
The customer prefer hygiene over anything while selecting restaurant for visit. Price is
the second factor considered by the customers. It shows that Food for Friends should concentrate
on these two factors in its second restaurant.
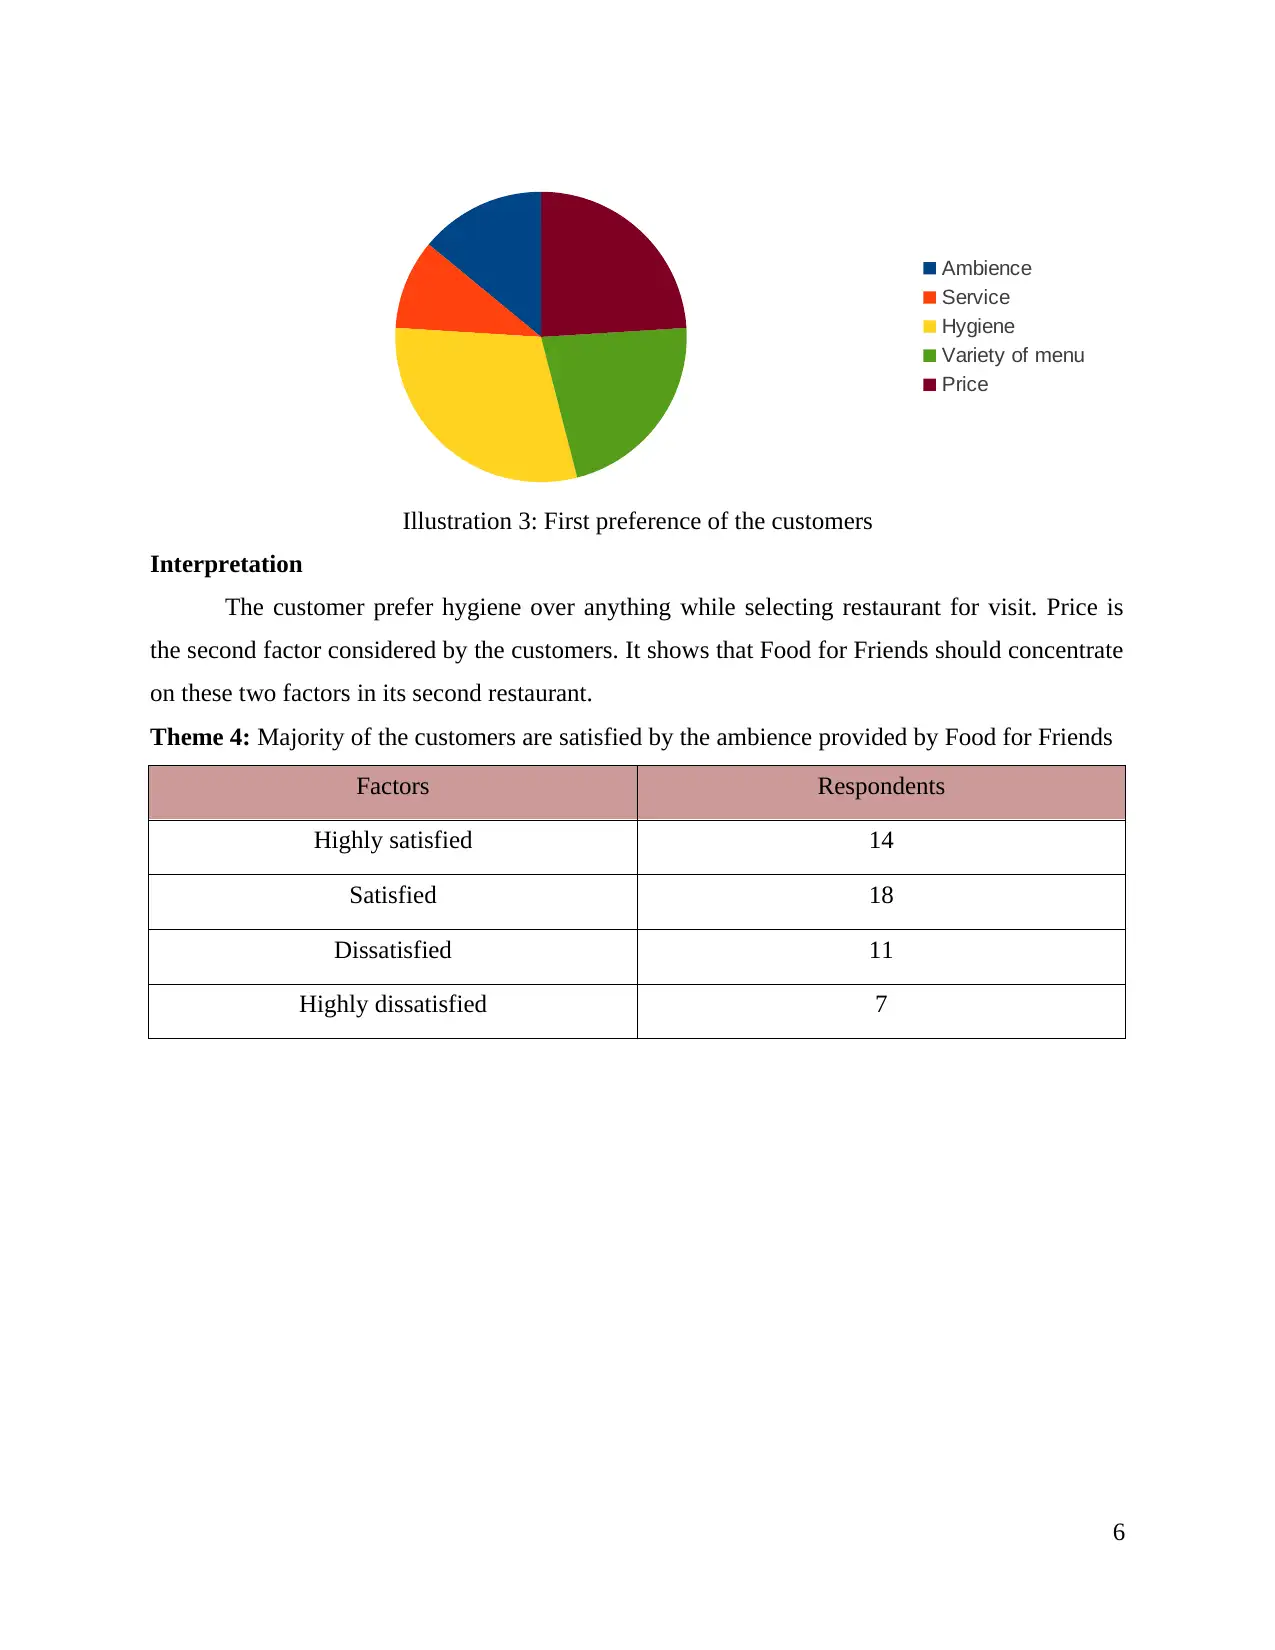
Theme 4: Majority of the customers are satisfied by the ambience provided by Food for Friends
Factors Respondents
Highly satisfied 14
Satisfied 18
Dissatisfied 11
Highly dissatisfied 7
6
Ambience
Service
Hygiene
Variety of menu
Price
Illustration 3: First preference of the customers
The customer prefer hygiene over anything while selecting restaurant for visit. Price is
the second factor considered by the customers. It shows that Food for Friends should concentrate
on these two factors in its second restaurant.
Theme 4: Majority of the customers are satisfied by the ambience provided by Food for Friends
Factors Respondents
Highly satisfied 14
Satisfied 18
Dissatisfied 11
Highly dissatisfied 7
6
Ambience
Service
Hygiene
Variety of menu
Price
Illustration 3: First preference of the customers
⊘ This is a preview!⊘
Do you want full access?
Subscribe today to unlock all pages.
Trusted by 1+ million students worldwide
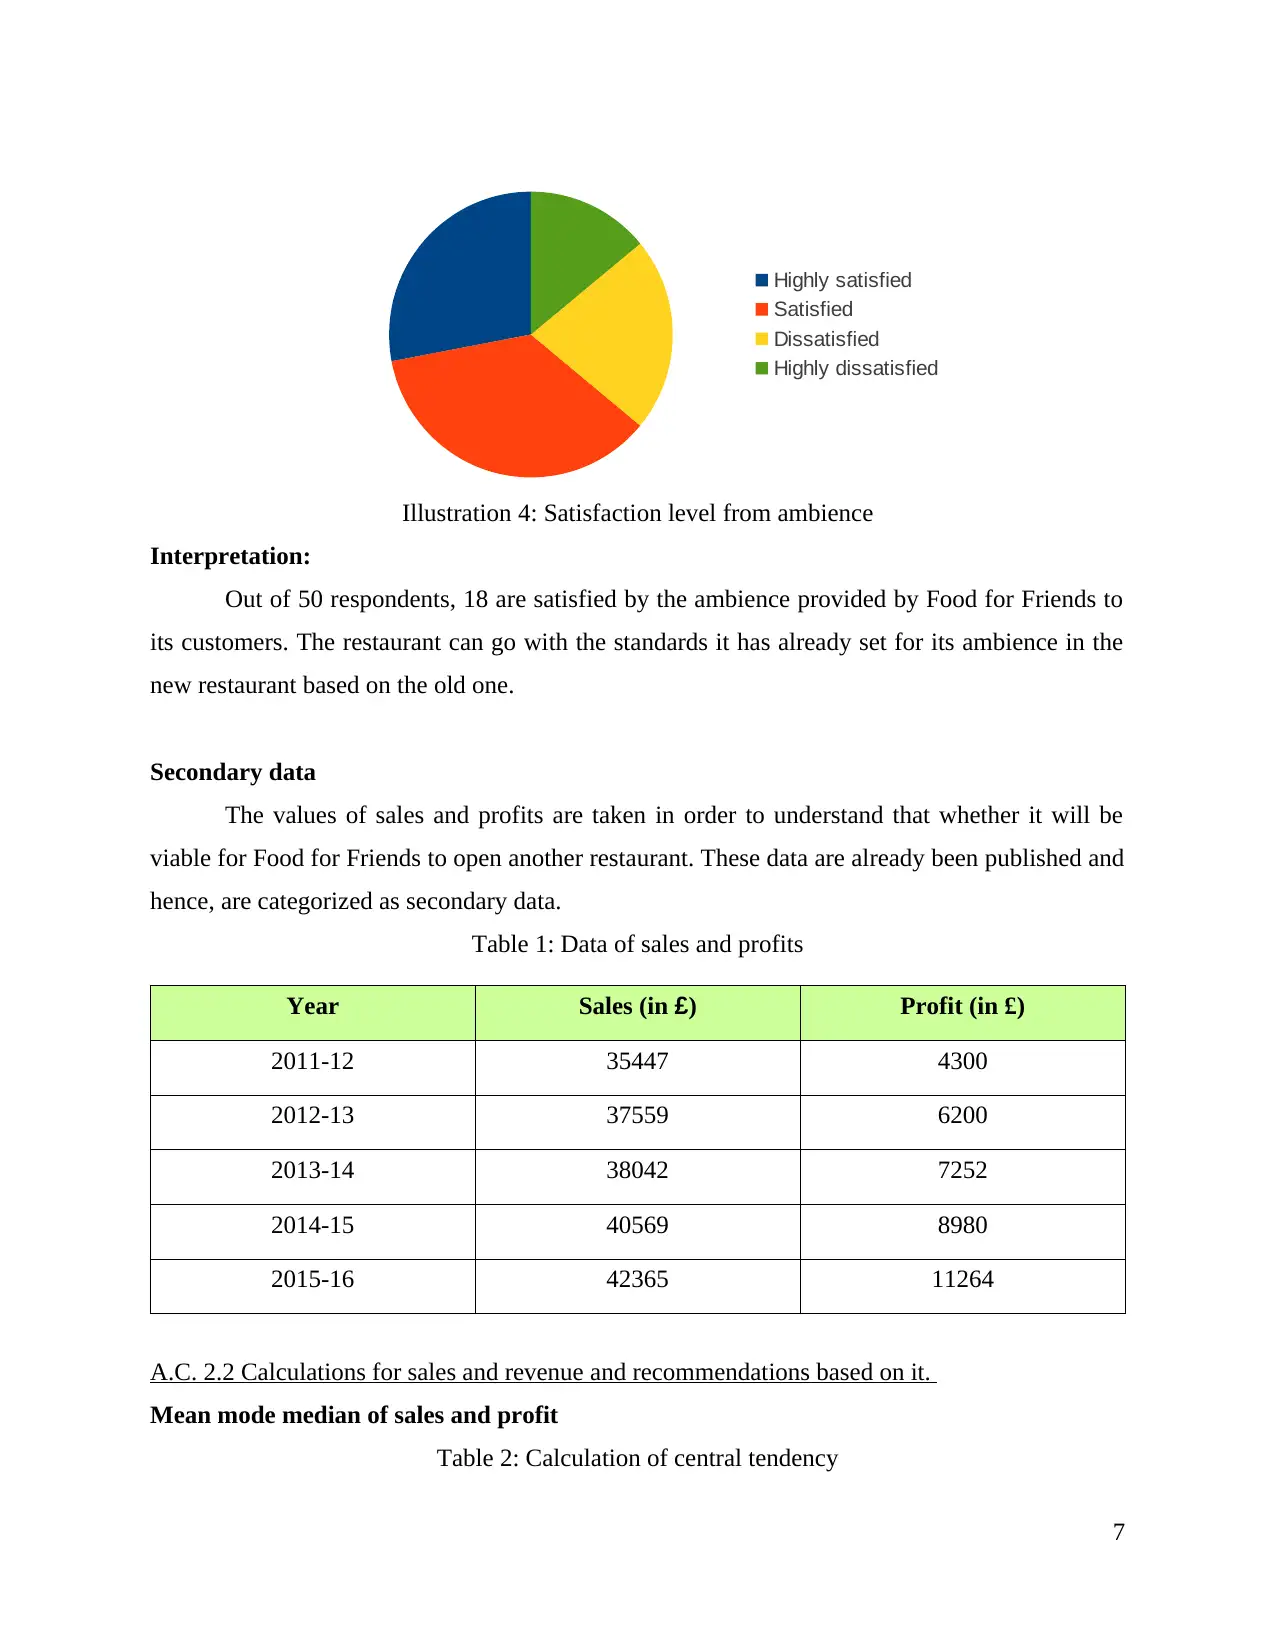
Interpretation:
Out of 50 respondents, 18 are satisfied by the ambience provided by Food for Friends to
its customers. The restaurant can go with the standards it has already set for its ambience in the
new restaurant based on the old one.
Secondary data
The values of sales and profits are taken in order to understand that whether it will be
viable for Food for Friends to open another restaurant. These data are already been published and
hence, are categorized as secondary data.
Table 1: Data of sales and profits
Year Sales (in £) Profit (in £)
2011-12 35447 4300
2012-13 37559 6200
2013-14 38042 7252
2014-15 40569 8980
2015-16 42365 11264
A.C. 2.2 Calculations for sales and revenue and recommendations based on it.
Mean mode median of sales and profit
Table 2: Calculation of central tendency
7
Highly satisfied
Satisfied
Dissatisfied
Highly dissatisfied
Illustration 4: Satisfaction level from ambience
Paraphrase This Document
Need a fresh take? Get an instant paraphrase of this document with our AI Paraphraser
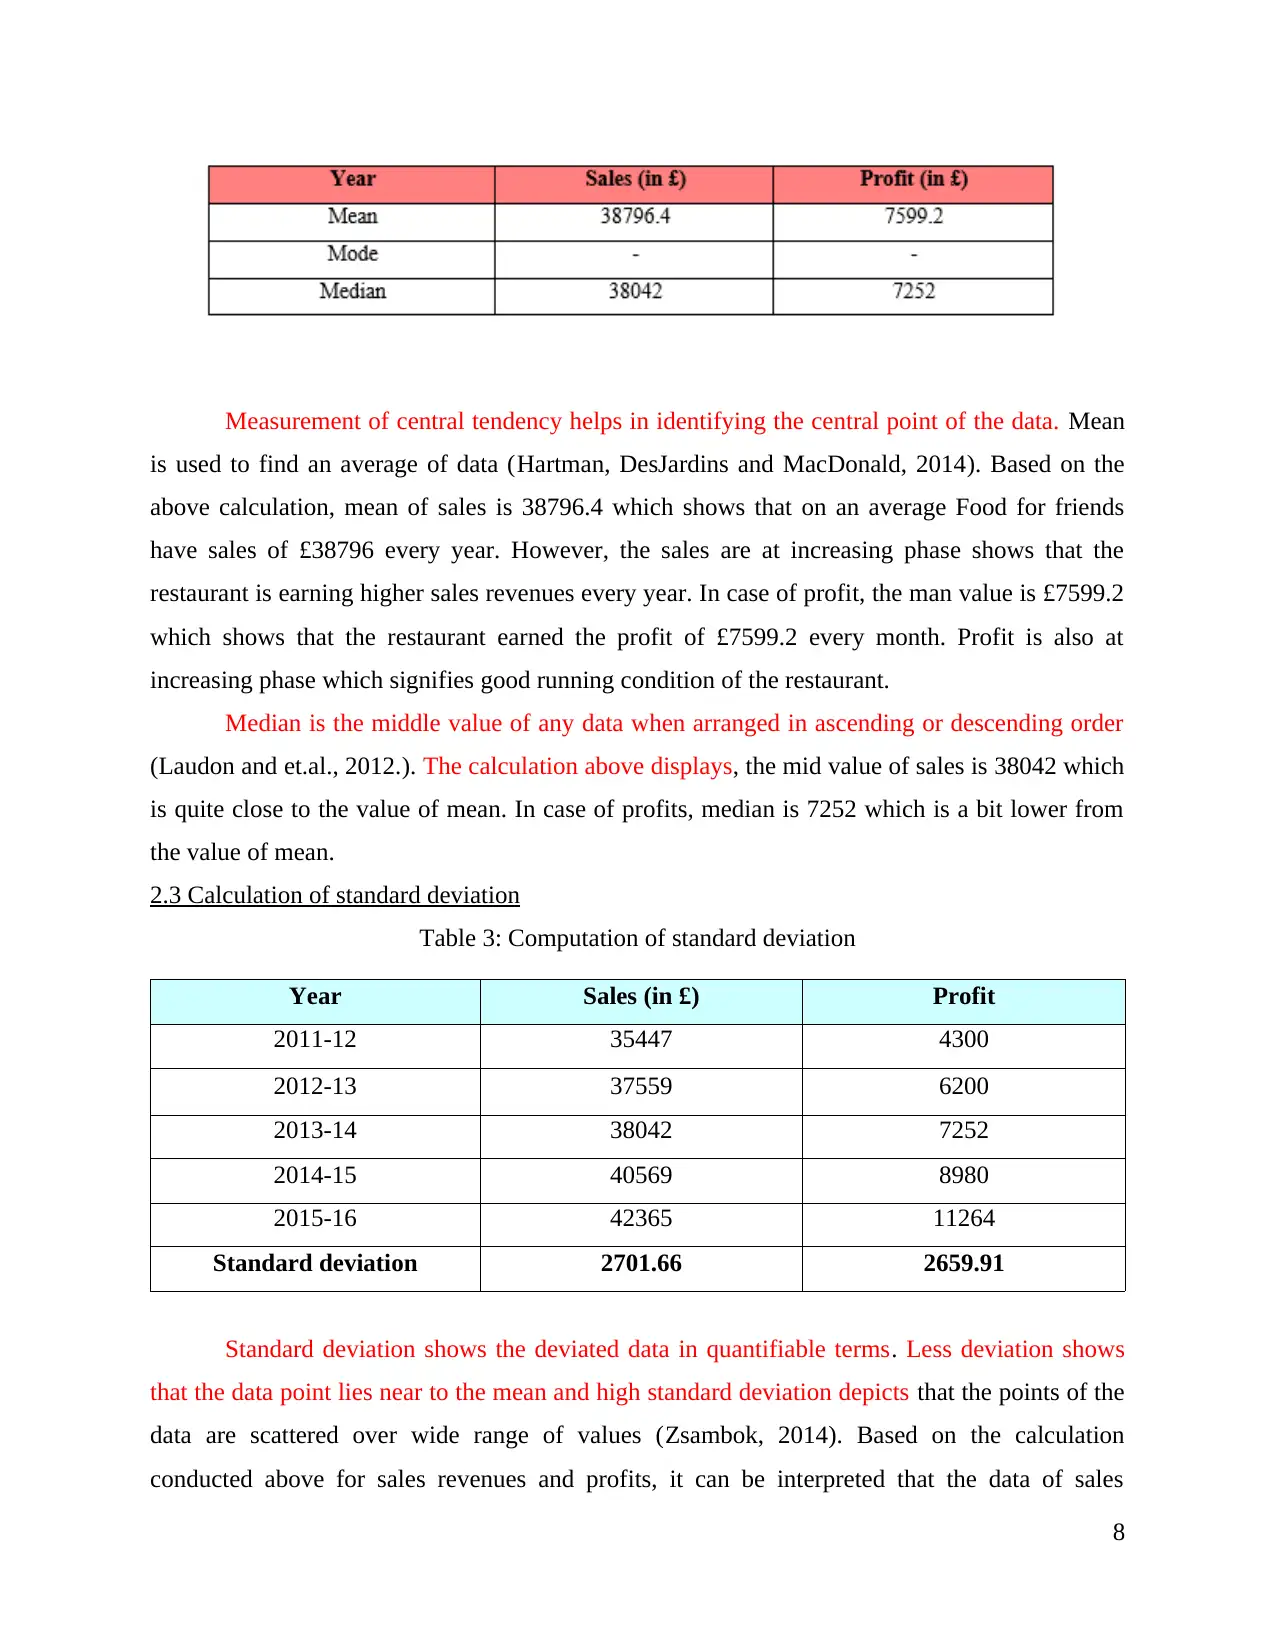
Measurement of central tendency helps in identifying the central point of the data. Mean
is used to find an average of data (Hartman, DesJardins and MacDonald, 2014). Based on the
above calculation, mean of sales is 38796.4 which shows that on an average Food for friends
have sales of £38796 every year. However, the sales are at increasing phase shows that the
restaurant is earning higher sales revenues every year. In case of profit, the man value is £7599.2
which shows that the restaurant earned the profit of £7599.2 every month. Profit is also at
increasing phase which signifies good running condition of the restaurant.
Median is the middle value of any data when arranged in ascending or descending order
(Laudon and et.al., 2012.). The calculation above displays, the mid value of sales is 38042 which
is quite close to the value of mean. In case of profits, median is 7252 which is a bit lower from
the value of mean.
2.3 Calculation of standard deviation
Table 3: Computation of standard deviation
Year Sales (in £) Profit
2011-12 35447 4300
2012-13 37559 6200
2013-14 38042 7252
2014-15 40569 8980
2015-16 42365 11264
Standard deviation 2701.66 2659.91
Standard deviation shows the deviated data in quantifiable terms. Less deviation shows
that the data point lies near to the mean and high standard deviation depicts that the points of the
data are scattered over wide range of values (Zsambok, 2014). Based on the calculation
conducted above for sales revenues and profits, it can be interpreted that the data of sales
8
revenue and profits both is highly scattered between wide rage of values due to presence of high
standard deviation.
2.4 Calculating quartiles, percentiles and coefficient correlation
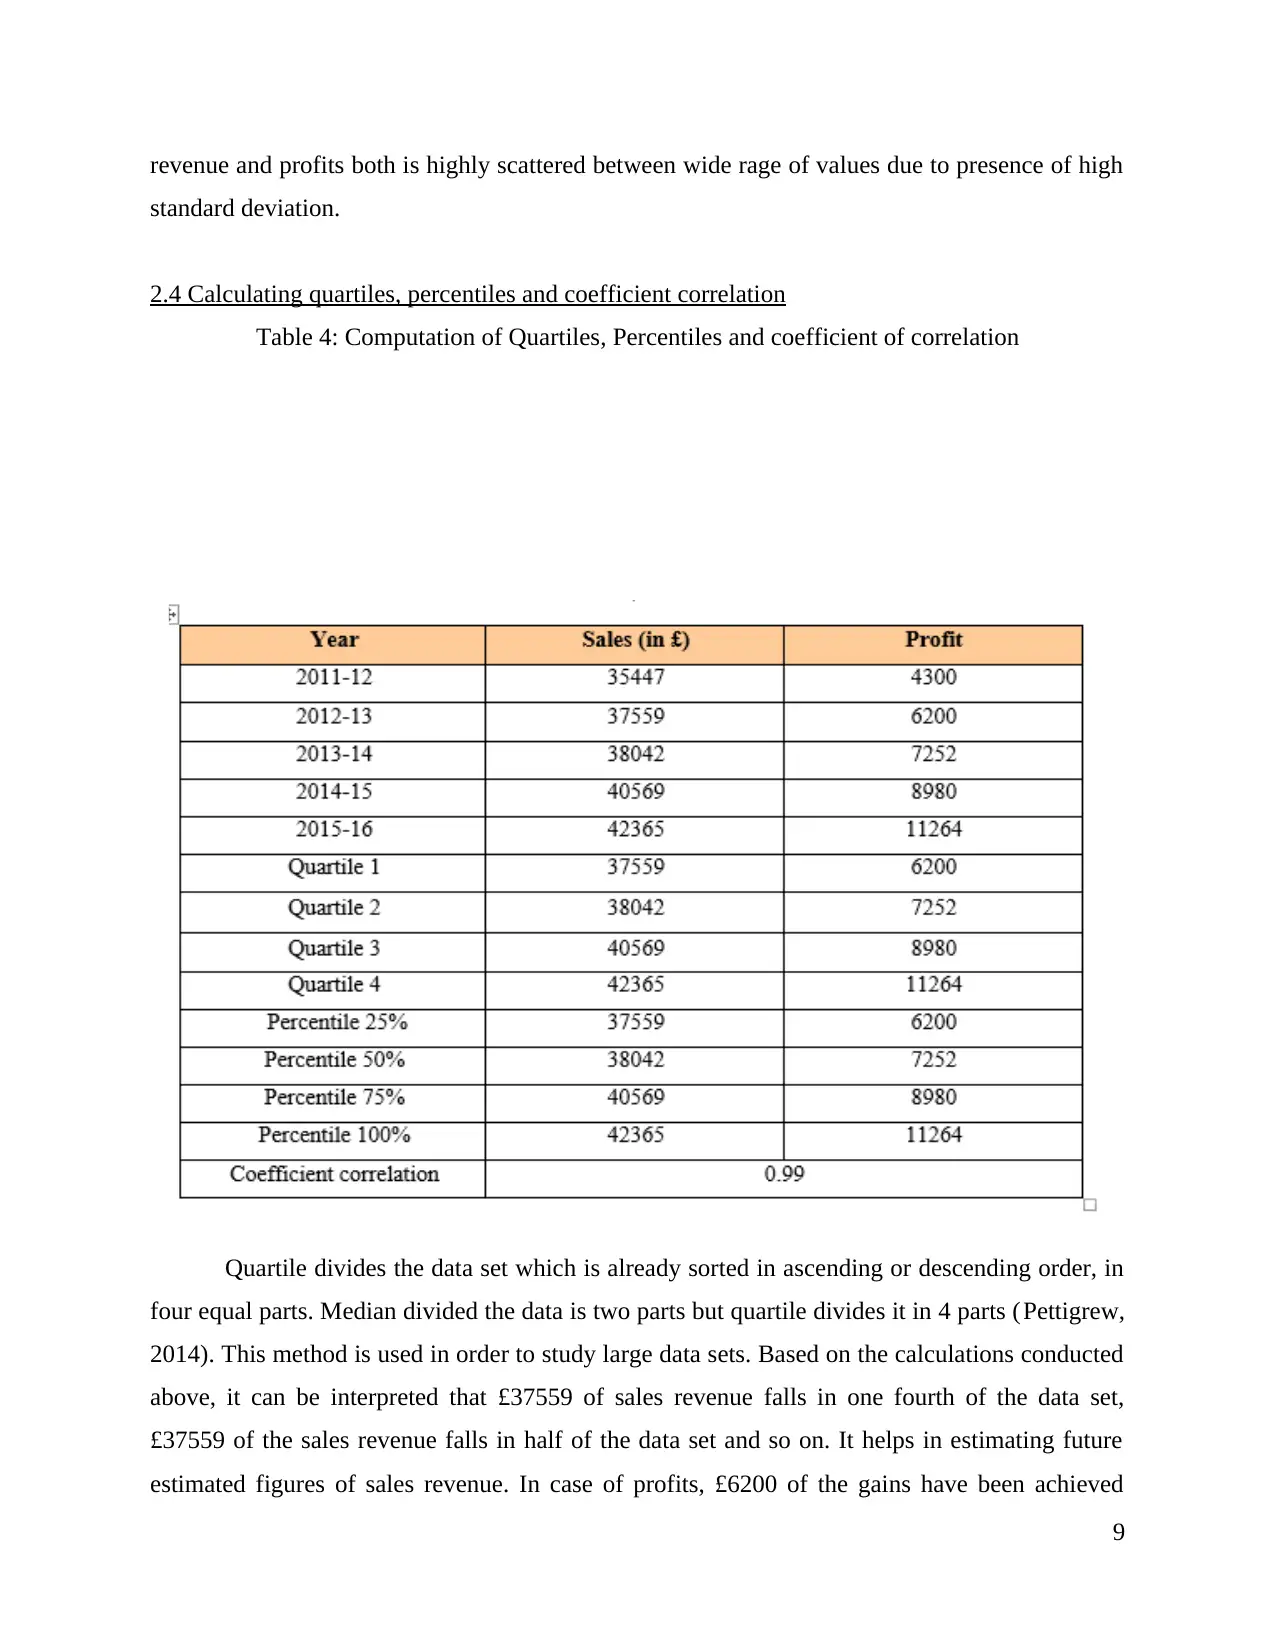
Table 4: Computation of Quartiles, Percentiles and coefficient of correlation
Quartile divides the data set which is already sorted in ascending or descending order, in
four equal parts. Median divided the data is two parts but quartile divides it in 4 parts (Pettigrew,
2014). This method is used in order to study large data sets. Based on the calculations conducted
above, it can be interpreted that £37559 of sales revenue falls in one fourth of the data set,
£37559 of the sales revenue falls in half of the data set and so on. It helps in estimating future
estimated figures of sales revenue. In case of profits, £6200 of the gains have been achieved
9
standard deviation.
2.4 Calculating quartiles, percentiles and coefficient correlation
Table 4: Computation of Quartiles, Percentiles and coefficient of correlation
Quartile divides the data set which is already sorted in ascending or descending order, in
four equal parts. Median divided the data is two parts but quartile divides it in 4 parts (Pettigrew,
2014). This method is used in order to study large data sets. Based on the calculations conducted
above, it can be interpreted that £37559 of sales revenue falls in one fourth of the data set,
£37559 of the sales revenue falls in half of the data set and so on. It helps in estimating future
estimated figures of sales revenue. In case of profits, £6200 of the gains have been achieved
9
⊘ This is a preview!⊘
Do you want full access?
Subscribe today to unlock all pages.
Trusted by 1+ million students worldwide
1 out of 23
Related Documents


Your All-in-One AI-Powered Toolkit for Academic Success.
+13062052269
info@desklib.com
Available 24*7 on WhatsApp / Email
![[object Object]](/_next/static/media/star-bottom.7253800d.svg)
Unlock your academic potential
Copyright © 2020–2026 A2Z Services. All Rights Reserved. Developed and managed by ZUCOL.