Analysis of CBT Treatment Outcomes, Gambling, and Addiction Factors
VerifiedAdded on 2023/01/16
|15
|2855
|75
Report
AI Summary
This research report analyzes data related to Cognitive Behavioral Therapy (CBT) treatment outcomes for individuals with gambling disorder, using statistical methods like regression and independent sample t-tests. The study investigates whether changes observed after CBT are maintained at 1 and 6 months post-treatment, and examines the influence of socioeconomic factors and gender on alcohol and drug consumption, as well as their potential link to gambling behavior. Key findings indicate a significant difference in gambling disorder levels between genders after diagnosis, with the alternative hypothesis accepted. Regression analysis reveals that follow-up results do not necessarily predict outcomes at 6 months, and socioeconomic status significantly impacts gambling disorder. The analysis also explores the relationship between gender and alcohol/drug use, finding significant differences, while socioeconomic status shows no significant correlation with alcohol or drug consumption. The report concludes by discussing the implications of these findings for clinical practice and patient engagement with CBT.

ADDICTION
Paraphrase This Document
Need a fresh take? Get an instant paraphrase of this document with our AI Paraphraser
TABLE OF CONTENTS
INTRODUCTION...........................................................................................................................1
Methods............................................................................................................................................1
Results..............................................................................................................................................1
Gender and gambling disorder after diagnosis............................................................................1
PGSI follow up and PGSI after 6 months...................................................................................3
Socio economic status and GD after follow up...........................................................................4
Gender and alcohol.....................................................................................................................6
Socio economic status and alcohol.............................................................................................7
Gender and drug..........................................................................................................................9
Socio economic status and drug................................................................................................10
Discussion......................................................................................................................................11
CONCLUSION..............................................................................................................................12
REFERENCES..............................................................................................................................13
INTRODUCTION
In present research study data related to those who receive CBT treatment is analysed by
using varied tools. Main aim of the study is to identify whether changes that are observed due to
CBT in patient behaviour remain same one month and 6 months after competition of CBT or
better results are seen after 6 months of receipt of CBT. Focus is also on identifying whether
socio economic factors and gender lead to intake of more alcohol and drug. Excessive
consumption of these two may also lead to development of habit of gambling among individuals.
Hypothesis was that CBT results vary after receiving treatment in first and sixth month.
Hypothesis was that socio economic and gender factor promote intake of drug and alcohol.
Relevant techniques are applied to test this hypothesis. In this way, entire research is carried out.
Methods
There are number of statistical methods that are used for analysing business data. In the
present research study, multiple techniques are used like regression and independent sample t
test. Regression is the one of the most important approach used to find out dependent and
independent relationship between variables (Little. and Rubin., 2019). This tool reflect extent to
which dependent variable is affected by the independent variable. Whether independent variable
affect dependent variable to great extent or moderately. Independent sample T test are used in
case where there are multiple independent variables. In this tool specific number of variables are
tested against the specific categorical variable. Thus, it can be said that by using most relevant
tool data analysis can be done in better way.
Results
Gender and gambling disorder after diagnosis
H0: There is no significant difference between male and female in respect to level of gambling
disorder found among them after diagnosis.
H1: There is significant difference between male and female in respect to level of gambling
disorder found among them after diagnosis.
Group Statistics
1
⊘ This is a preview!⊘
Do you want full access?
Subscribe today to unlock all pages.
Trusted by 1+ million students worldwide
gender N Mean Std.
Deviation
Std. Error
Mean
dsm5Diag6m Female 590 1.49 .500 .021
Male 906 1.60 .490 .016
Independent Samples Test
Levene's
Test for
Equality of
Variances
t-test for Equality of Means
F Sig. t df Sig.
(2-
tailed
)
Mean
Differenc
e
Std. Error
Differenc
e
95%
Confidence
Interval of
the
Difference
Lowe
r
Uppe
r
dsm5Diag6
m
Equal
variance
s
assumed
25.62
5
.00
0
-
4.18
8
1494 .000 -.109 .026 -.161 -.058
Equal
variance
s not
assumed
-
4.16
9
1238.99
1 .000 -.109 .026 -.161 -.058
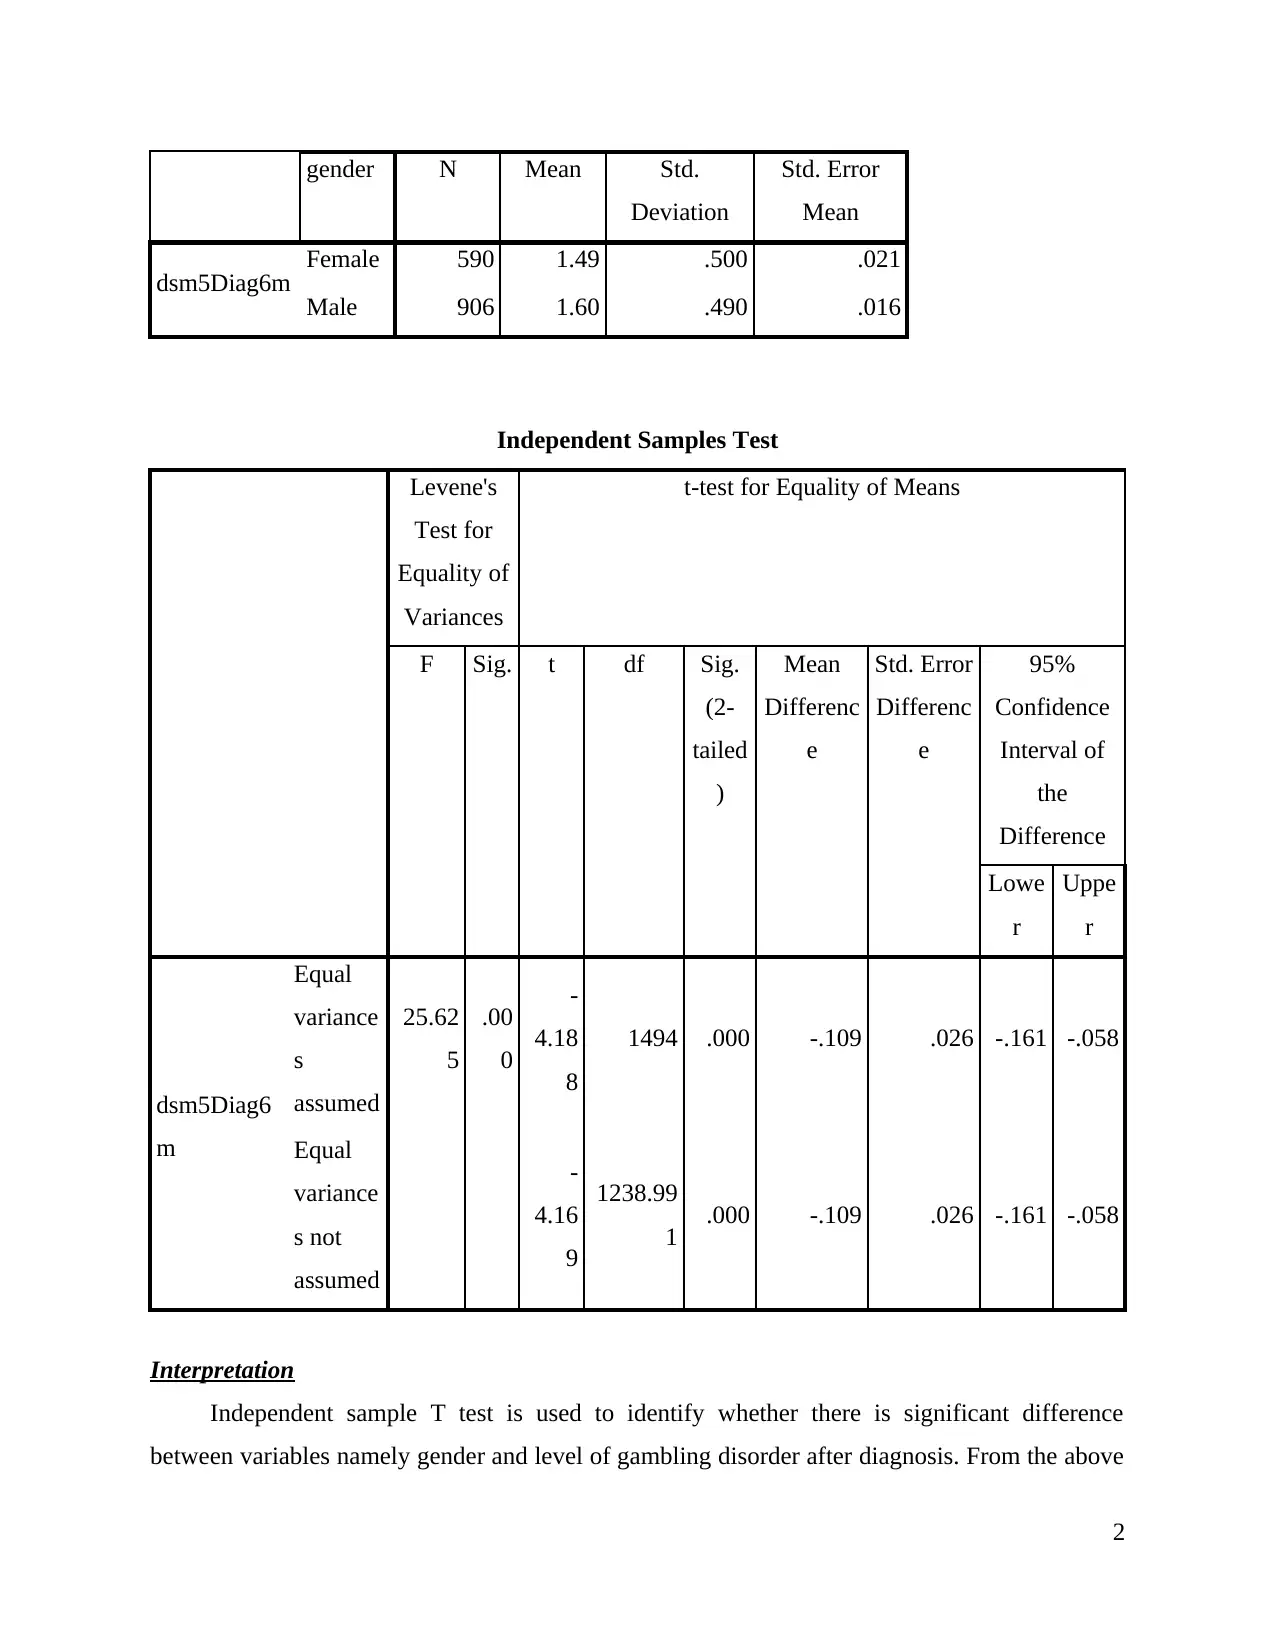
Interpretation
Independent sample T test is used to identify whether there is significant difference
between variables namely gender and level of gambling disorder after diagnosis. From the above
2
Deviation
Std. Error
Mean
dsm5Diag6m Female 590 1.49 .500 .021
Male 906 1.60 .490 .016
Independent Samples Test
Levene's
Test for
Equality of
Variances
t-test for Equality of Means
F Sig. t df Sig.
(2-
tailed
)
Mean
Differenc
e
Std. Error
Differenc
e
95%
Confidence
Interval of
the
Difference
Lowe
r
Uppe
r
dsm5Diag6
m
Equal
variance
s
assumed
25.62
5
.00
0
-
4.18
8
1494 .000 -.109 .026 -.161 -.058
Equal
variance
s not
assumed
-
4.16
9
1238.99
1 .000 -.109 .026 -.161 -.058
Interpretation
Independent sample T test is used to identify whether there is significant difference
between variables namely gender and level of gambling disorder after diagnosis. From the above
2
Paraphrase This Document
Need a fresh take? Get an instant paraphrase of this document with our AI Paraphraser
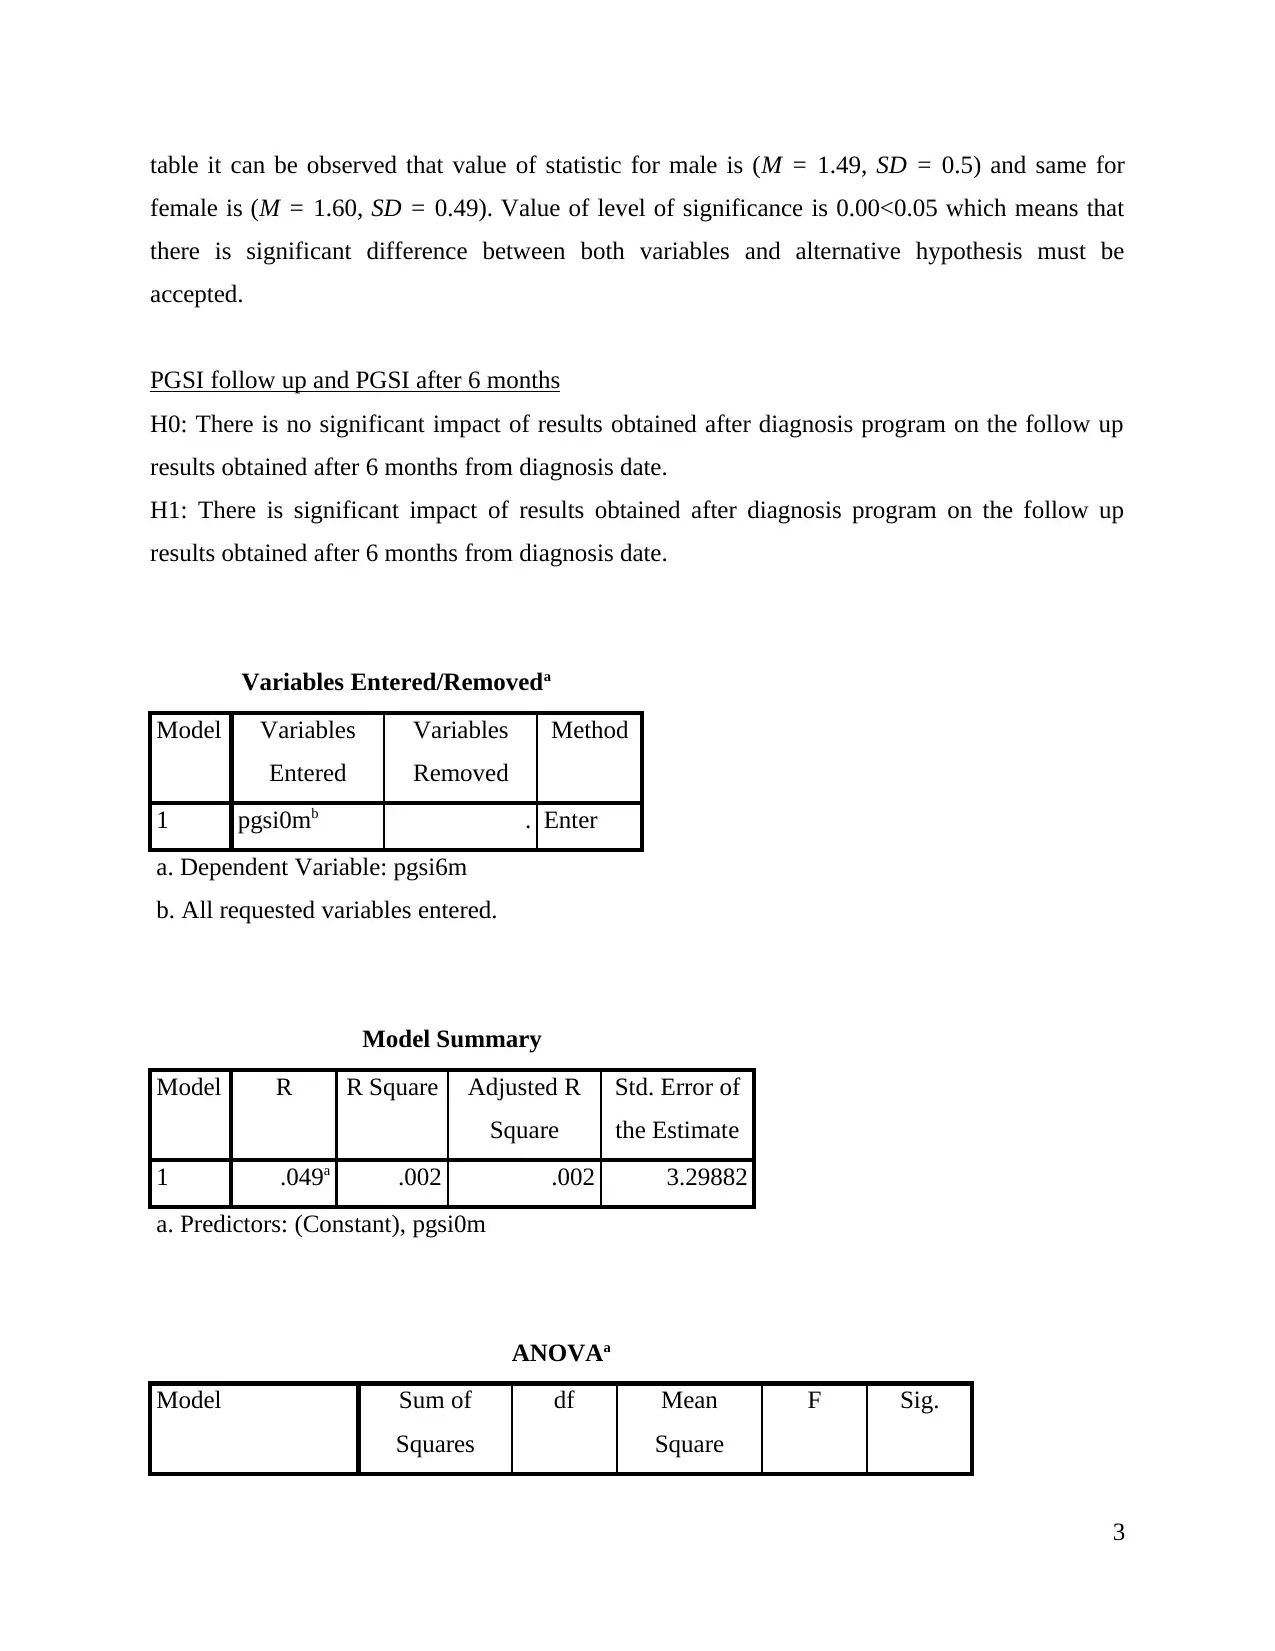
table it can be observed that value of statistic for male is (M = 1.49, SD = 0.5) and same for
female is (M = 1.60, SD = 0.49). Value of level of significance is 0.00<0.05 which means that
there is significant difference between both variables and alternative hypothesis must be
accepted.
PGSI follow up and PGSI after 6 months
H0: There is no significant impact of results obtained after diagnosis program on the follow up
results obtained after 6 months from diagnosis date.
H1: There is significant impact of results obtained after diagnosis program on the follow up
results obtained after 6 months from diagnosis date.
Variables Entered/Removeda
Model Variables
Entered
Variables
Removed
Method
1 pgsi0mb . Enter
a. Dependent Variable: pgsi6m
b. All requested variables entered.
Model Summary
Model R R Square Adjusted R
Square
Std. Error of
the Estimate
1 .049a .002 .002 3.29882
a. Predictors: (Constant), pgsi0m
ANOVAa
Model Sum of
Squares
df Mean
Square
F Sig.
3
1
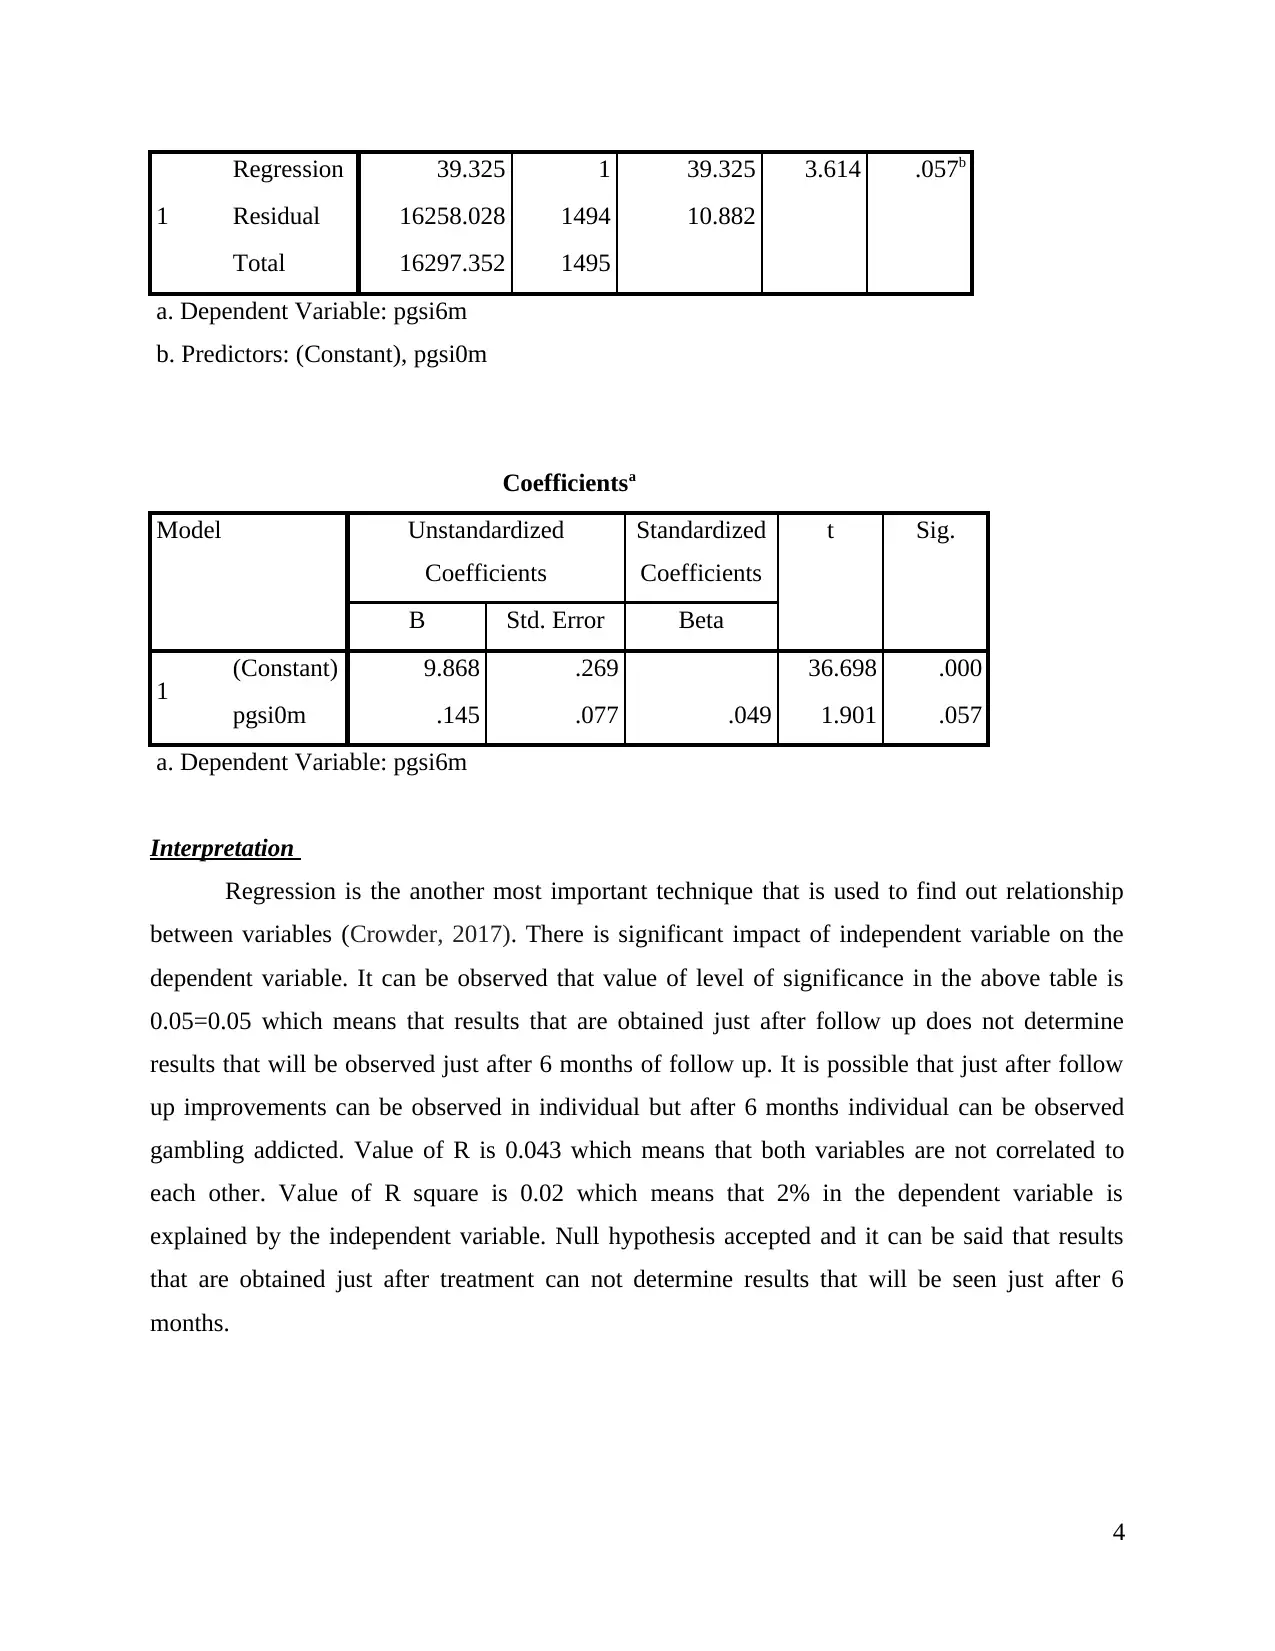
Regression 39.325 1 39.325 3.614 .057b
Residual 16258.028 1494 10.882
Total 16297.352 1495
a. Dependent Variable: pgsi6m
b. Predictors: (Constant), pgsi0m
Coefficientsa
Model Unstandardized
Coefficients
Standardized
Coefficients
t Sig.
B Std. Error Beta
1 (Constant) 9.868 .269 36.698 .000
pgsi0m .145 .077 .049 1.901 .057
a. Dependent Variable: pgsi6m
Interpretation
Regression is the another most important technique that is used to find out relationship
between variables (Crowder, 2017). There is significant impact of independent variable on the
dependent variable. It can be observed that value of level of significance in the above table is
0.05=0.05 which means that results that are obtained just after follow up does not determine
results that will be observed just after 6 months of follow up. It is possible that just after follow
up improvements can be observed in individual but after 6 months individual can be observed
gambling addicted. Value of R is 0.043 which means that both variables are not correlated to
each other. Value of R square is 0.02 which means that 2% in the dependent variable is
explained by the independent variable. Null hypothesis accepted and it can be said that results
that are obtained just after treatment can not determine results that will be seen just after 6
months.
4
⊘ This is a preview!⊘
Do you want full access?
Subscribe today to unlock all pages.
Trusted by 1+ million students worldwide
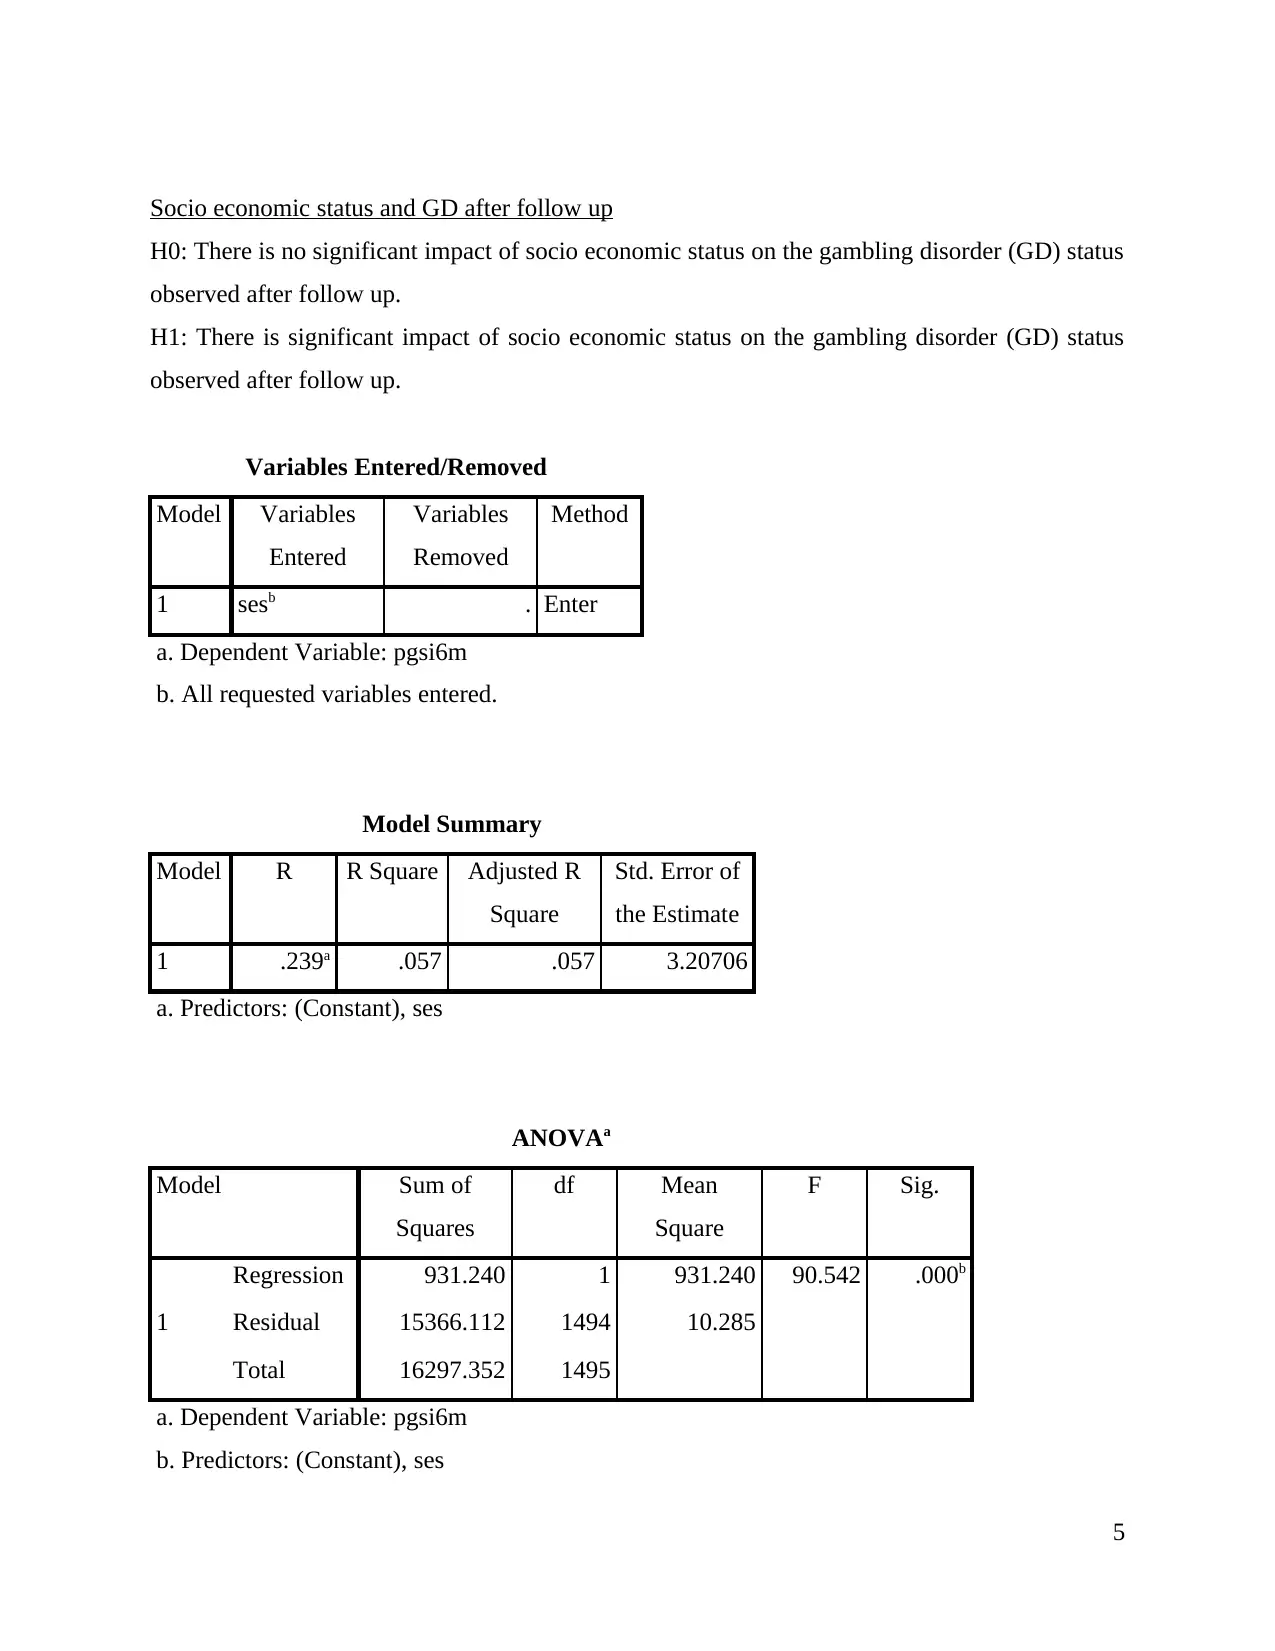
Socio economic status and GD after follow up
H0: There is no significant impact of socio economic status on the gambling disorder (GD) status
observed after follow up.
H1: There is significant impact of socio economic status on the gambling disorder (GD) status
observed after follow up.
Variables Entered/Removed
Model Variables
Entered
Variables
Removed
Method
1 sesb . Enter
a. Dependent Variable: pgsi6m
b. All requested variables entered.
Model Summary
Model R R Square Adjusted R
Square
Std. Error of
the Estimate
1 .239a .057 .057 3.20706
a. Predictors: (Constant), ses
ANOVAa
Model Sum of
Squares
df Mean
Square
F Sig.
1
Regression 931.240 1 931.240 90.542 .000b
Residual 15366.112 1494 10.285
Total 16297.352 1495
a. Dependent Variable: pgsi6m
b. Predictors: (Constant), ses
5
Paraphrase This Document
Need a fresh take? Get an instant paraphrase of this document with our AI Paraphraser
Coefficientsa
Model Unstandardized
Coefficients
Standardized
Coefficients
t Sig.
B Std. Error Beta
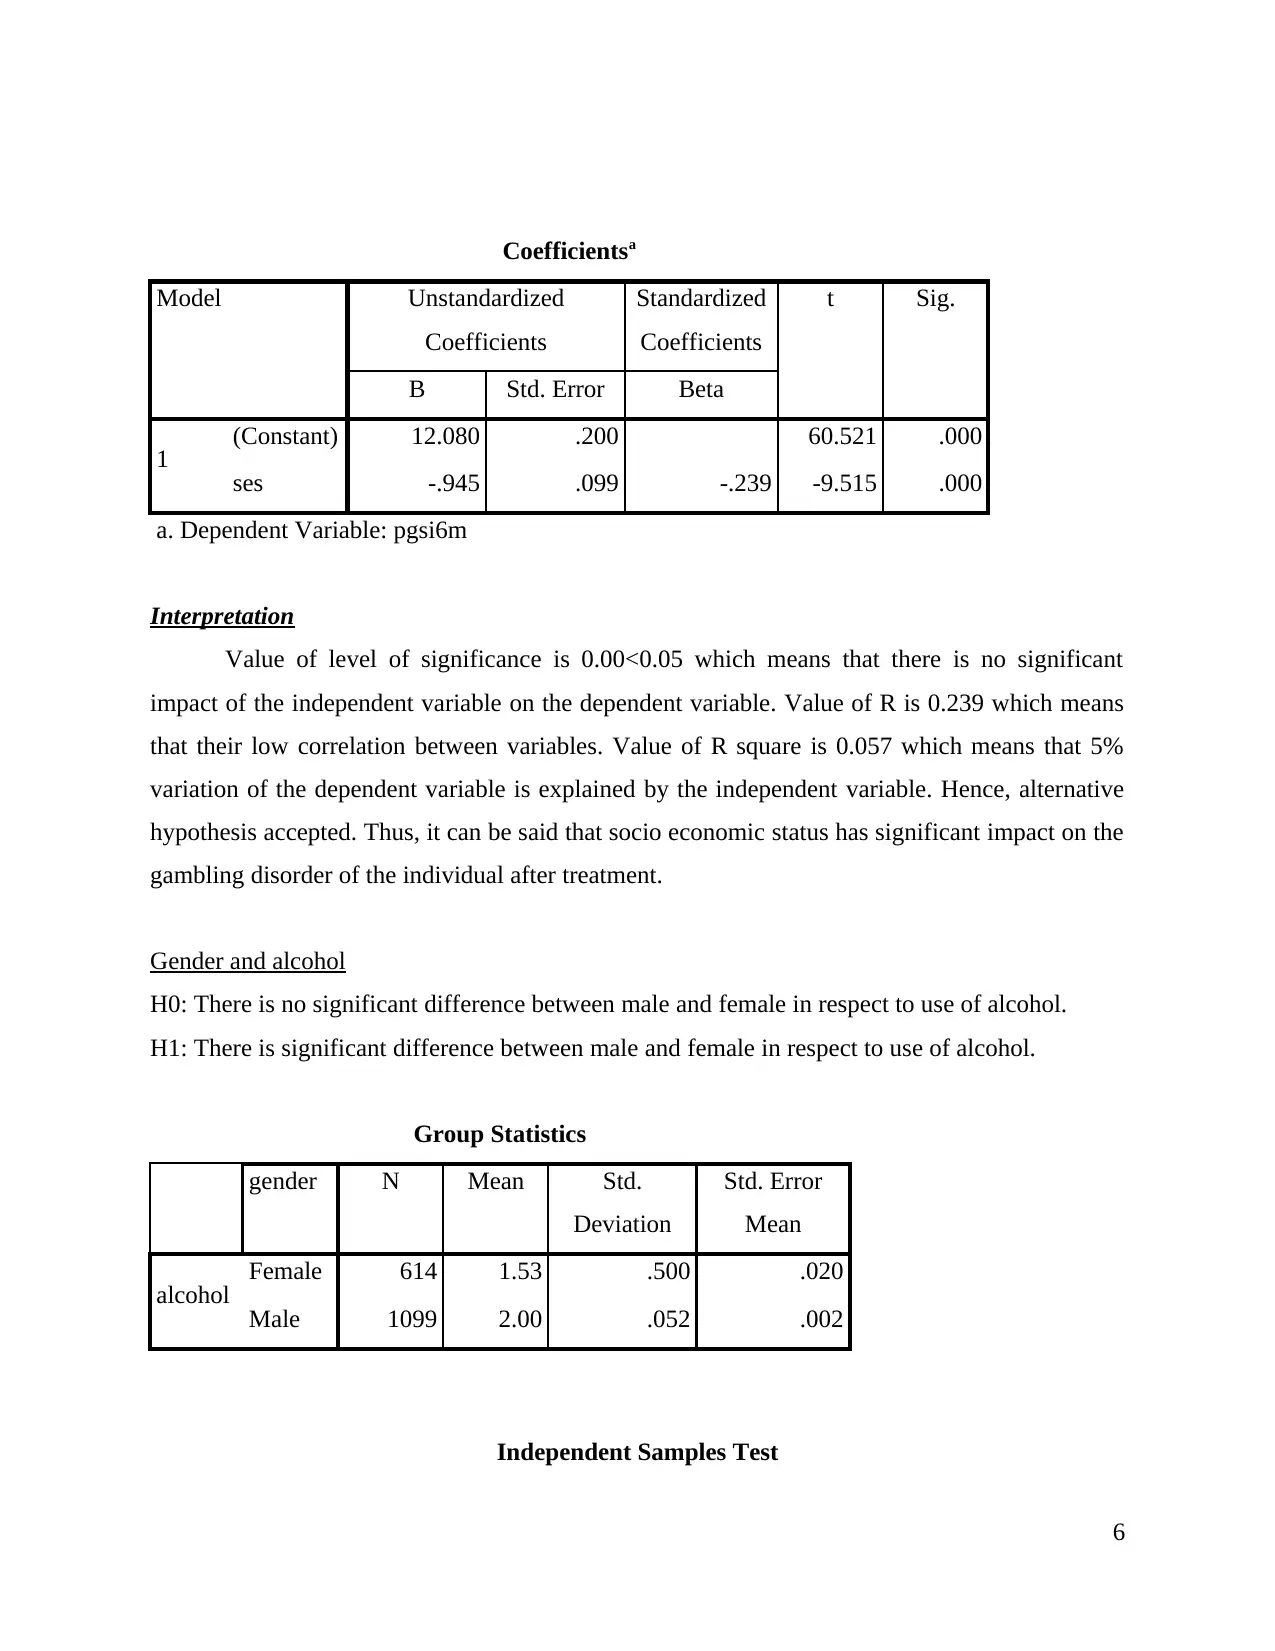
1 (Constant) 12.080 .200 60.521 .000
ses -.945 .099 -.239 -9.515 .000
a. Dependent Variable: pgsi6m
Interpretation
Value of level of significance is 0.00<0.05 which means that there is no significant
impact of the independent variable on the dependent variable. Value of R is 0.239 which means
that their low correlation between variables. Value of R square is 0.057 which means that 5%
variation of the dependent variable is explained by the independent variable. Hence, alternative
hypothesis accepted. Thus, it can be said that socio economic status has significant impact on the
gambling disorder of the individual after treatment.
Gender and alcohol
H0: There is no significant difference between male and female in respect to use of alcohol.
H1: There is significant difference between male and female in respect to use of alcohol.
Group Statistics
gender N Mean Std.
Deviation
Std. Error
Mean
alcohol Female 614 1.53 .500 .020
Male 1099 2.00 .052 .002
Independent Samples Test
6
Model Unstandardized
Coefficients
Standardized
Coefficients
t Sig.
B Std. Error Beta
1 (Constant) 12.080 .200 60.521 .000
ses -.945 .099 -.239 -9.515 .000
a. Dependent Variable: pgsi6m
Interpretation
Value of level of significance is 0.00<0.05 which means that there is no significant
impact of the independent variable on the dependent variable. Value of R is 0.239 which means
that their low correlation between variables. Value of R square is 0.057 which means that 5%
variation of the dependent variable is explained by the independent variable. Hence, alternative
hypothesis accepted. Thus, it can be said that socio economic status has significant impact on the
gambling disorder of the individual after treatment.
Gender and alcohol
H0: There is no significant difference between male and female in respect to use of alcohol.
H1: There is significant difference between male and female in respect to use of alcohol.
Group Statistics
gender N Mean Std.
Deviation
Std. Error
Mean
alcohol Female 614 1.53 .500 .020
Male 1099 2.00 .052 .002
Independent Samples Test
6
Levene's Test
for Equality of
Variances
t-test for Equality of Means
F Sig. t df Sig.
(2-
tailed
)
Mean
Differenc
e
Std. Error
Differenc
e
95%
Confidence
Interval of
the
Difference
Lowe
r
Uppe
r
alcoho
l
Equal
variance
s
assumed
47784.93
1
.00
0
-
30.86
4
1711 .000 -.470 .015 -.499 -.440
Equal
variance
s not
assumed
-
23.21
8
620.48
6 .000 -.470 .020 -.509 -.430
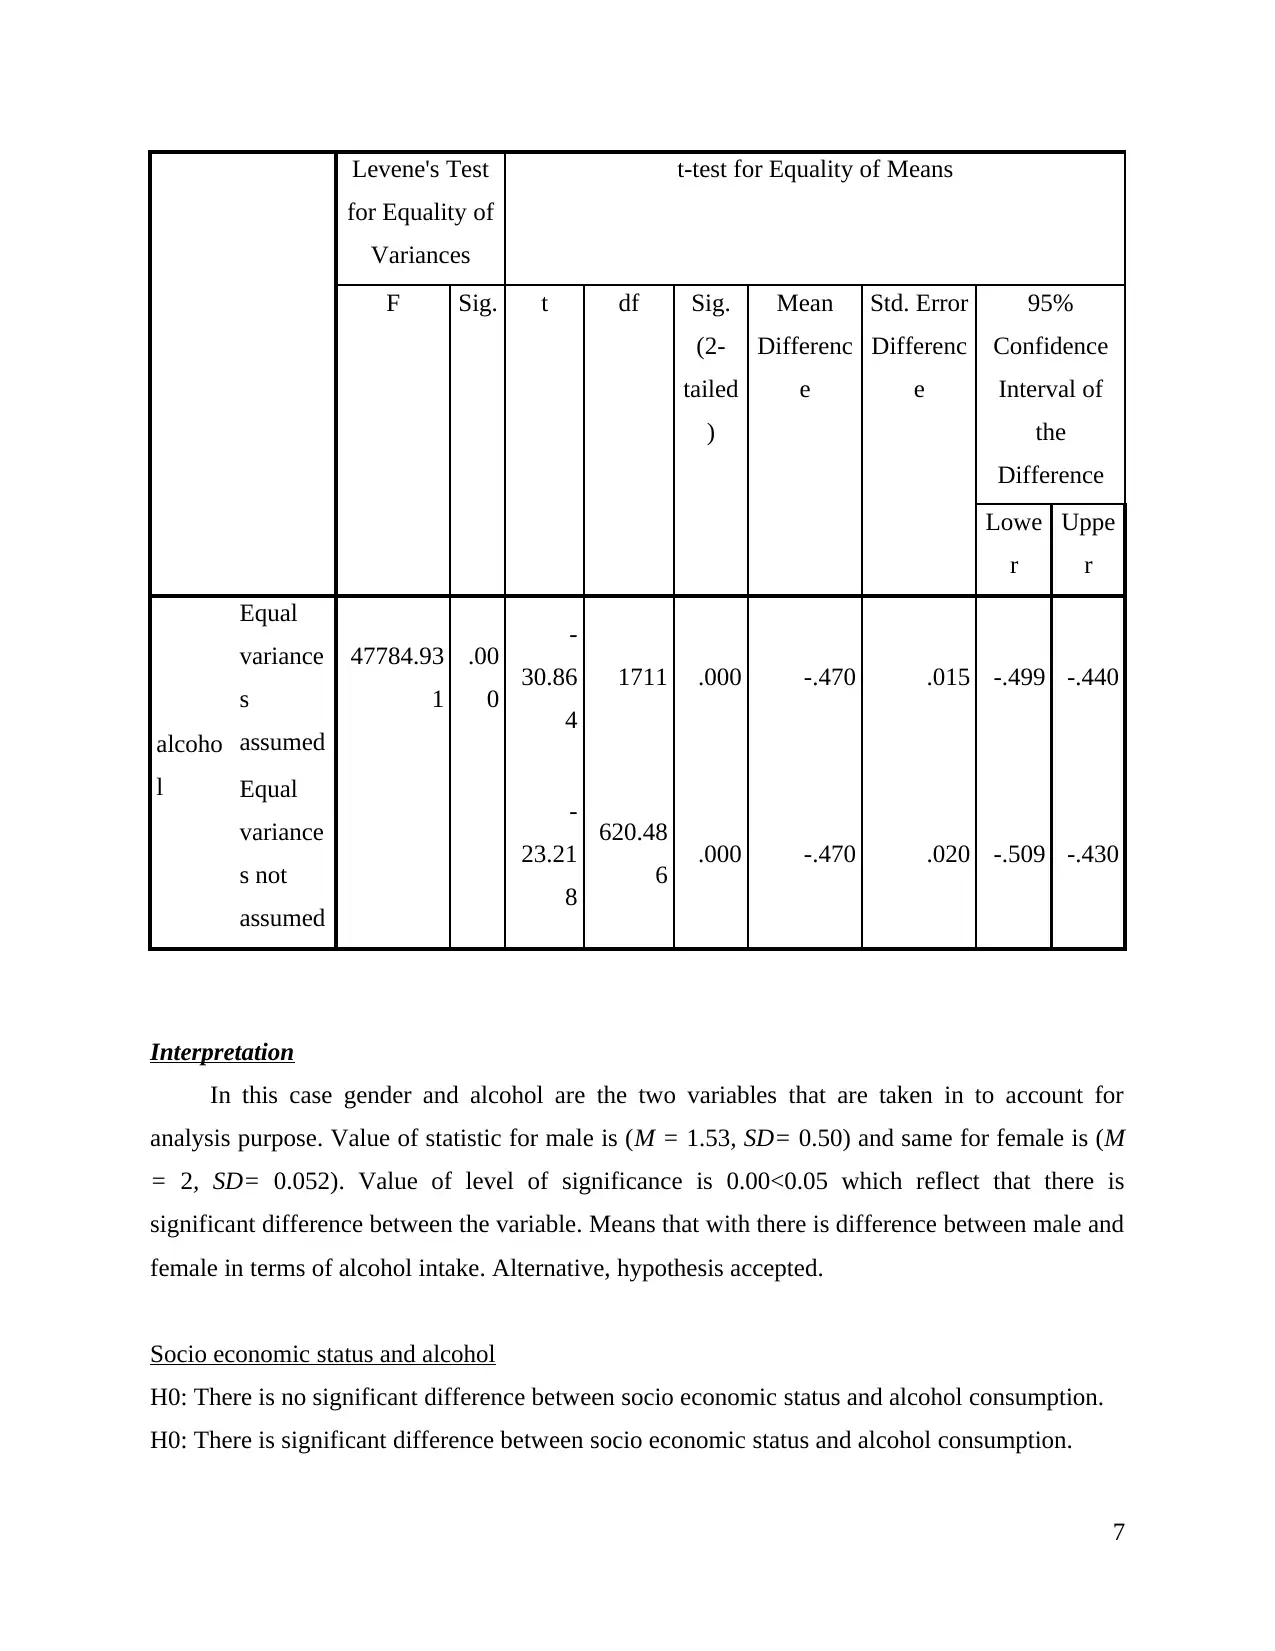
Interpretation
In this case gender and alcohol are the two variables that are taken in to account for
analysis purpose. Value of statistic for male is (M = 1.53, SD= 0.50) and same for female is (M
= 2, SD= 0.052). Value of level of significance is 0.00<0.05 which reflect that there is
significant difference between the variable. Means that with there is difference between male and
female in terms of alcohol intake. Alternative, hypothesis accepted.
Socio economic status and alcohol
H0: There is no significant difference between socio economic status and alcohol consumption.
H0: There is significant difference between socio economic status and alcohol consumption.
7
for Equality of
Variances
t-test for Equality of Means
F Sig. t df Sig.
(2-
tailed
)
Mean
Differenc
e
Std. Error
Differenc
e
95%
Confidence
Interval of
the
Difference
Lowe
r
Uppe
r
alcoho
l
Equal
variance
s
assumed
47784.93
1
.00
0
-
30.86
4
1711 .000 -.470 .015 -.499 -.440
Equal
variance
s not
assumed
-
23.21
8
620.48
6 .000 -.470 .020 -.509 -.430
Interpretation
In this case gender and alcohol are the two variables that are taken in to account for
analysis purpose. Value of statistic for male is (M = 1.53, SD= 0.50) and same for female is (M
= 2, SD= 0.052). Value of level of significance is 0.00<0.05 which reflect that there is
significant difference between the variable. Means that with there is difference between male and
female in terms of alcohol intake. Alternative, hypothesis accepted.
Socio economic status and alcohol
H0: There is no significant difference between socio economic status and alcohol consumption.
H0: There is significant difference between socio economic status and alcohol consumption.
7
⊘ This is a preview!⊘
Do you want full access?
Subscribe today to unlock all pages.
Trusted by 1+ million students worldwide
Variables Entered/Removeda
Model Variables
Entered
Variables
Removed
Method
1 sesb . Enter
a. Dependent Variable: alcohol
b. All requested variables entered.
Model Summary
Model R R Square Adjusted R
Square
Std. Error of
the Estimate
1 .000a .000 -.001 .377
a. Predictors: (Constant), ses
ANOVAa
Model Sum of
Squares
df Mean
Square
F Sig.
1
Regression .000 1 .000 .000 .998b
Residual 242.884 1711 .142
Total 242.884 1712
a. Dependent Variable: alcohol
b. Predictors: (Constant), ses
Coefficients
Model Unstandardized
Coefficients
Standardized
Coefficients
t Sig.
B Std. Error Beta
8
Paraphrase This Document
Need a fresh take? Get an instant paraphrase of this document with our AI Paraphraser
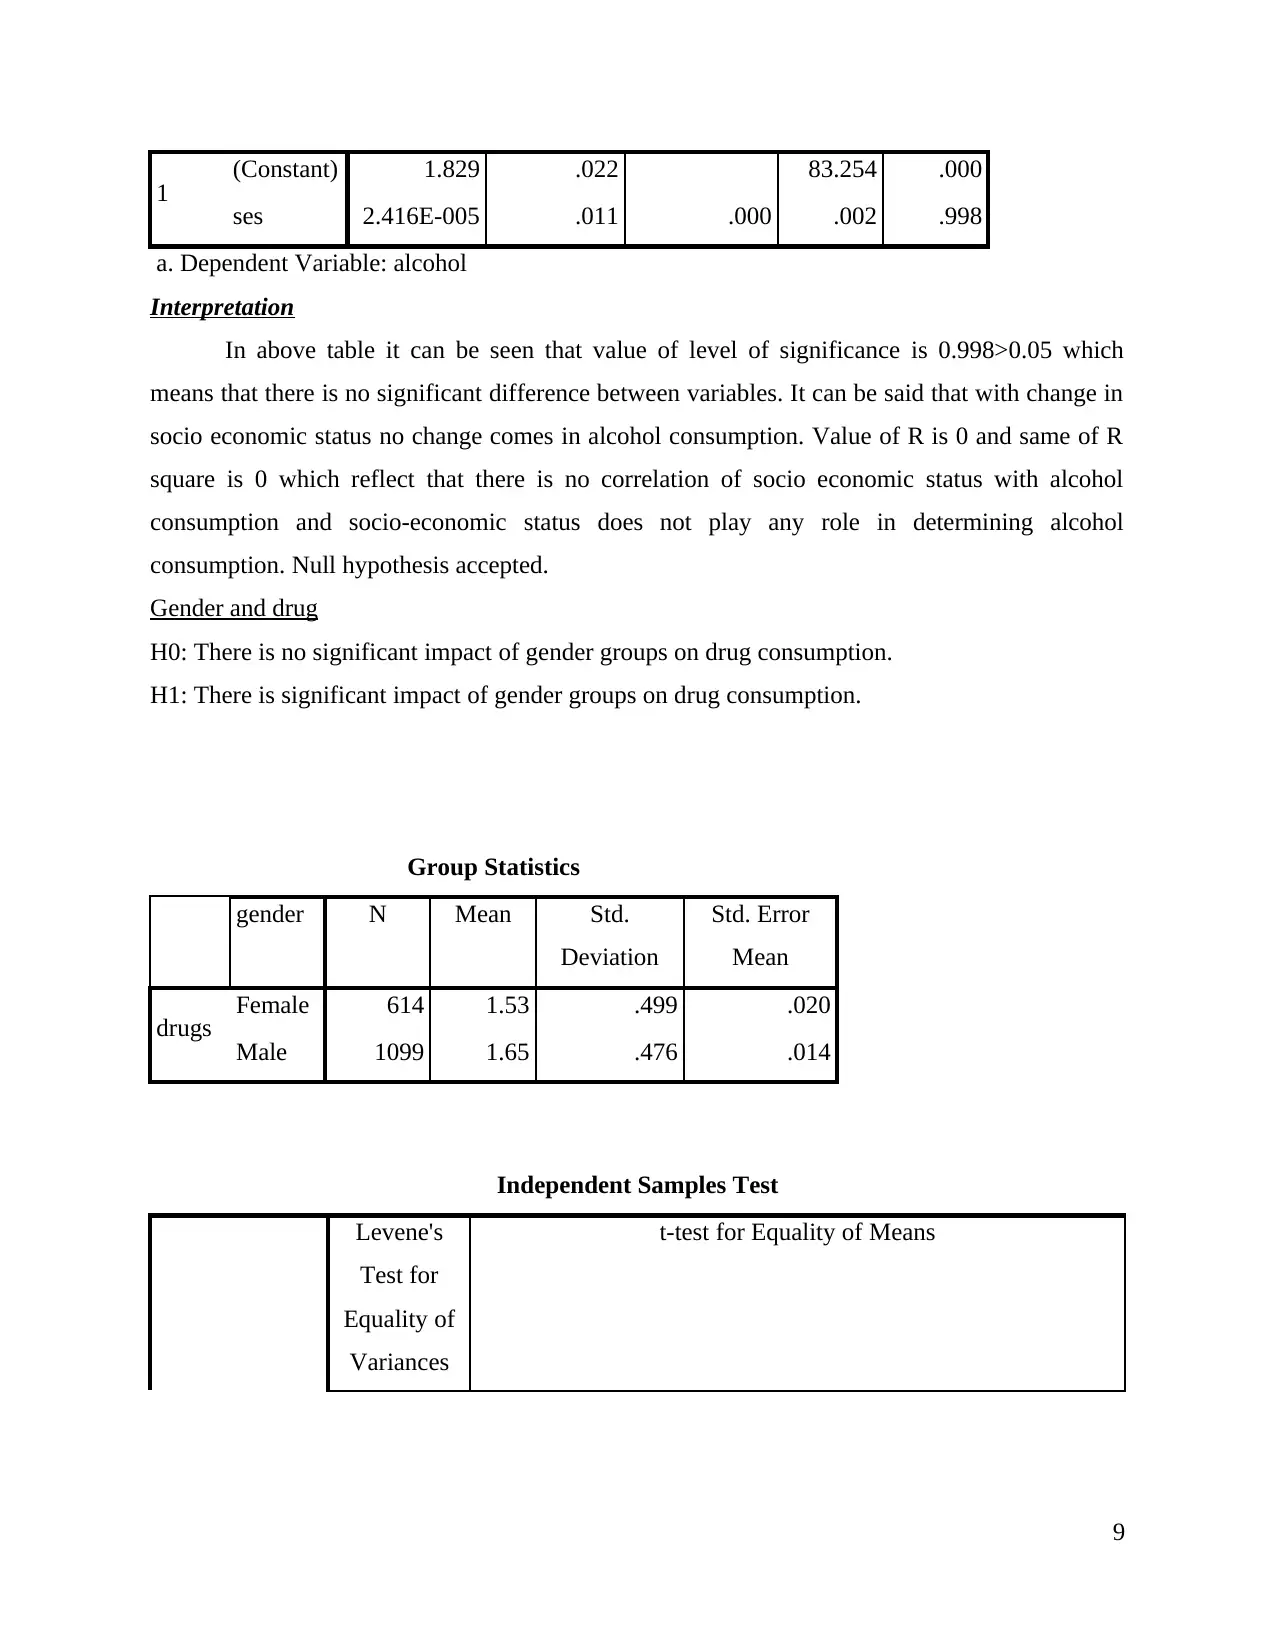
1 (Constant) 1.829 .022 83.254 .000
ses 2.416E-005 .011 .000 .002 .998
a. Dependent Variable: alcohol
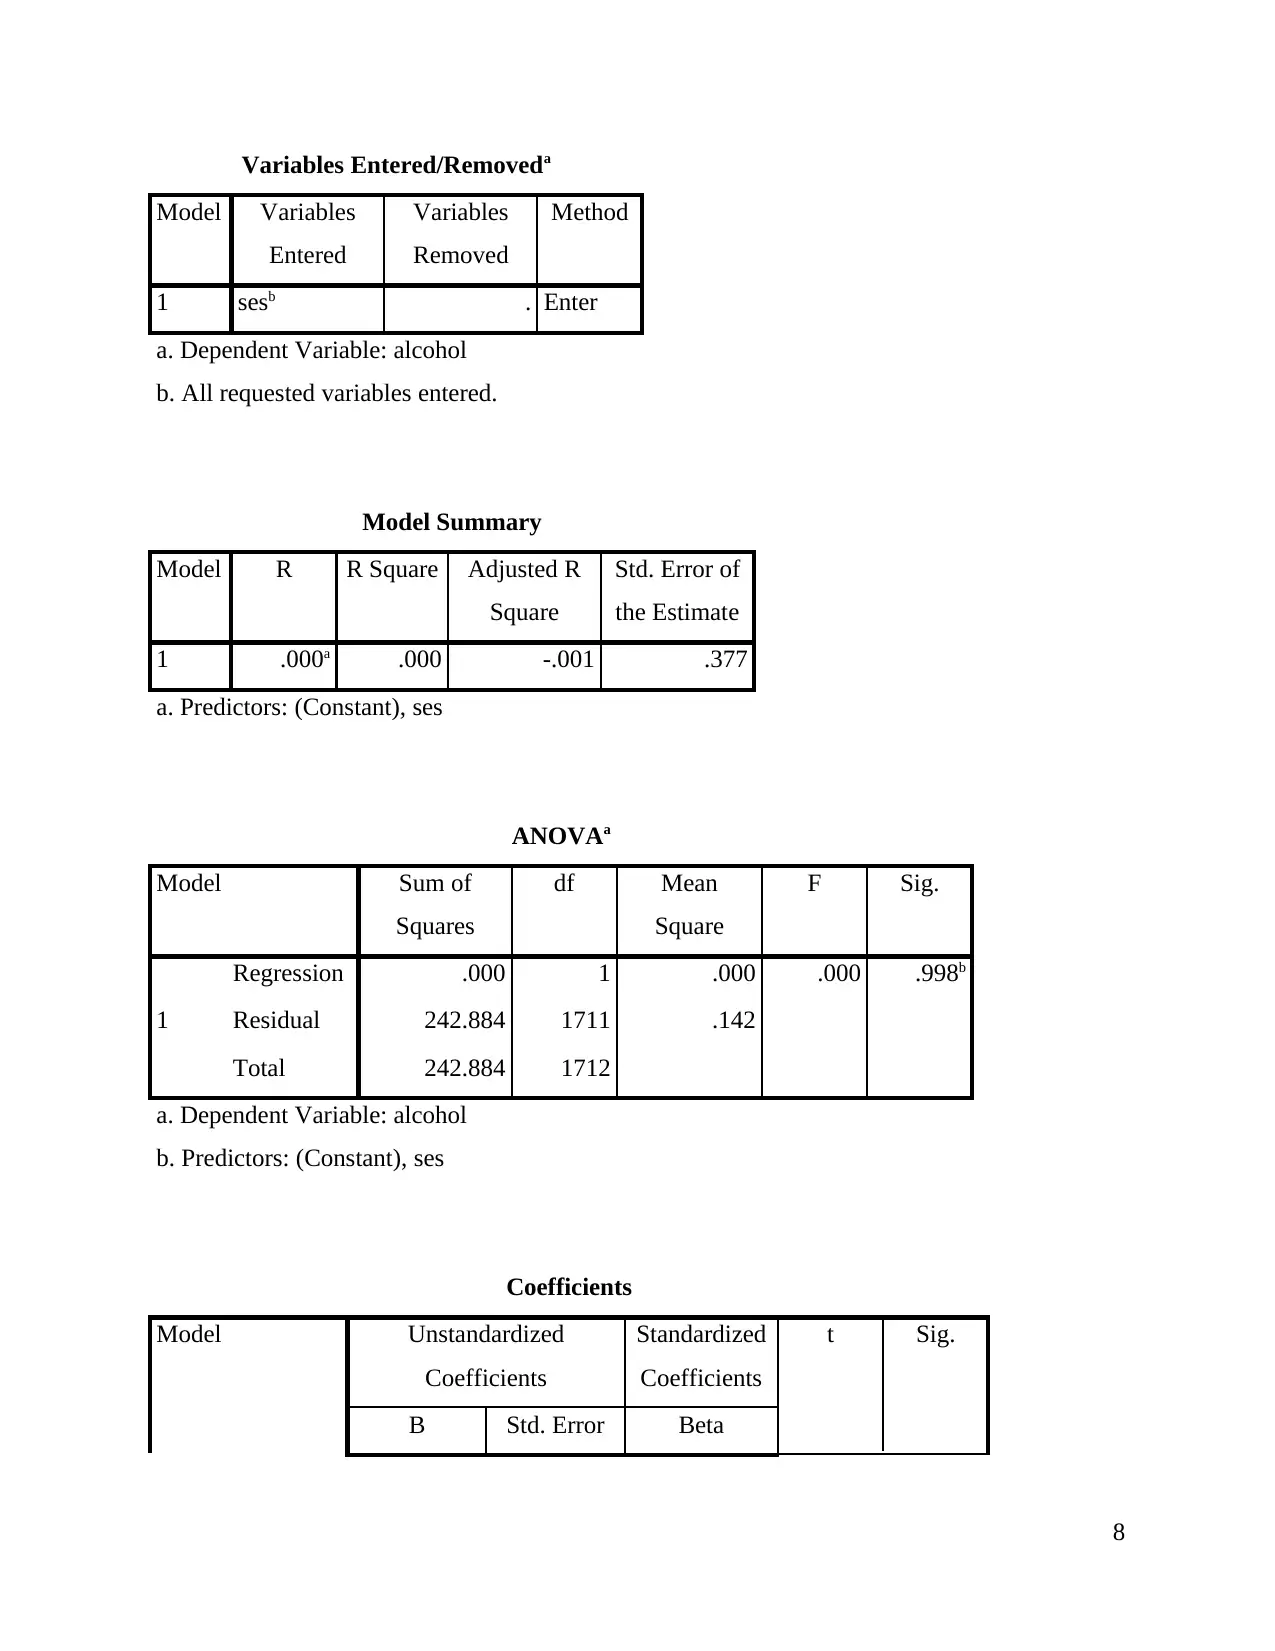
Interpretation
In above table it can be seen that value of level of significance is 0.998>0.05 which
means that there is no significant difference between variables. It can be said that with change in
socio economic status no change comes in alcohol consumption. Value of R is 0 and same of R
square is 0 which reflect that there is no correlation of socio economic status with alcohol
consumption and socio-economic status does not play any role in determining alcohol
consumption. Null hypothesis accepted.
Gender and drug
H0: There is no significant impact of gender groups on drug consumption.
H1: There is significant impact of gender groups on drug consumption.
Group Statistics
gender N Mean Std.
Deviation
Std. Error
Mean
drugs Female 614 1.53 .499 .020
Male 1099 1.65 .476 .014
Independent Samples Test
Levene's
Test for
Equality of
Variances
t-test for Equality of Means
9
ses 2.416E-005 .011 .000 .002 .998
a. Dependent Variable: alcohol
Interpretation
In above table it can be seen that value of level of significance is 0.998>0.05 which
means that there is no significant difference between variables. It can be said that with change in
socio economic status no change comes in alcohol consumption. Value of R is 0 and same of R
square is 0 which reflect that there is no correlation of socio economic status with alcohol
consumption and socio-economic status does not play any role in determining alcohol
consumption. Null hypothesis accepted.
Gender and drug
H0: There is no significant impact of gender groups on drug consumption.
H1: There is significant impact of gender groups on drug consumption.
Group Statistics
gender N Mean Std.
Deviation
Std. Error
Mean
drugs Female 614 1.53 .499 .020
Male 1099 1.65 .476 .014
Independent Samples Test
Levene's
Test for
Equality of
Variances
t-test for Equality of Means
9
F Sig. t df Sig.
(2-
tailed)
Mean
Difference
Std. Error
Difference
95%
Confidence
Interval of the
Difference
Lower Upper
drugs
Equal
variances
assumed
56.324 .000 -
4.973 1711 .000 -.121 .024 -.169 -.074
Equal
variances
not
assumed
-
4.907 1218.819 .000 -.121 .025 -.170 -.073
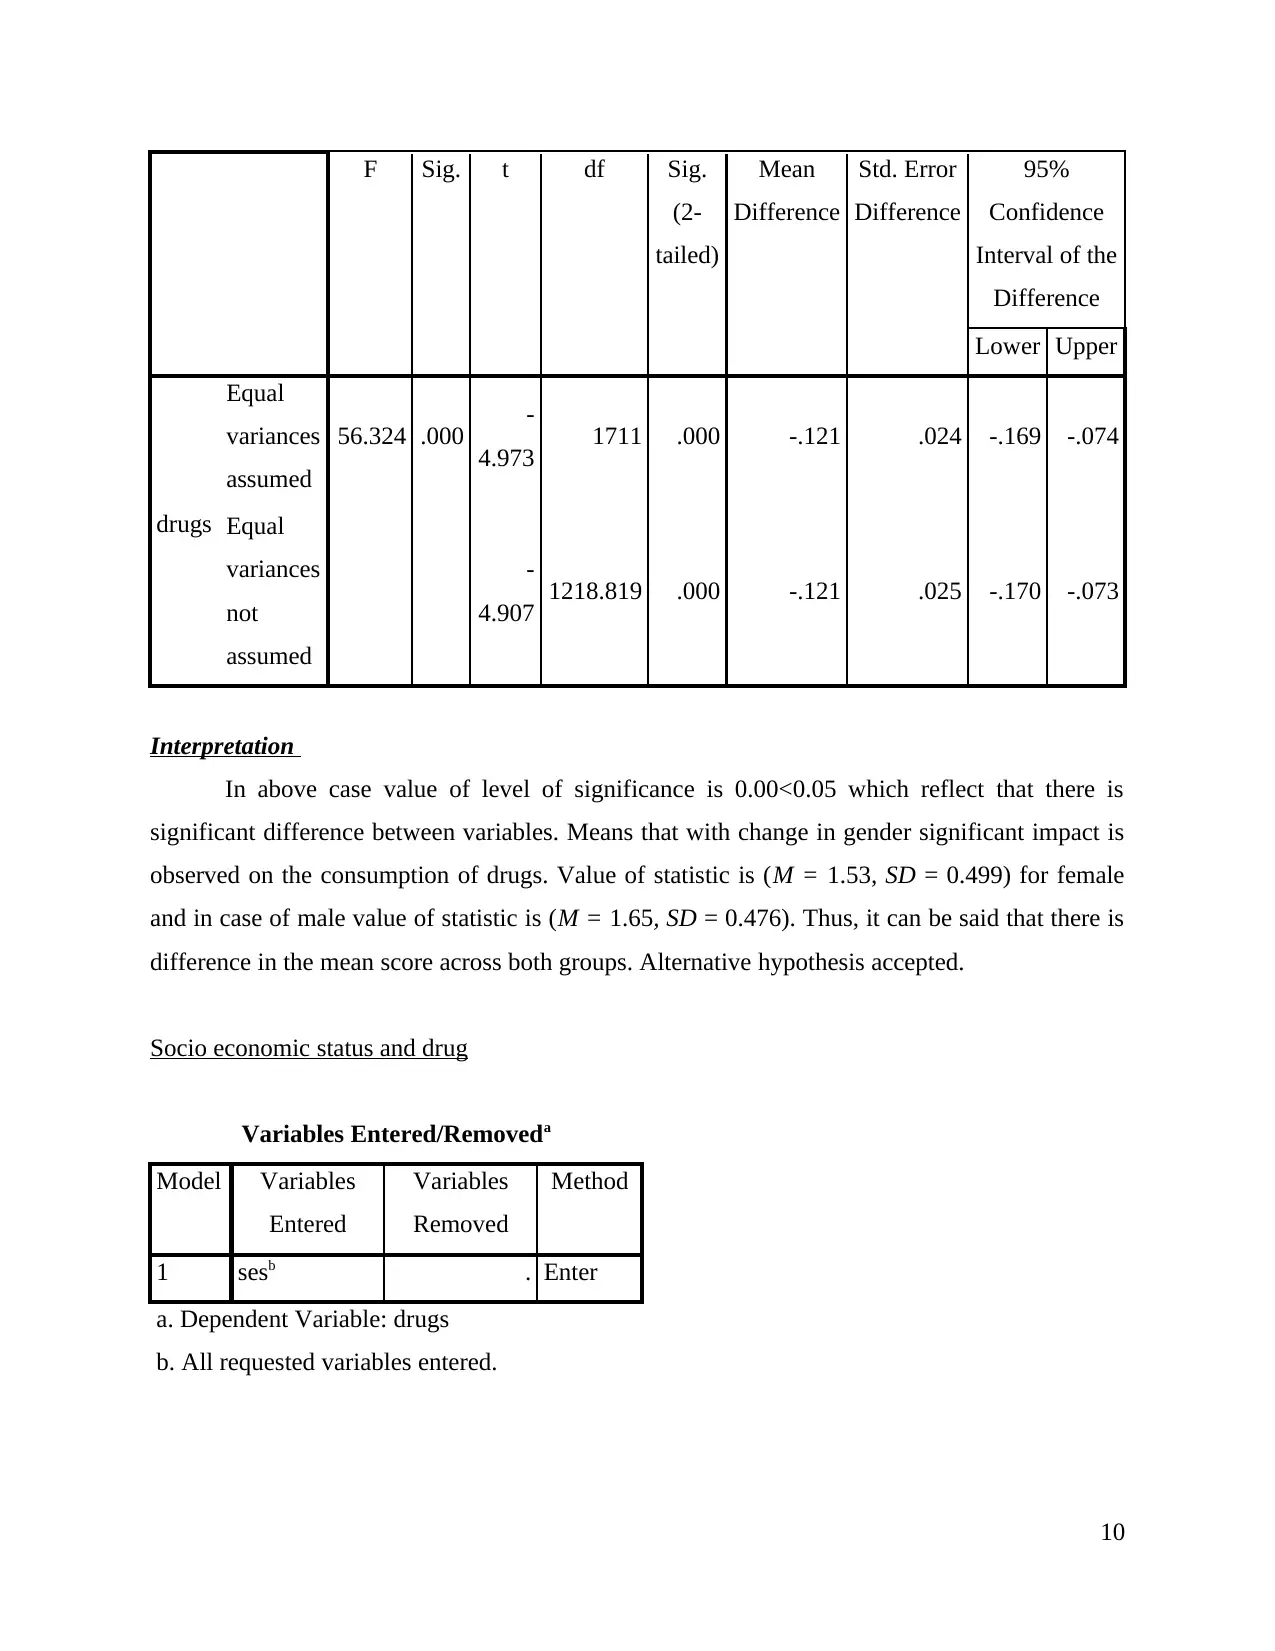
Interpretation
In above case value of level of significance is 0.00<0.05 which reflect that there is
significant difference between variables. Means that with change in gender significant impact is
observed on the consumption of drugs. Value of statistic is (M = 1.53, SD = 0.499) for female
and in case of male value of statistic is (M = 1.65, SD = 0.476). Thus, it can be said that there is
difference in the mean score across both groups. Alternative hypothesis accepted.
Socio economic status and drug
Variables Entered/Removeda
Model Variables
Entered
Variables
Removed
Method
1 sesb . Enter
a. Dependent Variable: drugs
b. All requested variables entered.
10
(2-
tailed)
Mean
Difference
Std. Error
Difference
95%
Confidence
Interval of the
Difference
Lower Upper
drugs
Equal
variances
assumed
56.324 .000 -
4.973 1711 .000 -.121 .024 -.169 -.074
Equal
variances
not
assumed
-
4.907 1218.819 .000 -.121 .025 -.170 -.073
Interpretation
In above case value of level of significance is 0.00<0.05 which reflect that there is
significant difference between variables. Means that with change in gender significant impact is
observed on the consumption of drugs. Value of statistic is (M = 1.53, SD = 0.499) for female
and in case of male value of statistic is (M = 1.65, SD = 0.476). Thus, it can be said that there is
difference in the mean score across both groups. Alternative hypothesis accepted.
Socio economic status and drug
Variables Entered/Removeda
Model Variables
Entered
Variables
Removed
Method
1 sesb . Enter
a. Dependent Variable: drugs
b. All requested variables entered.
10
⊘ This is a preview!⊘
Do you want full access?
Subscribe today to unlock all pages.
Trusted by 1+ million students worldwide
1 out of 15
Related Documents


Your All-in-One AI-Powered Toolkit for Academic Success.
+13062052269
info@desklib.com
Available 24*7 on WhatsApp / Email
![[object Object]](/_next/static/media/star-bottom.7253800d.svg)
Unlock your academic potential
Copyright © 2020–2026 A2Z Services. All Rights Reserved. Developed and managed by ZUCOL.