University Assignment: GlaxoSmithKline Financial Ratio Analysis

Verified

Added on  2021/04/24

|10
|1612
|33
Report
AI Summary
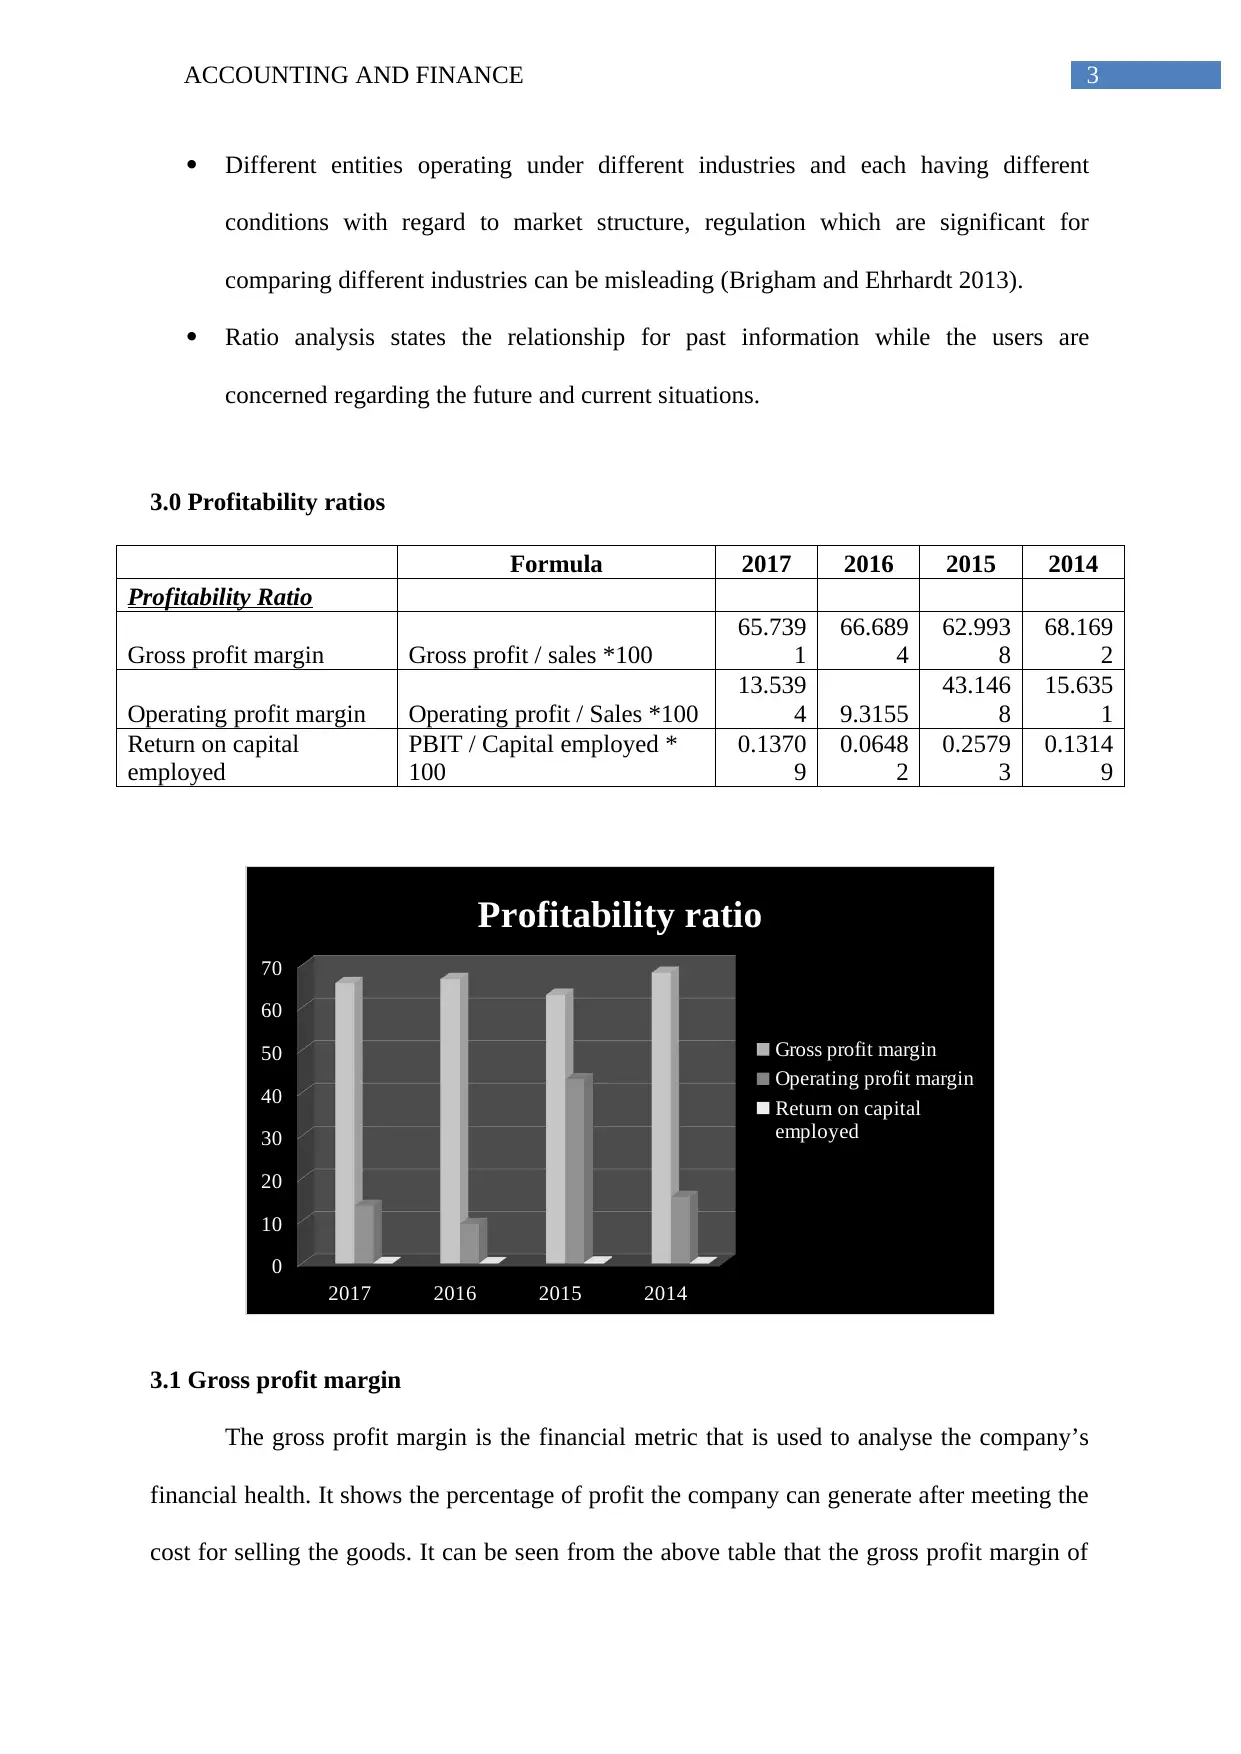
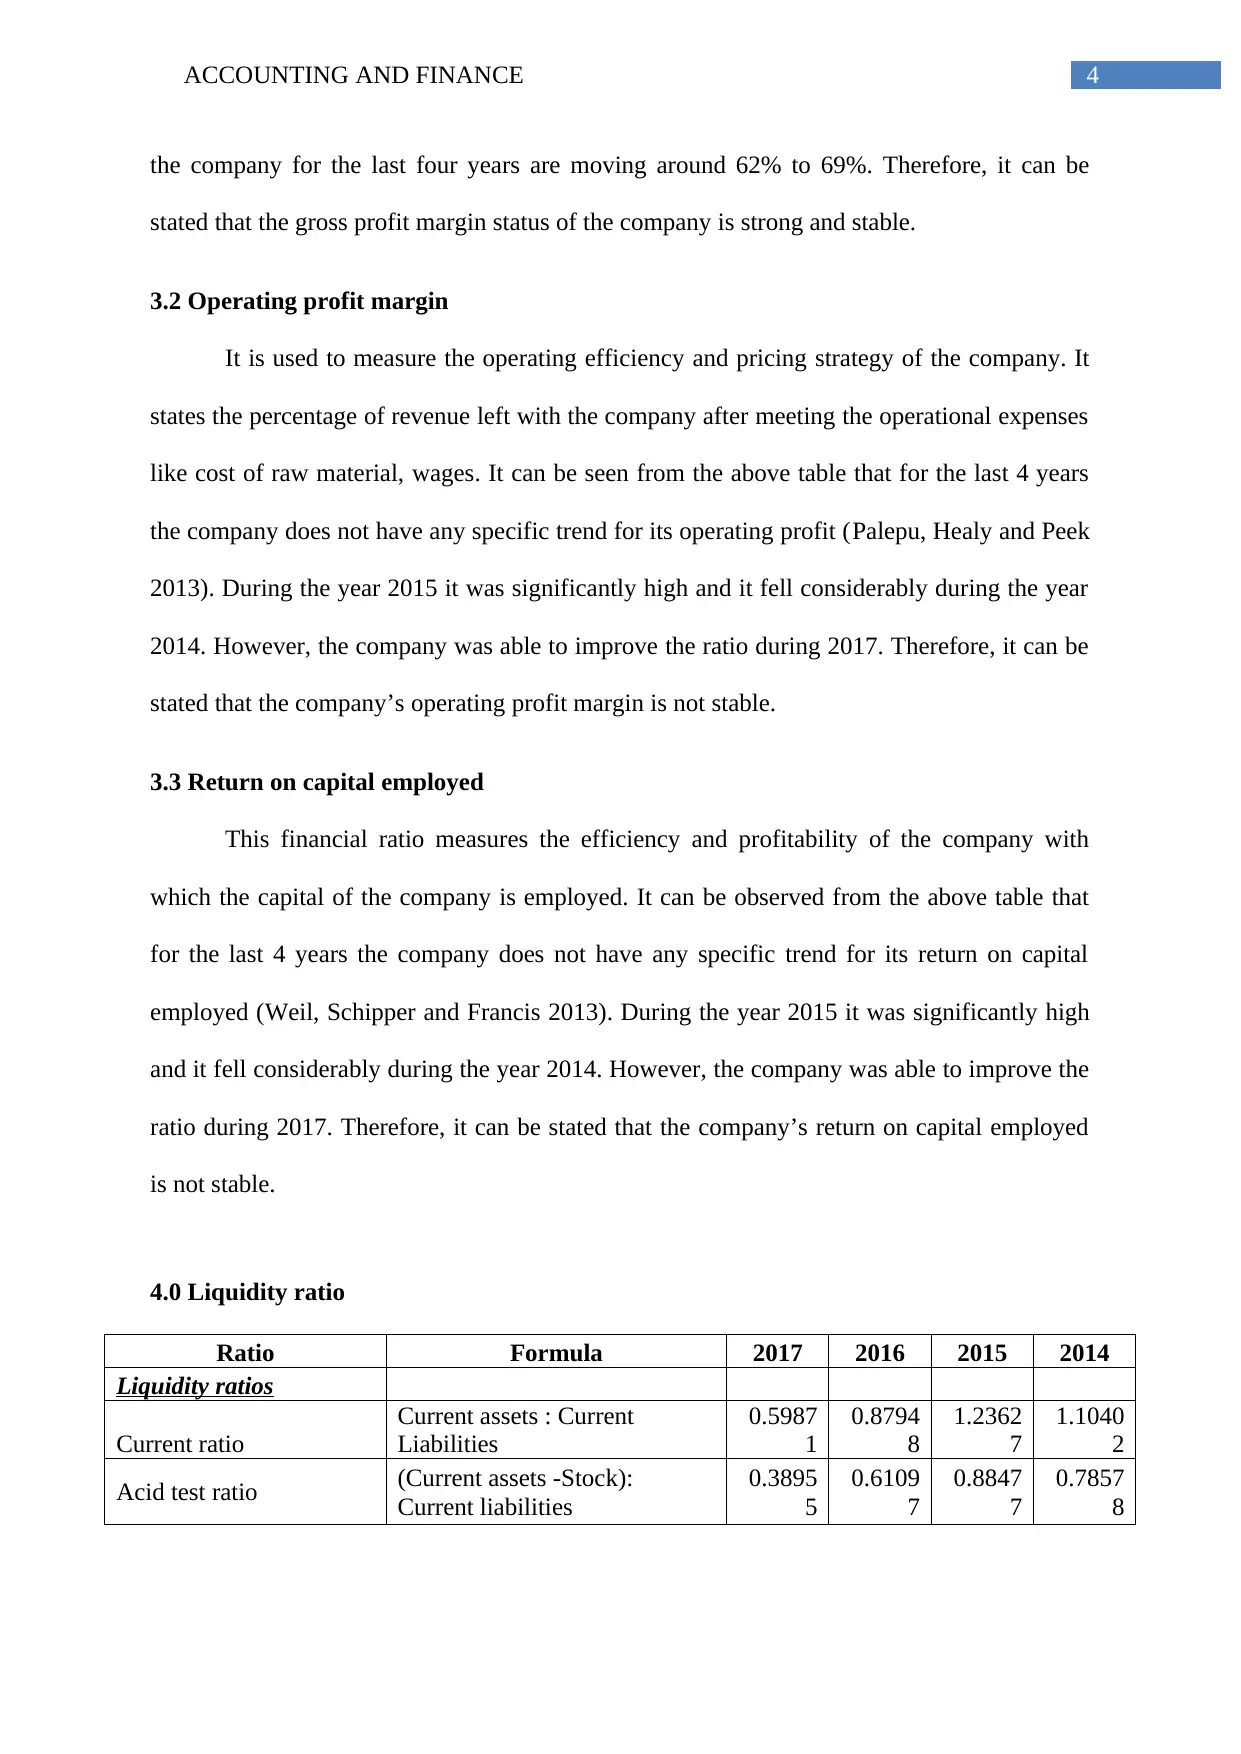
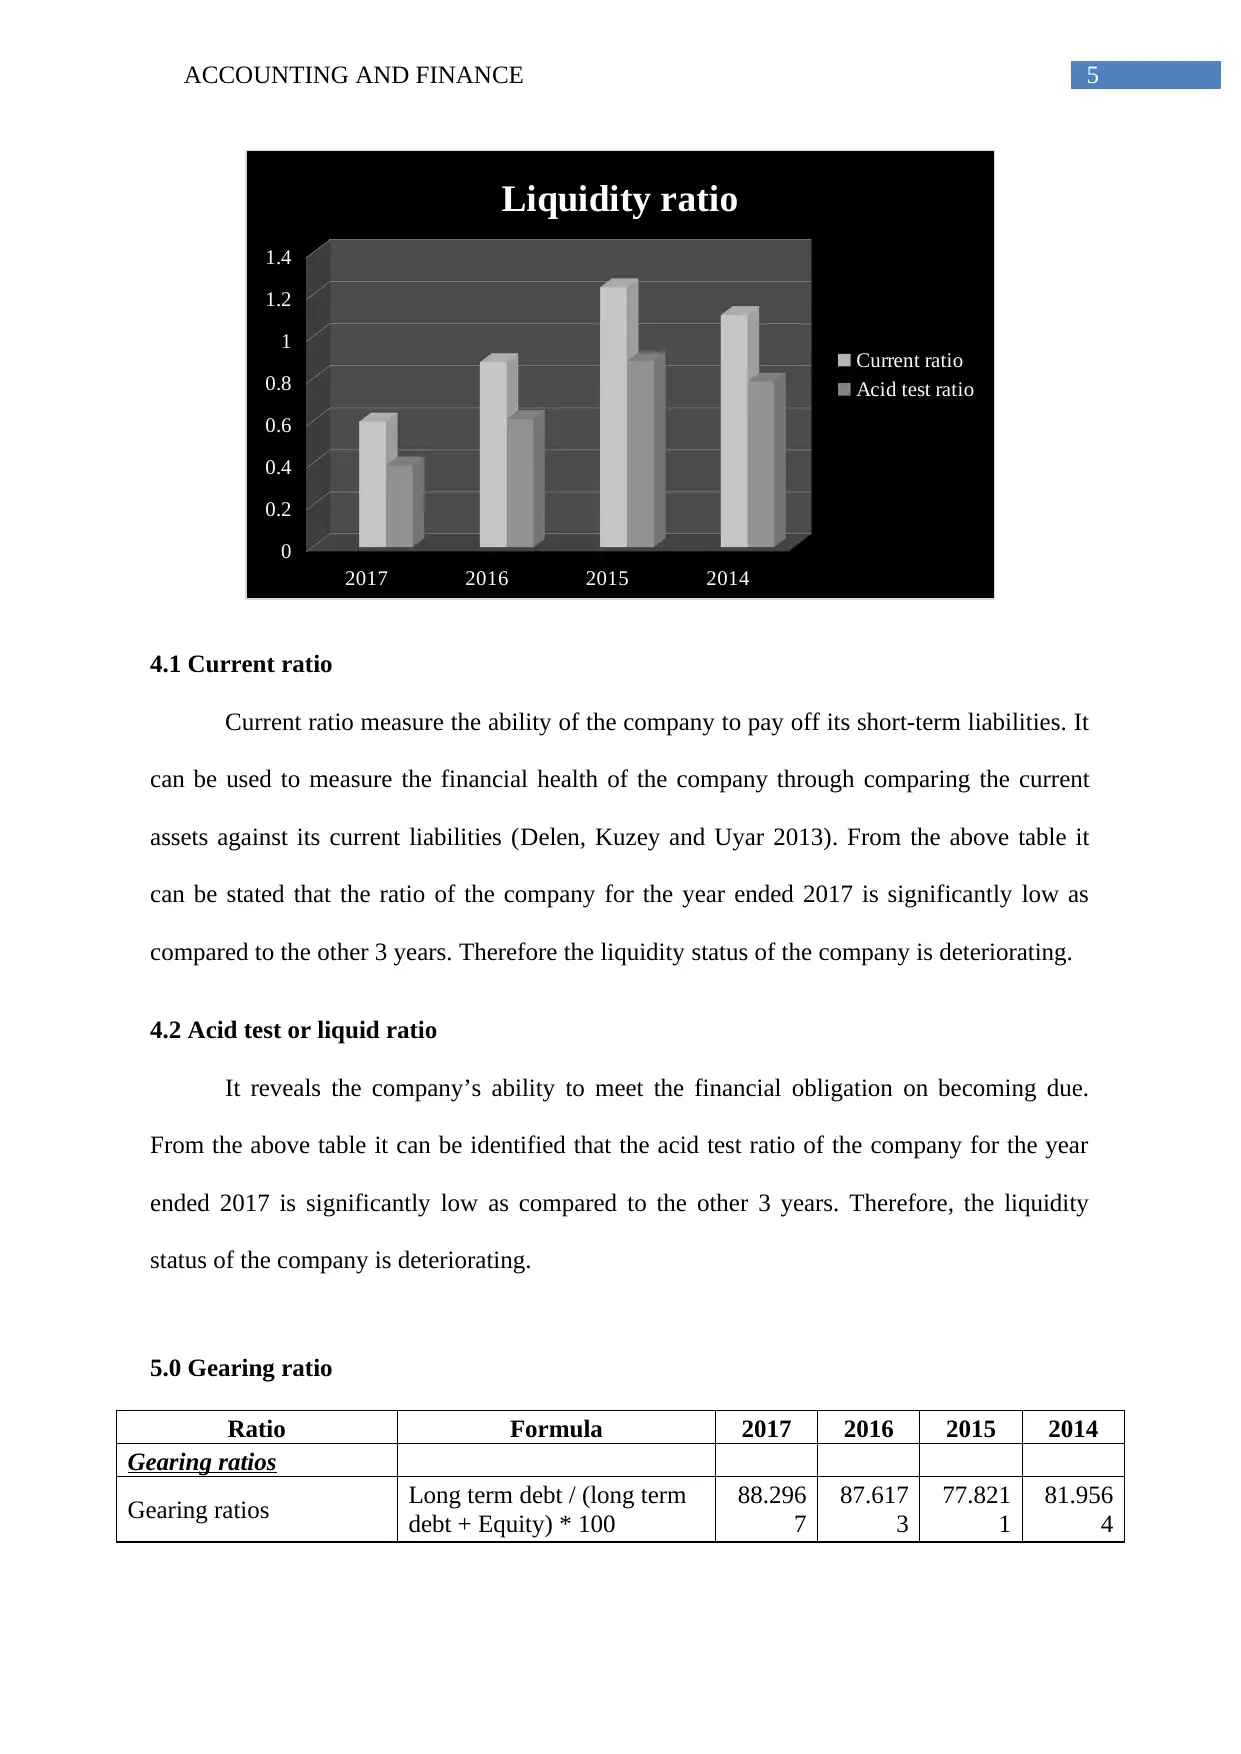
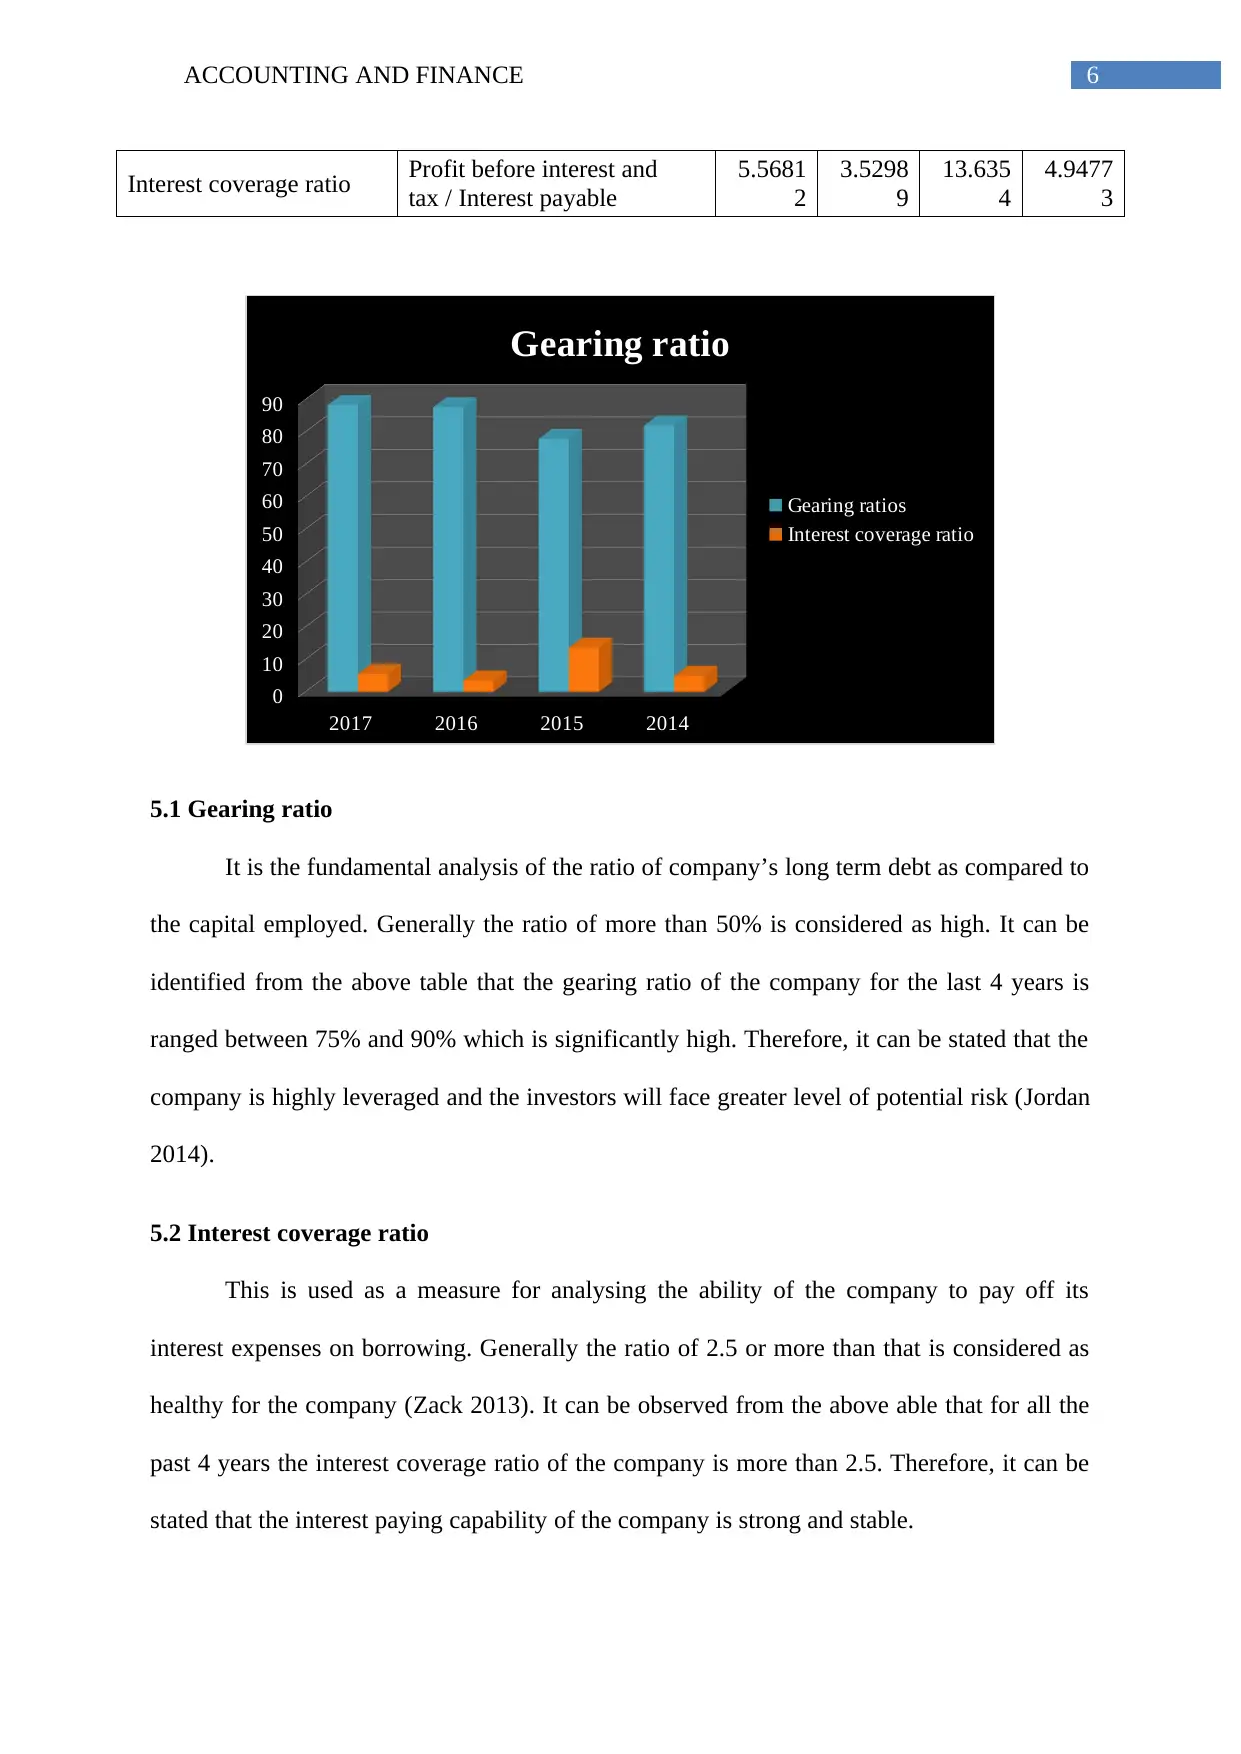
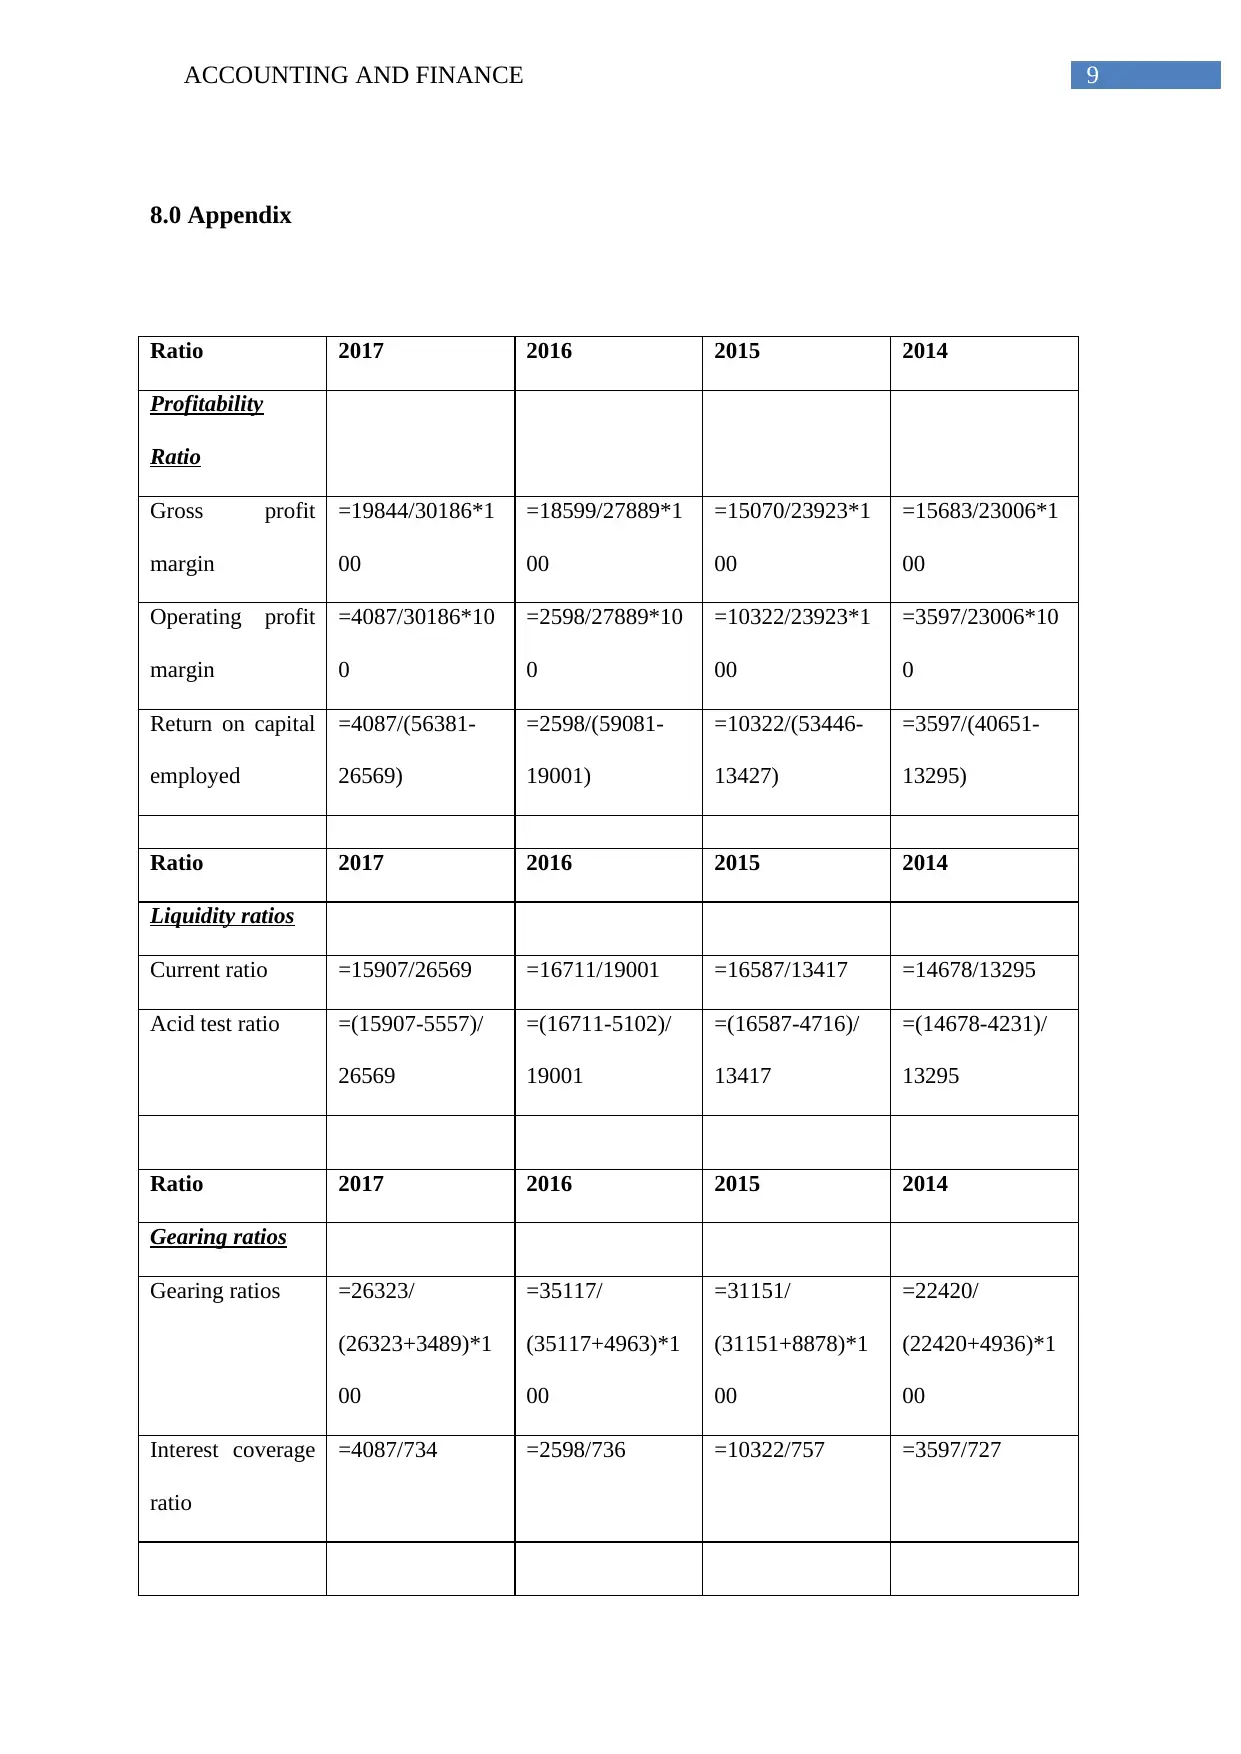
This report provides a comprehensive financial ratio analysis of GlaxoSmithKline (GSK), a major pharmaceutical company, from 2014 to 2017. The analysis covers various aspects of GSK's financial health, including profitability, liquidity, and gearing ratios. Profitability ratios such as gross profit margin, operating profit margin, and return on capital employed are examined to assess the company's efficiency in generating profits. Liquidity ratios, including the current ratio and acid-test ratio, are used to evaluate GSK's ability to meet short-term obligations. Gearing ratios, such as the gearing ratio and interest coverage ratio, are analyzed to assess the company's leverage and its ability to manage debt. The report concludes with a summary of GSK's financial strengths and weaknesses based on the ratio analysis, highlighting areas where the company excels and areas needing improvement. The report also includes detailed calculations and formulas for each ratio, providing a clear understanding of the analysis process.
Document Page
Running head: ACCOUNTING AND FINANCE
Accounting and finance
Name of the student
Name of the university
Student ID
Author note
tabler-icon-diamond-filled.svg

Paraphrase This Document

Need a fresh take? Get an instant paraphrase of this document with our AI Paraphraser
Document Page
1ACCOUNTING AND FINANCE
Table of Contents
1.0 Introduction..........................................................................................................................2
2.0 Ratio analysis.......................................................................................................................2
2.1 Advantages of ratio analysis............................................................................................2
2.2 Limitations of ratio analysis.............................................................................................2
3.0 Profitability ratios.................................................................................................................3
3.1 Gross profit margin..........................................................................................................3
3.2 Operating profit margin....................................................................................................4
3.3 Return on capital employed.............................................................................................4
4.0 Liquidity ratio.......................................................................................................................4
4.1 Current ratio.....................................................................................................................5
4.2 Acid test or liquid ratio....................................................................................................5
5.0 Gearing ratio.........................................................................................................................5
5.1 Gearing ratio.....................................................................................................................6
5.2 Interest coverage ratio......................................................................................................6
6.0 Conclusion............................................................................................................................7
7.0 References............................................................................................................................8
8.0 Appendix..............................................................................................................................9
Document Page
2ACCOUNTING AND FINANCE
1.0 Introduction
Established in the year 2000 through the merger of SmithKline Beecham and Glaxo
Wellcome GSK (GlaxoSmithKline) is the 6th largest pharmaceutical company. The company
is engaged into the discovery, creation, manufacture, marketing and development of vaccines,
consumer products related to health and over the counter medicines all over the world. The
company operates through 4 segments namely the consumer health care, vaccines,
pharmaceuticals R & D and pharmaceuticals. It also offers the pharmaceutical products
including therapeutic medicines, anti-virals, urogenital, cardiovascular, dermatology,
metabolic and anti-bacterial medicines. The mission of the company is to assist the people to
do more, live longer and feel better (Uk.gsk.com 2018).
2.0 Ratio analysis
2.1 Advantages of ratio analysis
Analysis of financial ratios is the useful tool for the users if the financial statement.
The advantages of ratio analysis are –
The financial statement is simplified through ratios
It assists the comparison between the companies having different sizes
It assists in analysis of trends that includes comparison of the company’s
performance over a specific period of time (Babalola and Abiola 2013).
2.2 Limitations of ratio analysis
Irrespective of the usefulness financial ratio analyses have some limitations. Some
major limitations are –
Document Page
3ACCOUNTING AND FINANCE
Different entities operating under different industries and each having different
conditions with regard to market structure, regulation which are significant for
comparing different industries can be misleading (Brigham and Ehrhardt 2013).
Ratio analysis states the relationship for past information while the users are
concerned regarding the future and current situations.
3.0 Profitability ratios
Formula 2017 2016 2015 2014
Profitability Ratio
Gross profit margin Gross profit / sales *100
65.739
1
66.689
4
62.993
8
68.169
2
Operating profit margin Operating profit / Sales *100
13.539
4 9.3155
43.146
8
15.635
1
Return on capital
employed
PBIT / Capital employed *
100
0.1370
9
0.0648
2
0.2579
3
0.1314
9
2017 2016 2015 2014
0
10
20
30
40
50
60
70
Profitability ratio
Gross profit margin
Operating profit margin
Return on capital
employed
3.1 Gross profit margin
The gross profit margin is the financial metric that is used to analyse the company’s
financial health. It shows the percentage of profit the company can generate after meeting the
cost for selling the goods. It can be seen from the above table that the gross profit margin of
tabler-icon-diamond-filled.svg

Paraphrase This Document

Need a fresh take? Get an instant paraphrase of this document with our AI Paraphraser
Document Page
4ACCOUNTING AND FINANCE
the company for the last four years are moving around 62% to 69%. Therefore, it can be
stated that the gross profit margin status of the company is strong and stable.
3.2 Operating profit margin
It is used to measure the operating efficiency and pricing strategy of the company. It
states the percentage of revenue left with the company after meeting the operational expenses
like cost of raw material, wages. It can be seen from the above table that for the last 4 years
the company does not have any specific trend for its operating profit (Palepu, Healy and Peek
2013). During the year 2015 it was significantly high and it fell considerably during the year
2014. However, the company was able to improve the ratio during 2017. Therefore, it can be
stated that the company’s operating profit margin is not stable.
3.3 Return on capital employed
This financial ratio measures the efficiency and profitability of the company with
which the capital of the company is employed. It can be observed from the above table that
for the last 4 years the company does not have any specific trend for its return on capital
employed (Weil, Schipper and Francis 2013). During the year 2015 it was significantly high
and it fell considerably during the year 2014. However, the company was able to improve the
ratio during 2017. Therefore, it can be stated that the company’s return on capital employed
is not stable.
4.0 Liquidity ratio
Ratio Formula 2017 2016 2015 2014
Liquidity ratios
Current ratio
Current assets : Current
Liabilities
0.5987
1
0.8794
8
1.2362
7
1.1040
2
Acid test ratio (Current assets -Stock):
Current liabilities
0.3895
5
0.6109
7
0.8847
7
0.7857
8
Document Page
5ACCOUNTING AND FINANCE
2017 2016 2015 2014
0
0.2
0.4
0.6
0.8
1
1.2
1.4
Liquidity ratio
Current ratio
Acid test ratio
4.1 Current ratio
Current ratio measure the ability of the company to pay off its short-term liabilities. It
can be used to measure the financial health of the company through comparing the current
assets against its current liabilities (Delen, Kuzey and Uyar 2013). From the above table it
can be stated that the ratio of the company for the year ended 2017 is significantly low as
compared to the other 3 years. Therefore the liquidity status of the company is deteriorating.
4.2 Acid test or liquid ratio
It reveals the company’s ability to meet the financial obligation on becoming due.
From the above table it can be identified that the acid test ratio of the company for the year
ended 2017 is significantly low as compared to the other 3 years. Therefore, the liquidity
status of the company is deteriorating.
5.0 Gearing ratio
Ratio Formula 2017 2016 2015 2014
Gearing ratios
Gearing ratios Long term debt / (long term
debt + Equity) * 100
88.296
7
87.617
3
77.821
1
81.956
4
Document Page
6ACCOUNTING AND FINANCE
Interest coverage ratio Profit before interest and
tax / Interest payable
5.5681
2
3.5298
9
13.635
4
4.9477
3
2017 2016 2015 2014
0
10
20
30
40
50
60
70
80
90
Gearing ratio
Gearing ratios
Interest coverage ratio
5.1 Gearing ratio
It is the fundamental analysis of the ratio of company’s long term debt as compared to
the capital employed. Generally the ratio of more than 50% is considered as high. It can be
identified from the above table that the gearing ratio of the company for the last 4 years is
ranged between 75% and 90% which is significantly high. Therefore, it can be stated that the
company is highly leveraged and the investors will face greater level of potential risk (Jordan
2014).
5.2 Interest coverage ratio
This is used as a measure for analysing the ability of the company to pay off its
interest expenses on borrowing. Generally the ratio of 2.5 or more than that is considered as
healthy for the company (Zack 2013). It can be observed from the above able that for all the
past 4 years the interest coverage ratio of the company is more than 2.5. Therefore, it can be
stated that the interest paying capability of the company is strong and stable.
tabler-icon-diamond-filled.svg

Paraphrase This Document

Need a fresh take? Get an instant paraphrase of this document with our AI Paraphraser
Document Page
7ACCOUNTING AND FINANCE
6.0 Conclusion
From the above discussion it can be concluded that GlaxoSmithKline have some
strong areas as well as some weak areas. If the profitability is considered, it can be observed
that the company is strong and stable on the profitability aspect. However, on liquidity aspect
it can be stated that the company is required to pay off its short-term obligation to improve
the liquidity aspect. Moreover, it shall pay off the long term borrowings and the additional
fund shall be raised from equity to improve its gearing position.
Document Page
8ACCOUNTING AND FINANCE
7.0 References
Babalola, Y.A. and Abiola, F.R., 2013. Financial ratio analysis of firms: A tool for decision
making. International journal of management sciences, 1(4), pp.132-137.
Brigham, E.F. and Ehrhardt, M.C., 2013. Financial management: Theory & practice.
Cengage Learning.
Delen, D., Kuzey, C. and Uyar, A., 2013. Measuring firm performance using financial ratios:
A decision tree approach. Expert Systems with Applications, 40(10), pp.3970-3983.
Jordan, B., 2014. Fundamentals of investments. McGraw-Hill Higher Education.
Palepu, K.G., Healy, P.M. and Peek, E., 2013. Business analysis and valuation: IFRS edition.
Cengage Learning.
Uk.gsk.com. (2018). Home | GSK UK. [online] Available at: https://uk.gsk.com/ [Accessed
22 Mar. 2018].
Weil, R.L., Schipper, K. and Francis, J., 2013. Financial accounting: an introduction to
concepts, methods and uses. Cengage Learning.
Zack, G.M., 2013. Financial Statement Analysis. Financial Statement Fraud: Strategies for
Detection and Investigation, pp.209-213.
Document Page
9ACCOUNTING AND FINANCE
8.0 Appendix
Ratio 2017 2016 2015 2014
Profitability
Ratio
Gross profit
margin
=19844/30186*1
00
=18599/27889*1
00
=15070/23923*1
00
=15683/23006*1
00
Operating profit
margin
=4087/30186*10
0
=2598/27889*10
0
=10322/23923*1
00
=3597/23006*10
0
Return on capital
employed
=4087/(56381-
26569)
=2598/(59081-
19001)
=10322/(53446-
13427)
=3597/(40651-
13295)
Ratio 2017 2016 2015 2014
Liquidity ratios
Current ratio =15907/26569 =16711/19001 =16587/13417 =14678/13295
Acid test ratio =(15907-5557)/
26569
=(16711-5102)/
19001
=(16587-4716)/
13417
=(14678-4231)/
13295
Ratio 2017 2016 2015 2014
Gearing ratios
Gearing ratios =26323/
(26323+3489)*1
00
=35117/
(35117+4963)*1
00
=31151/
(31151+8878)*1
00
=22420/
(22420+4936)*1
00
Interest coverage
ratio
=4087/734 =2598/736 =10322/757 =3597/727
chevron_up_icon
1 out of 10
circle_padding
hide_on_mobile
zoom_out_icon
[object Object]