Business Decision Making Report: Ground for Education College Analysis
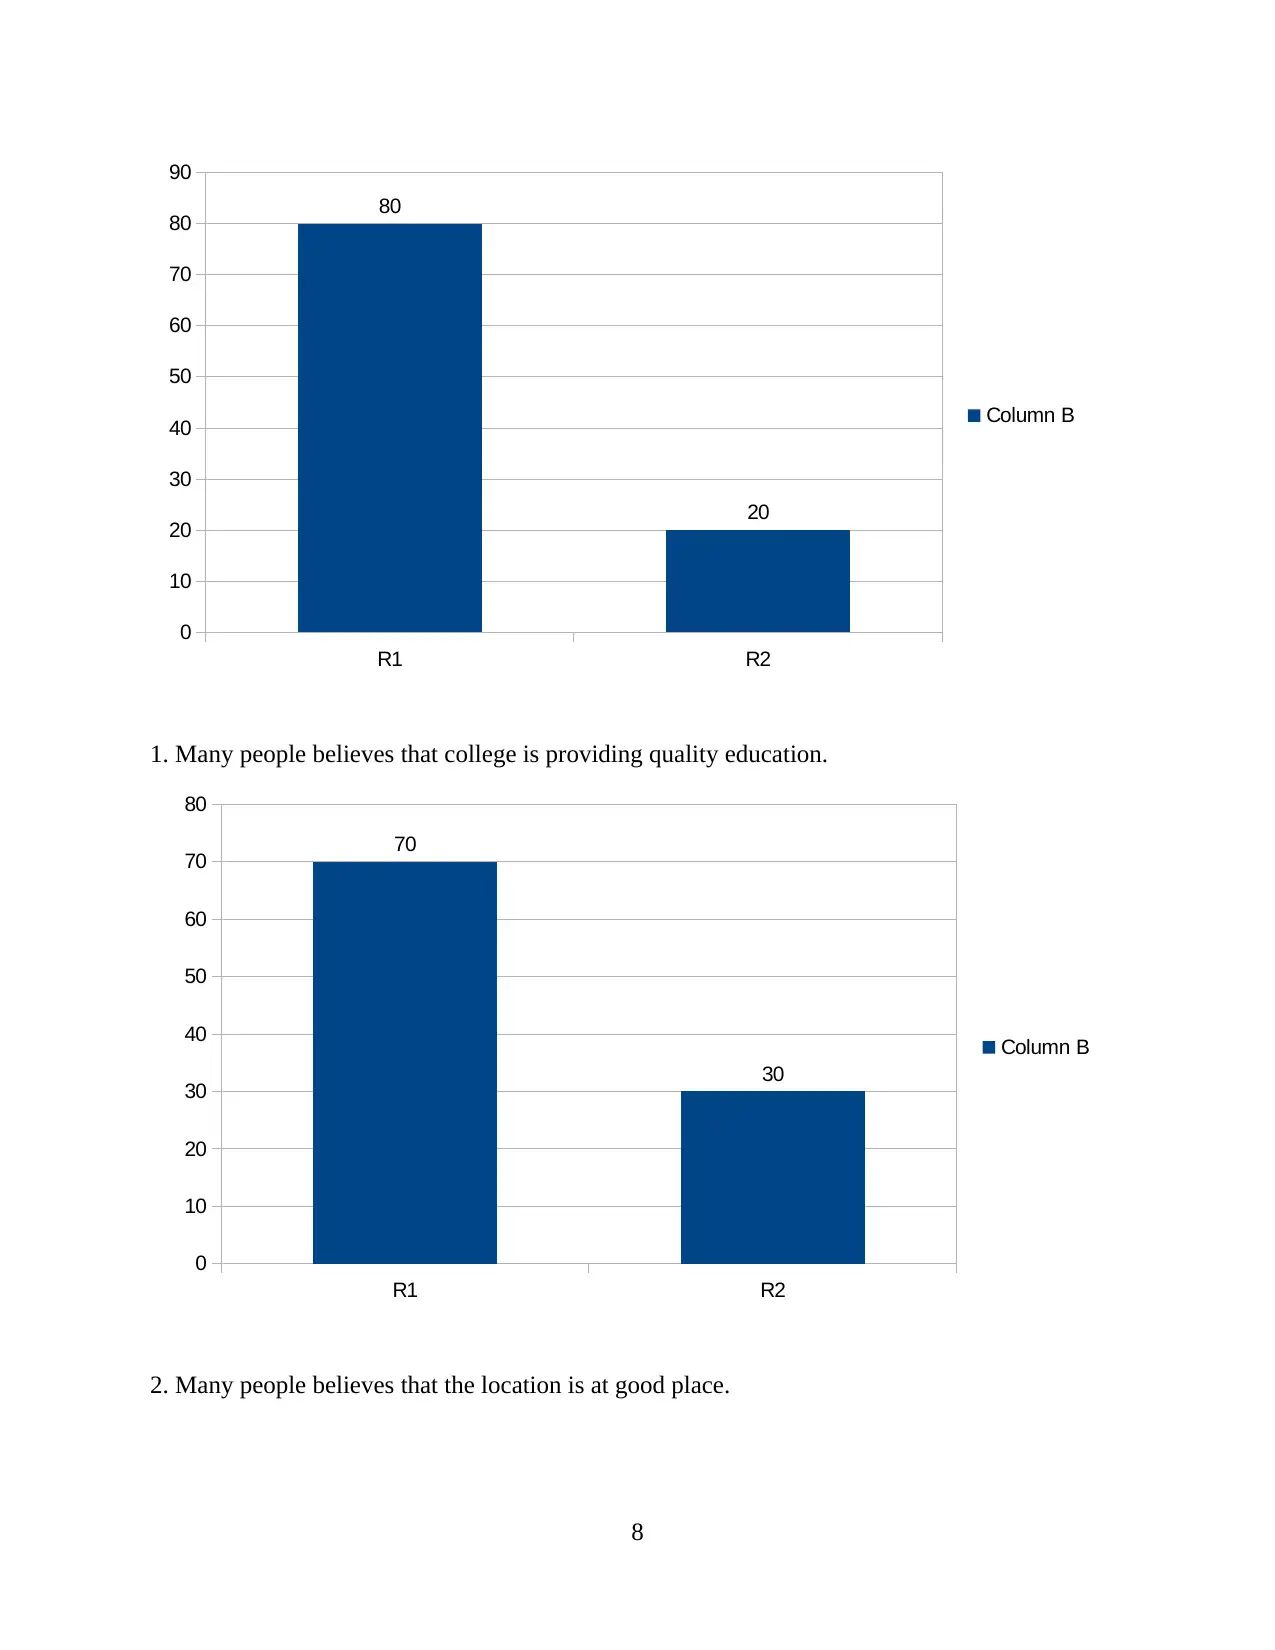
VerifiedAdded on 2020/09/17
|21
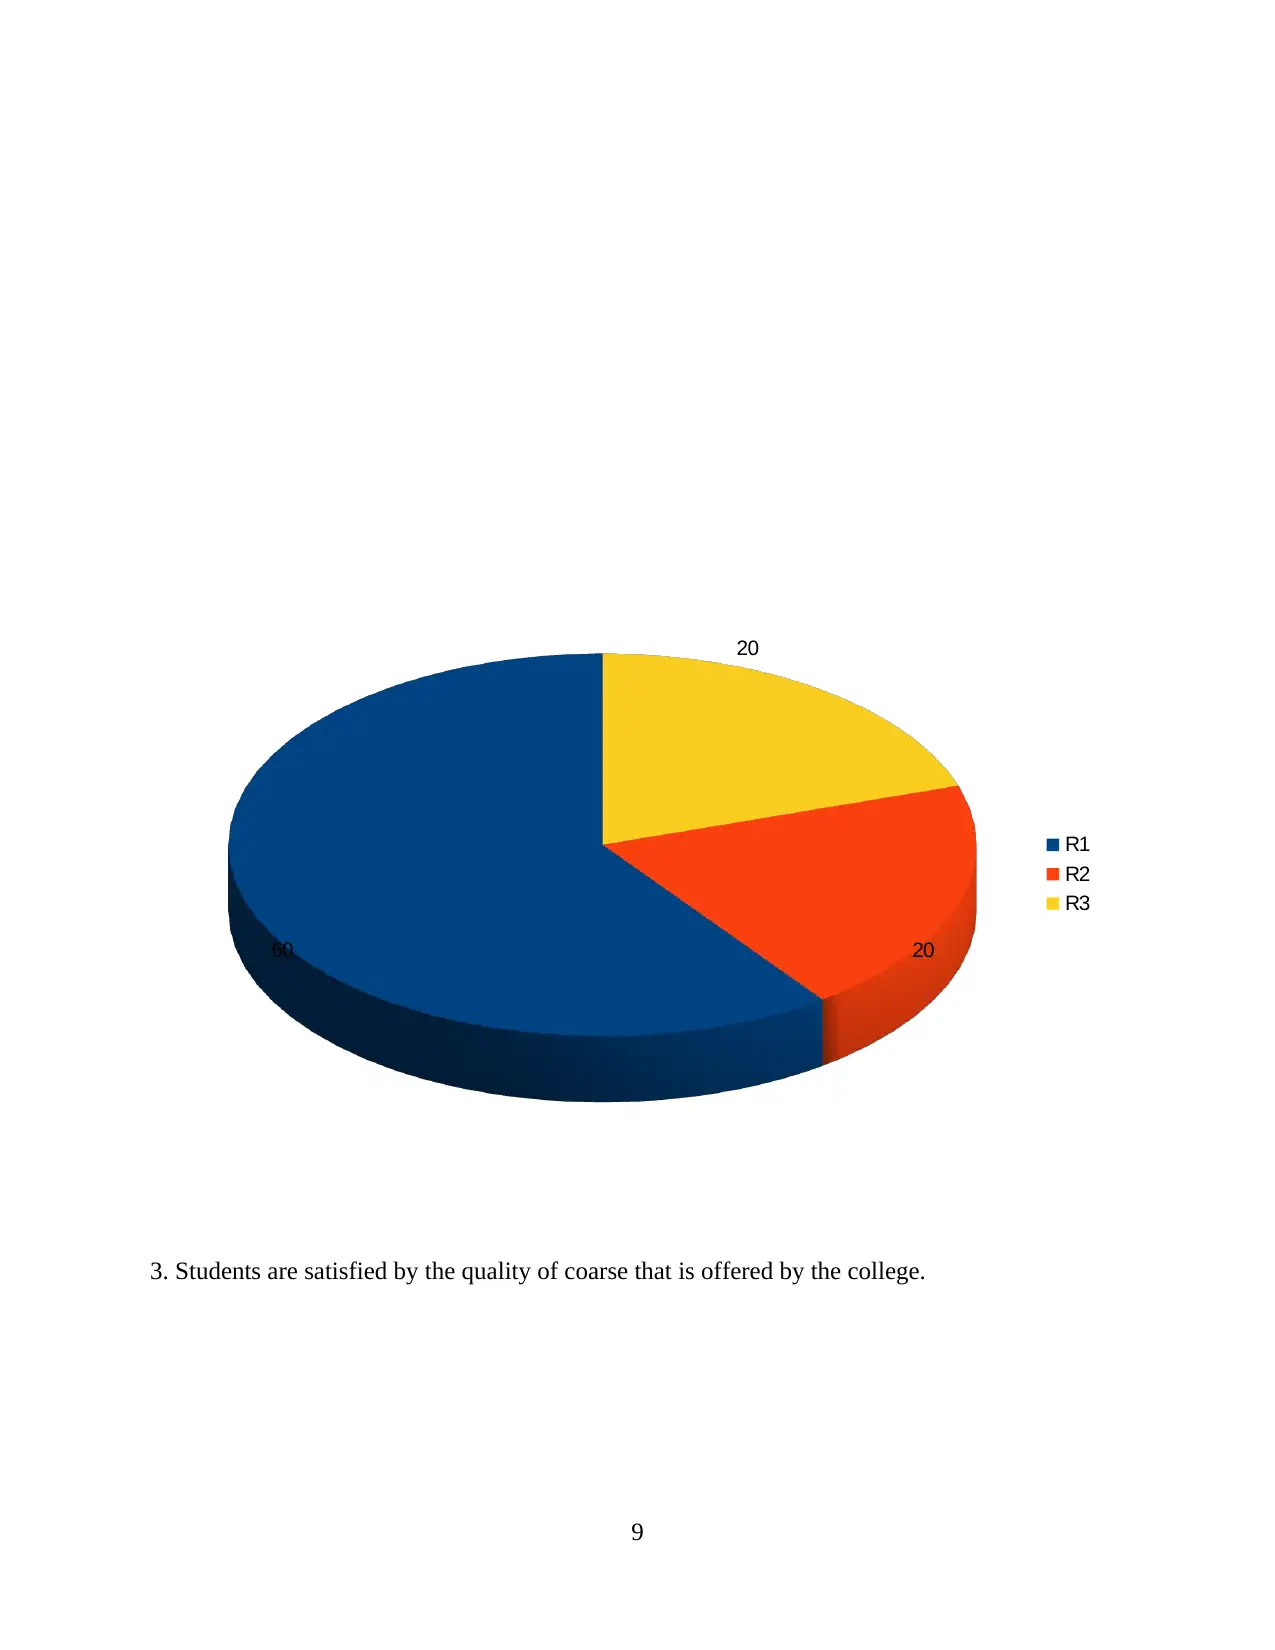
|3534
|55
Report
AI Summary
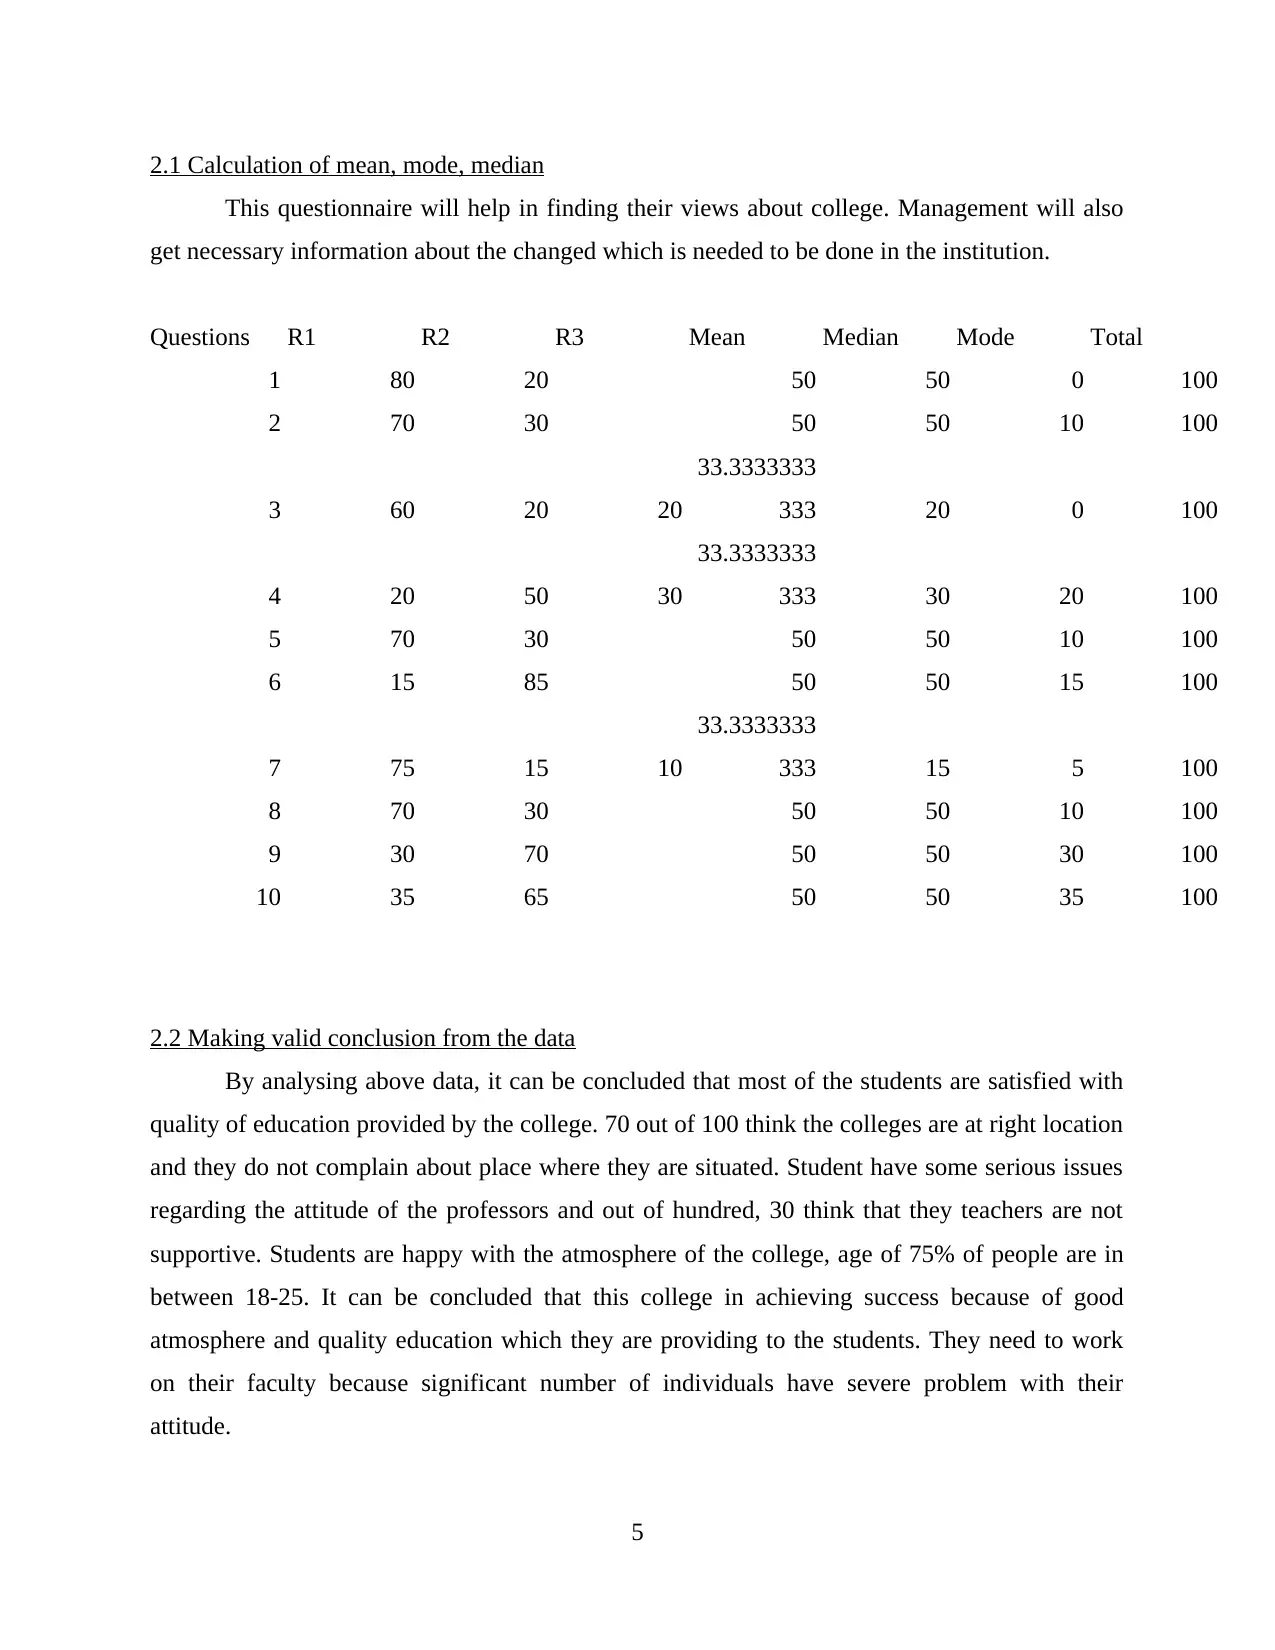
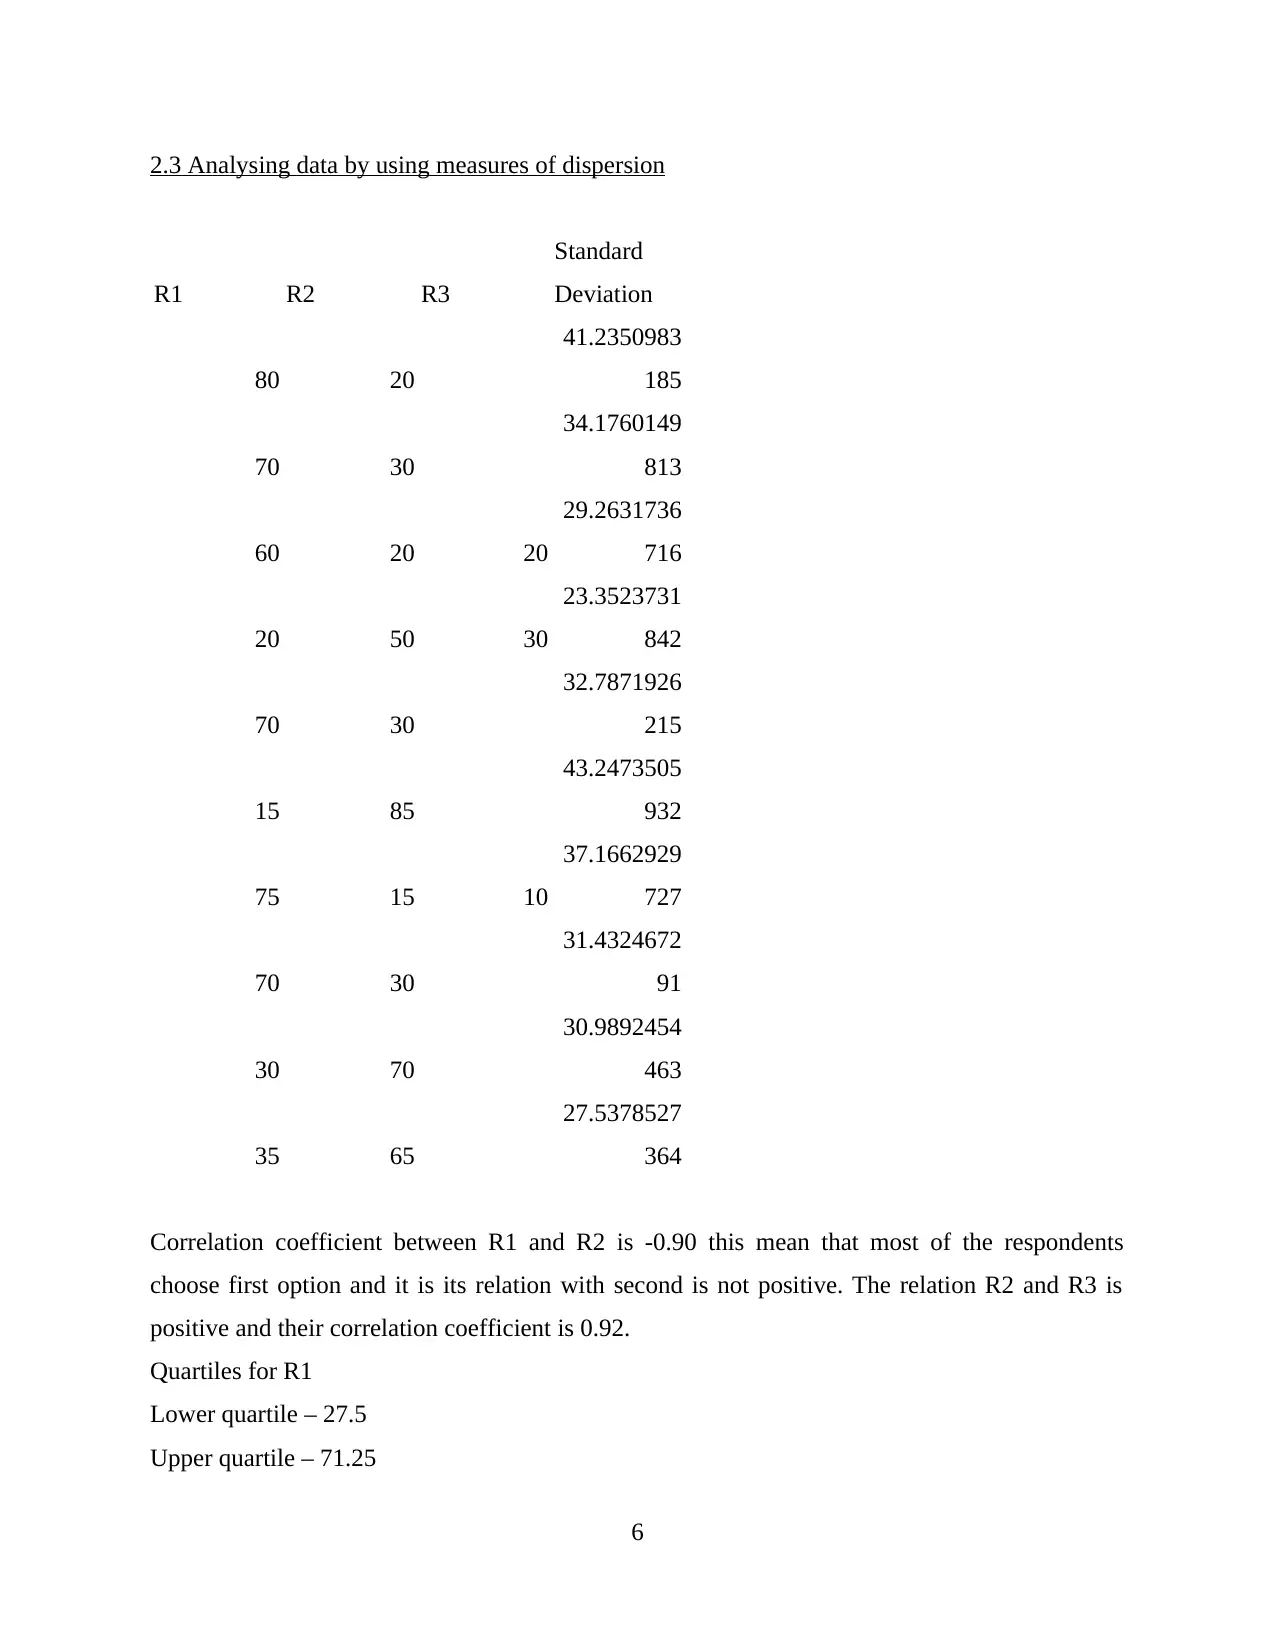
This report, focusing on business decision-making, analyzes data collected through questionnaires from 100 respondents at Ground for Education College. The study examines student satisfaction with the college's quality of education, location, course offerings, faculty attitude, and overall atmosphere. The report includes calculations of mean, mode, and median, along with measures of dispersion like standard deviation and correlation coefficients. Charts and graphs are used to visualize the data, and a trend line is created to identify patterns. The analysis reveals that while students are generally satisfied with the education quality and location, there are concerns regarding faculty attitude and pricing. The report concludes with recommendations for the college to improve faculty support, address pricing concerns, and enhance student satisfaction. The study highlights the importance of data-driven decision-making for business growth and improvement, using information processing tools to convert raw data into meaningful insights for the college's management.

1 out of 21
Related Documents


Your All-in-One AI-Powered Toolkit for Academic Success.
+13062052269
info@desklib.com
Available 24*7 on WhatsApp / Email
![[object Object]](/_next/static/media/star-bottom.7253800d.svg)
Copyright © 2020–2026 A2Z Services. All Rights Reserved. Developed and managed by ZUCOL.