Inferential Statistics Analysis: SOWK 3002 Assignment 3 Solutions

Verified

Added on  2023/01/13

|6
|776
|61
Homework Assignment
AI Summary
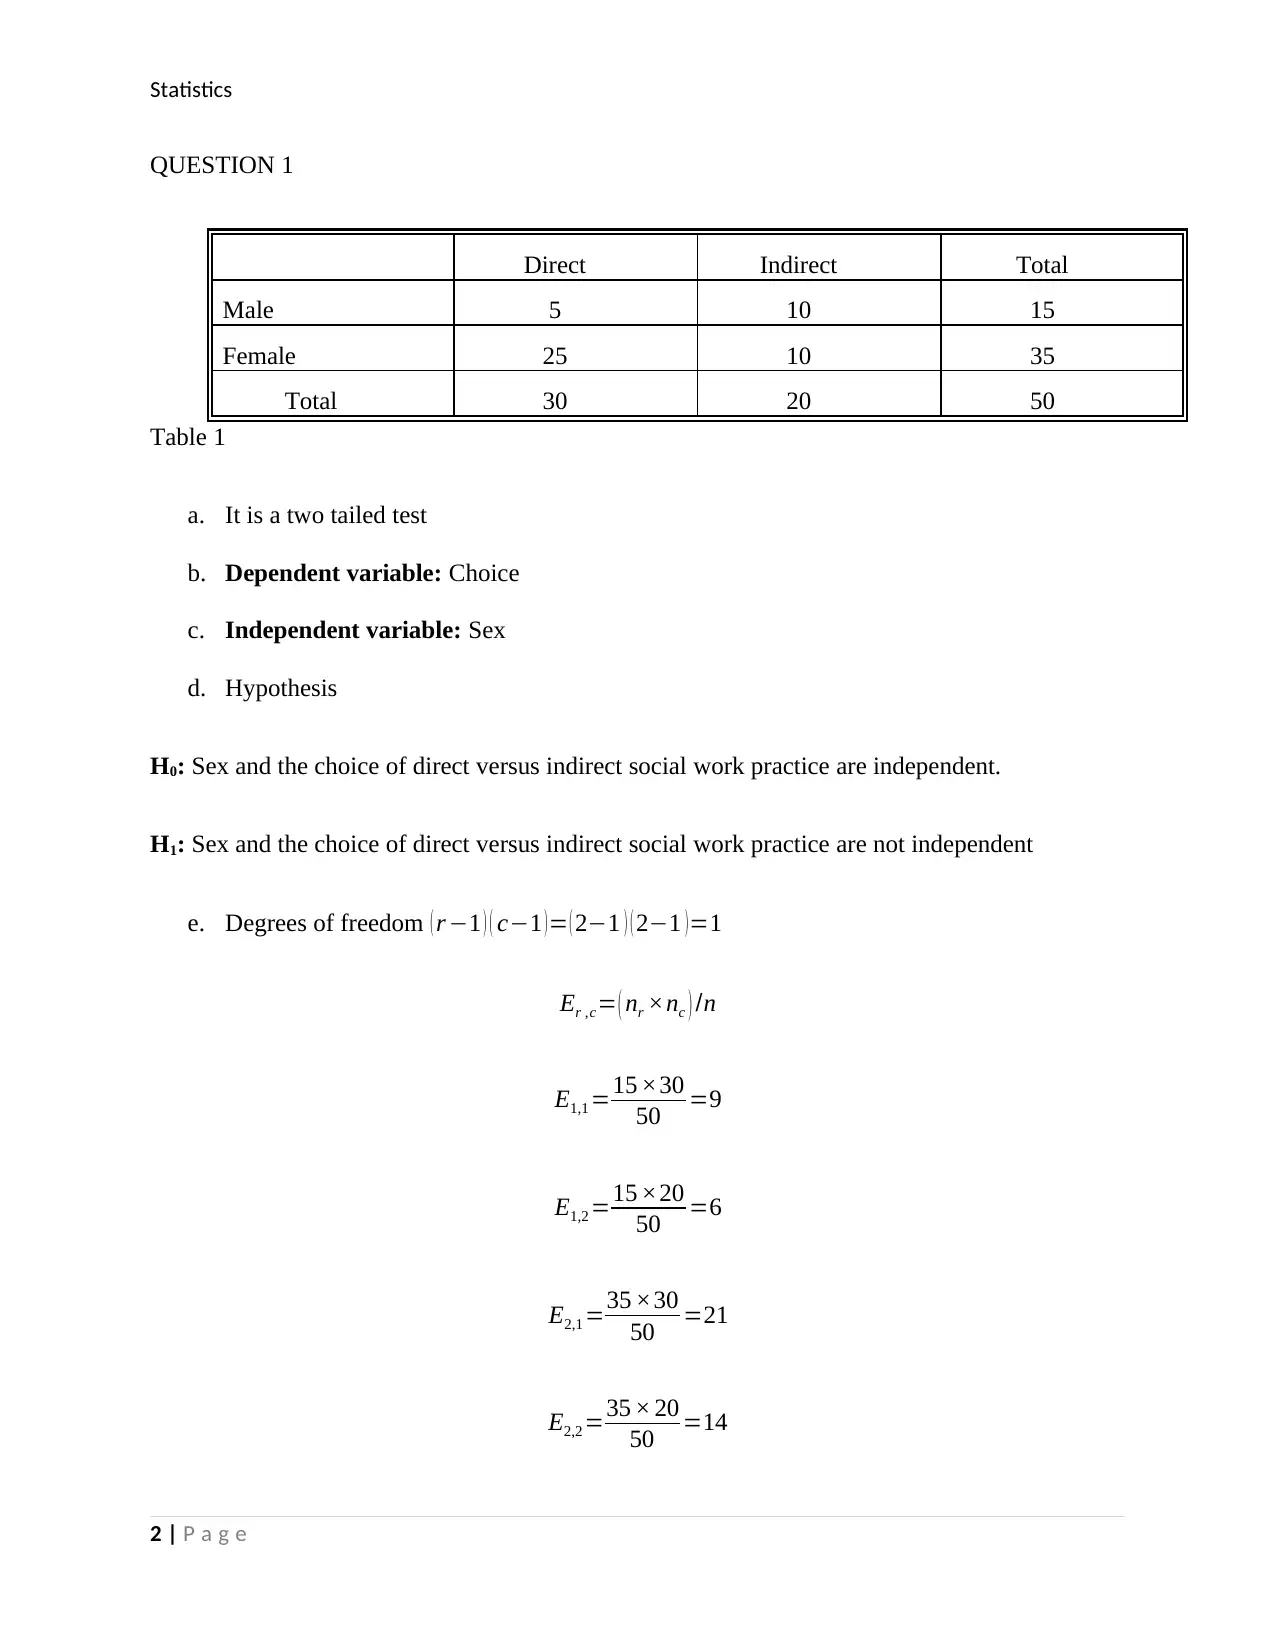
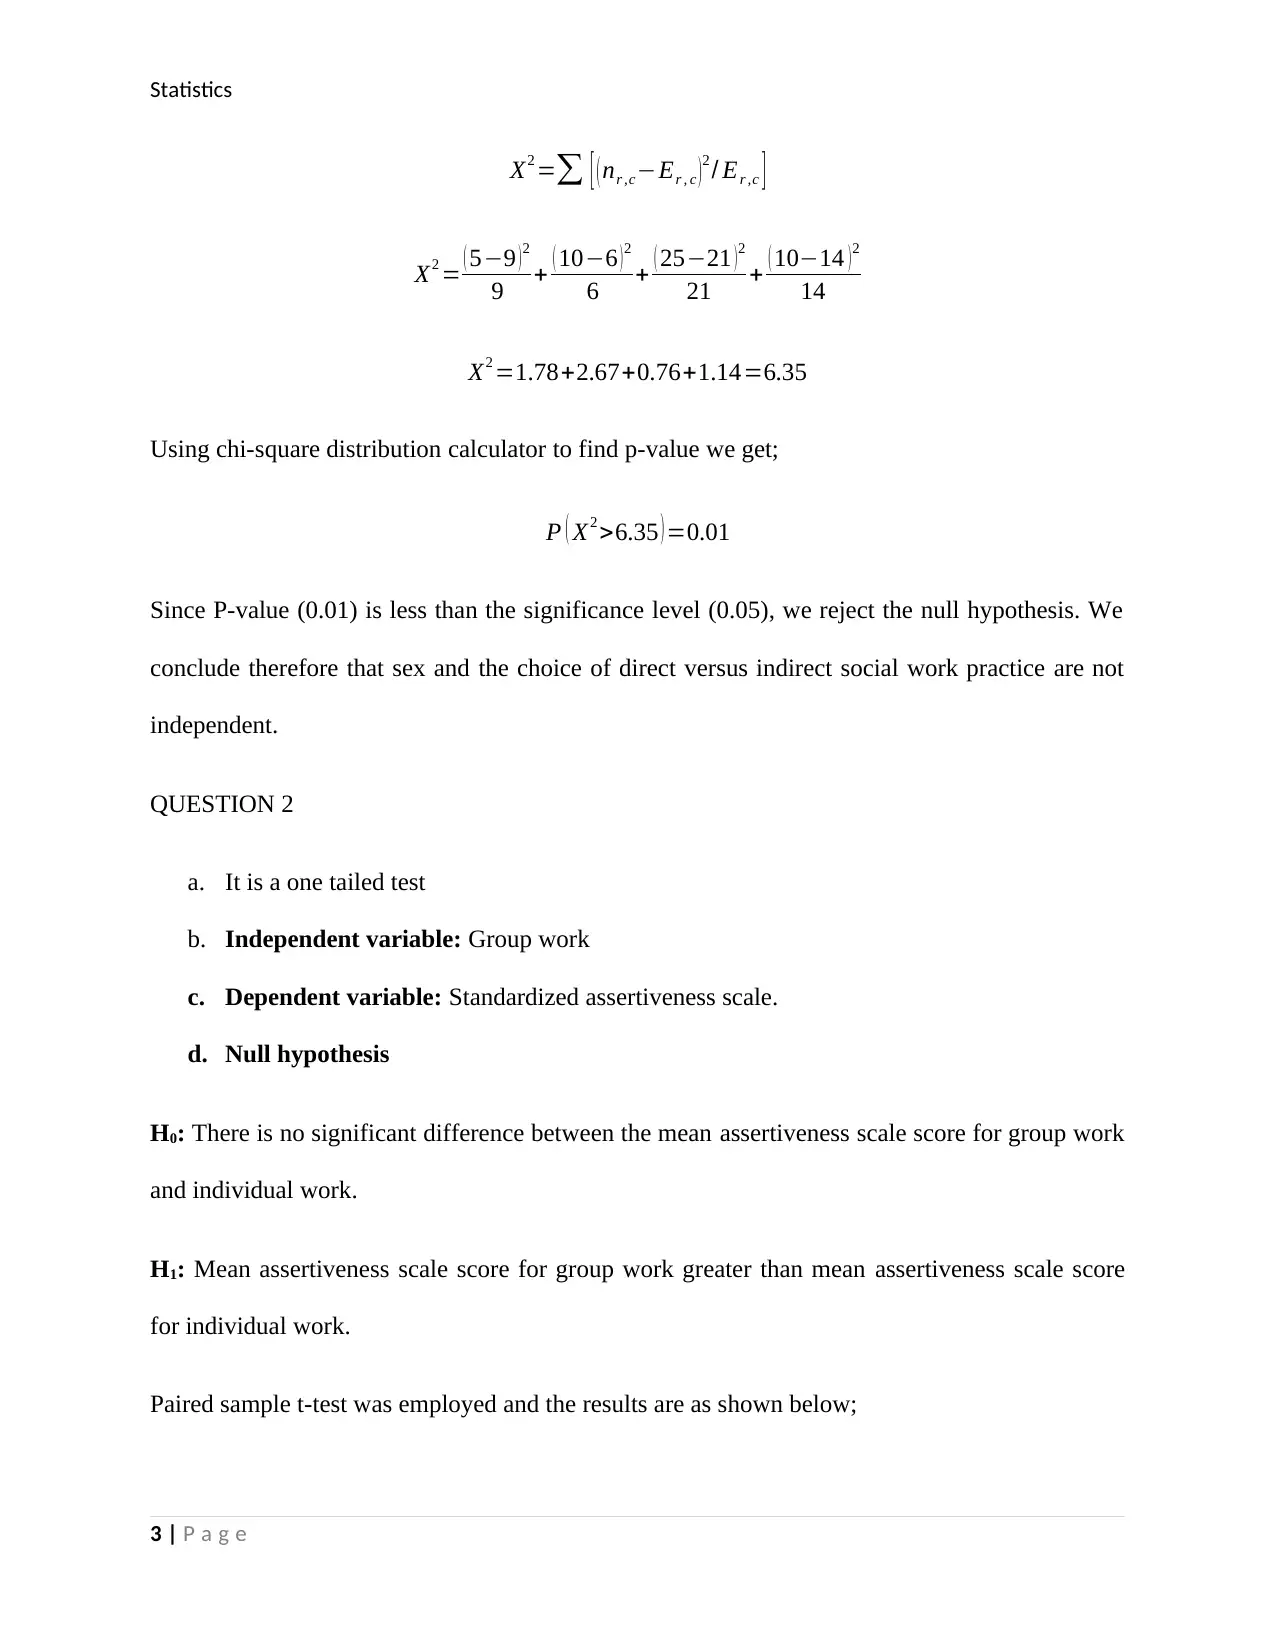
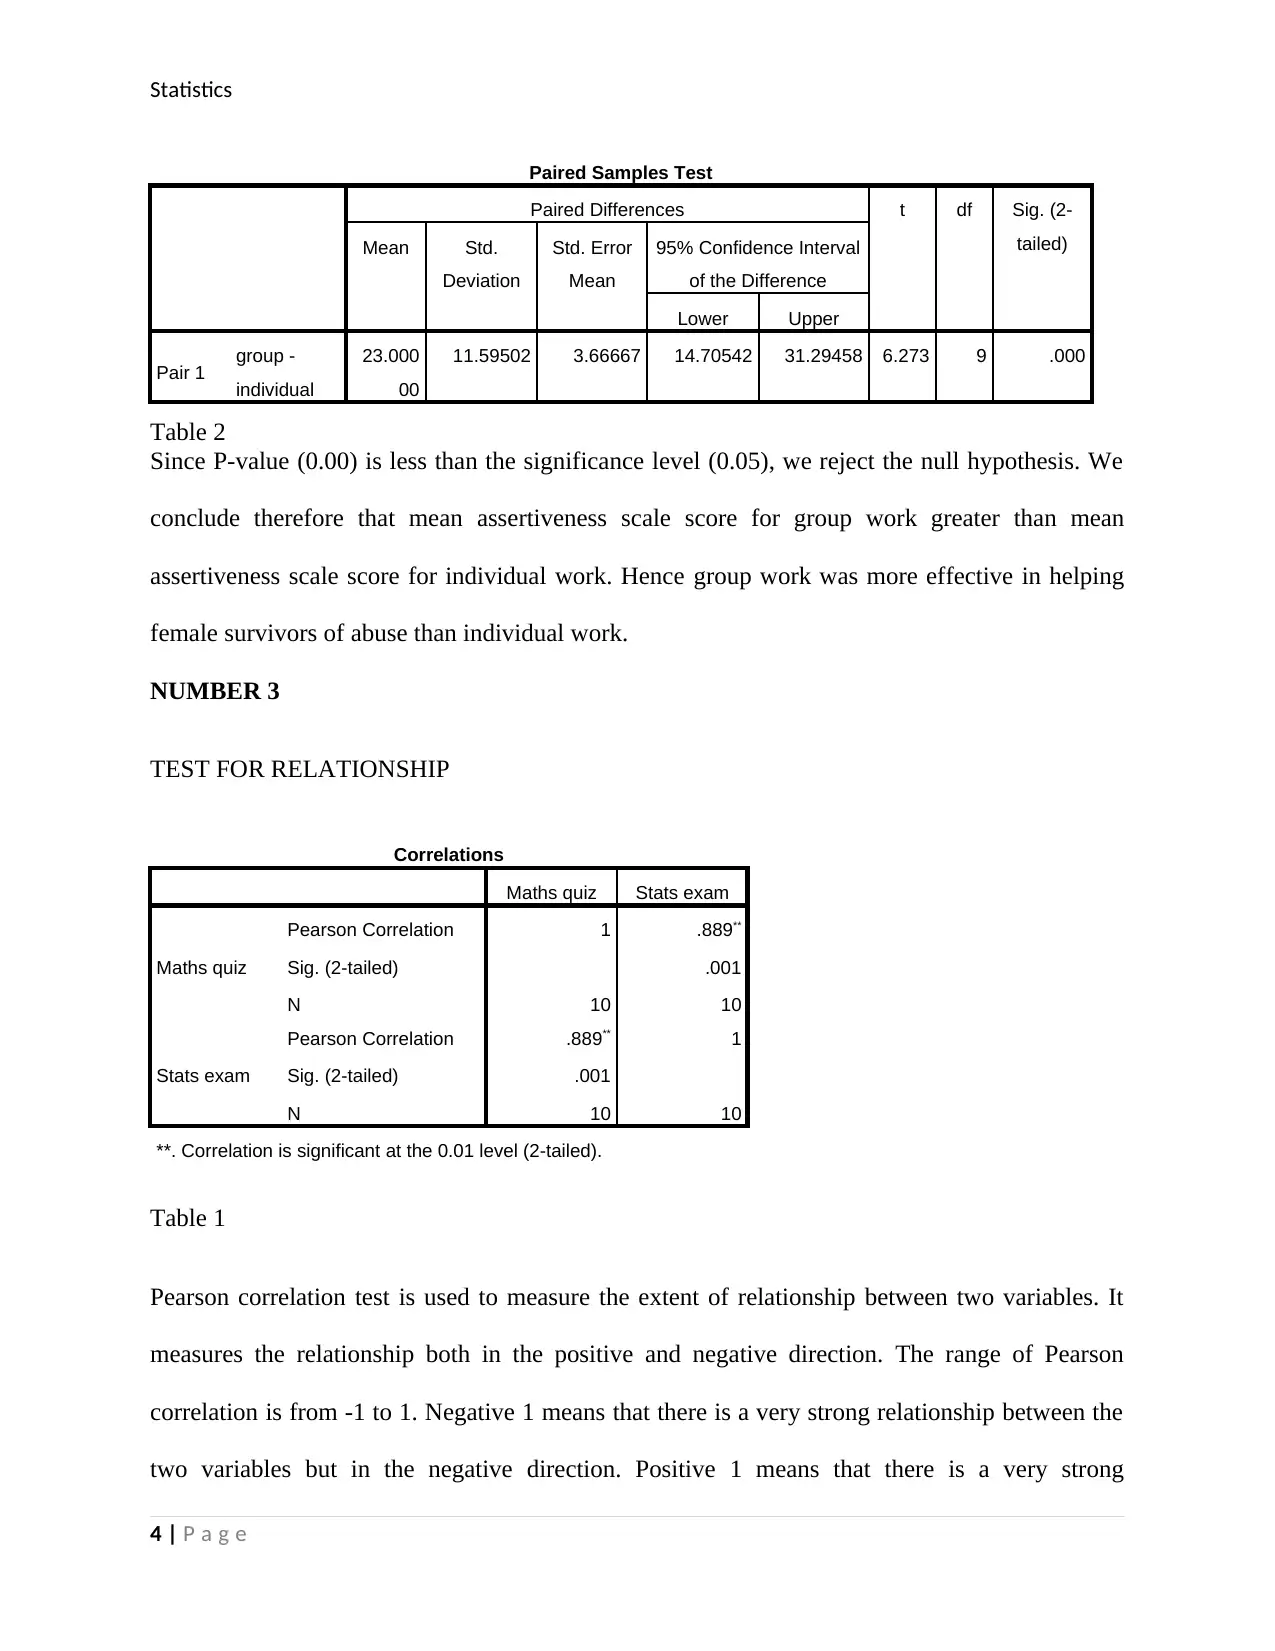
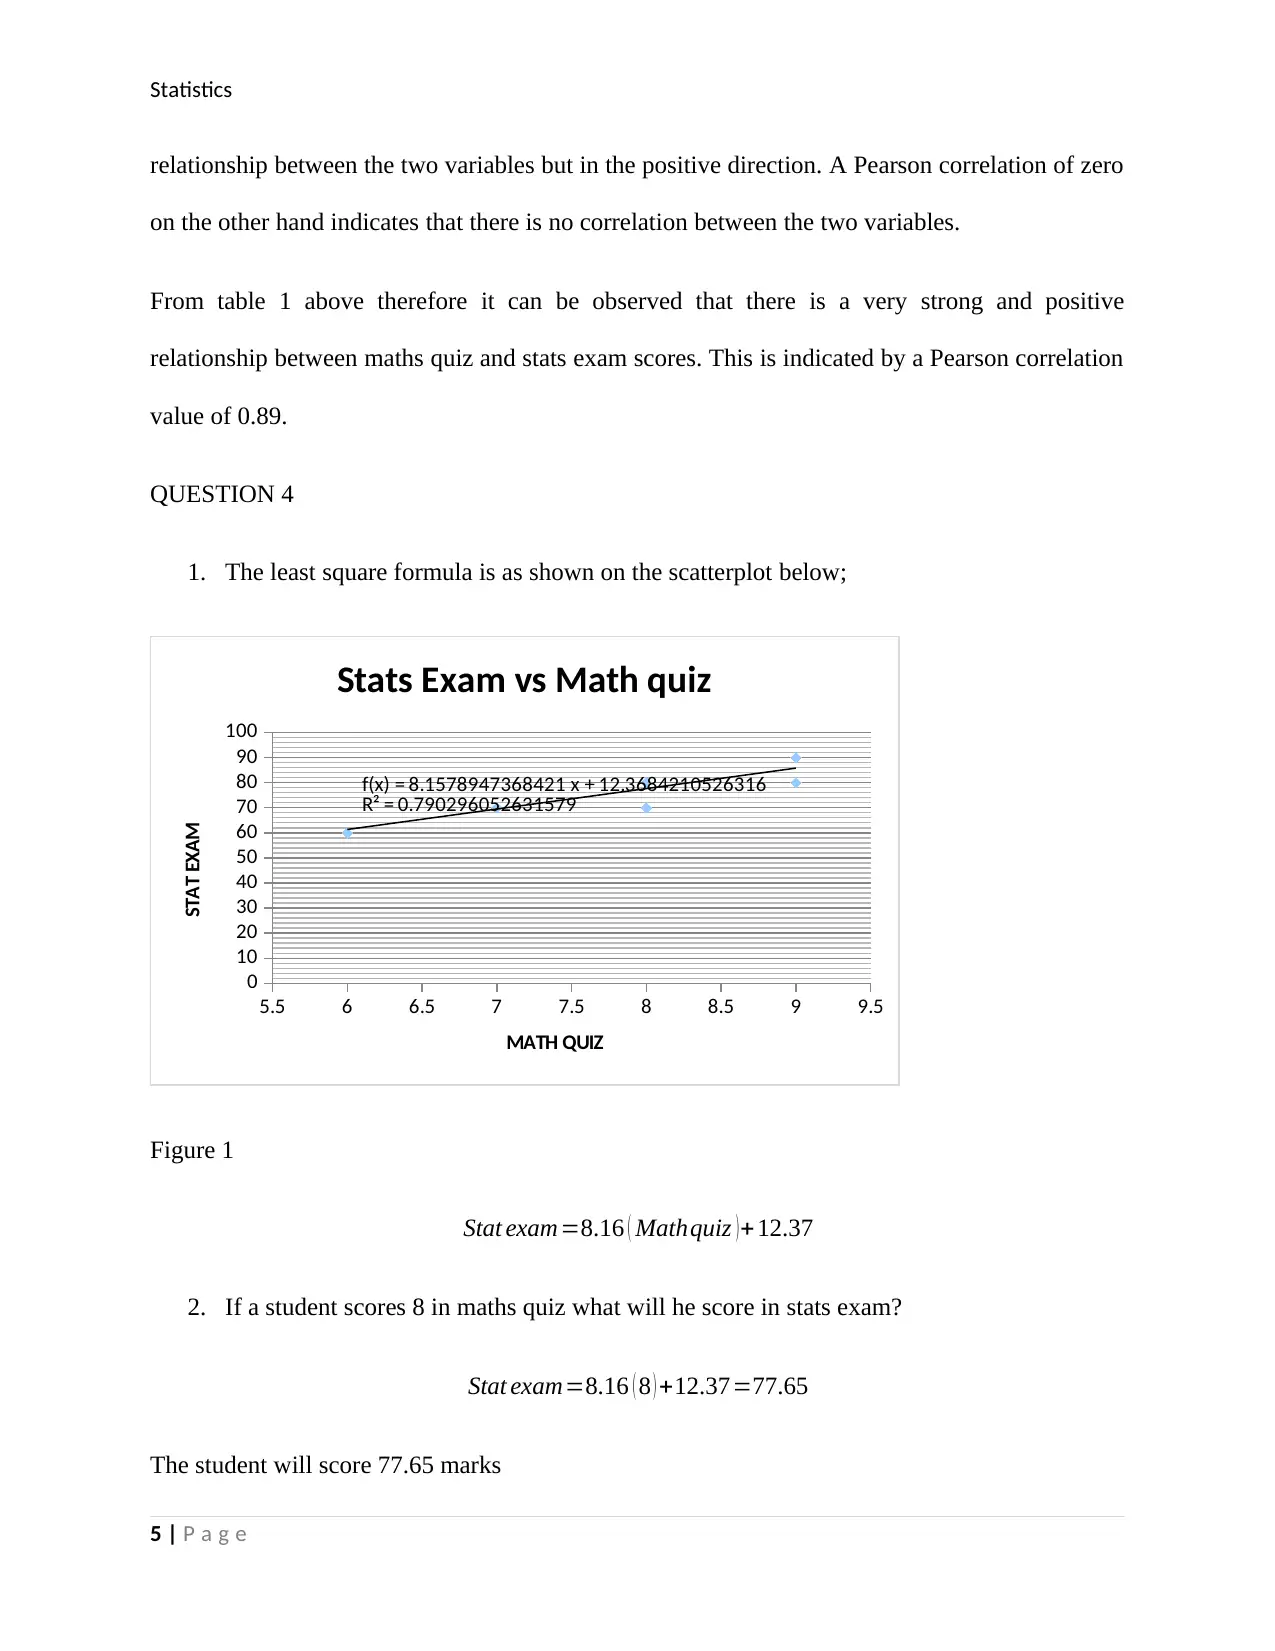
This document provides a comprehensive solution to an inferential statistics assignment, addressing two key questions. The first question explores the relationship between sex and the choice of social work practice (direct vs. indirect) using a chi-square test, including hypothesis formulation, calculations, and interpretation of results, concluding that sex and practice choice are not independent. The second question investigates the effectiveness of group work versus individual work in helping female survivors of abuse, employing a paired sample t-test to compare assertiveness scale scores, with detailed calculations and a conclusion that group work is more effective. Additionally, the assignment includes a Pearson correlation analysis to assess the relationship between math quiz and stats exam scores, and a regression analysis to predict stat exam scores based on math quiz scores, including the least-squares formula and interpretation.
tabler-icon-diamond-filled.svg

Contribute Materials

Your contribution can guide someone’s learning journey. Share your documents today.
Document Page
Statistics
Statistics
Student name:
Tutor name:
1 | P a g e
tabler-icon-diamond-filled.svg

Secure Best Marks with AI Grader

Need help grading? Try our AI Grader for instant feedback on your assignments.
Document Page
Statistics
QUESTION 1
Direct Indirect Total
Male 5 10 15
Female 25 10 35
Total 30 20 50
Table 1
a. It is a two tailed test
b. Dependent variable: Choice
c. Independent variable: Sex
d. Hypothesis
H0: Sex and the choice of direct versus indirect social work practice are independent.
H1: Sex and the choice of direct versus indirect social work practice are not independent
e. Degrees of freedom ( r 1 ) ( c1 )= ( 21 ) ( 21 )=1
Er ,c= ( nr ×nc ) /n
E1,1 =15 ×30
50 =9
E1,2 =15 ×20
50 =6
E2,1 =35 ×30
50 =21
E2,2 =35 × 20
50 =14
2 | P a g e
Document Page
Statistics
X2 = [ ( nr ,cEr , c )2 / Er ,c ]
X2 = ( 59 ) 2
9 + ( 106 ) 2
6 + ( 2521 ) 2
21 + ( 1014 ) 2
14
X2 =1.78+2.67+0.76+1.14=6.35
Using chi-square distribution calculator to find p-value we get;
P ( X2 >6.35 ) =0.01
Since P-value (0.01) is less than the significance level (0.05), we reject the null hypothesis. We
conclude therefore that sex and the choice of direct versus indirect social work practice are not
independent.
QUESTION 2
a. It is a one tailed test
b. Independent variable: Group work
c. Dependent variable: Standardized assertiveness scale.
d. Null hypothesis
H0: There is no significant difference between the mean assertiveness scale score for group work
and individual work.
H1: Mean assertiveness scale score for group work greater than mean assertiveness scale score
for individual work.
Paired sample t-test was employed and the results are as shown below;
3 | P a g e
Document Page
Statistics
Paired Samples Test
Paired Differences t df Sig. (2-
tailed)Mean Std.
Deviation
Std. Error
Mean
95% Confidence Interval
of the Difference
Lower Upper
Pair 1 group -
individual
23.000
00
11.59502 3.66667 14.70542 31.29458 6.273 9 .000
Table 2
Since P-value (0.00) is less than the significance level (0.05), we reject the null hypothesis. We
conclude therefore that mean assertiveness scale score for group work greater than mean
assertiveness scale score for individual work. Hence group work was more effective in helping
female survivors of abuse than individual work.
NUMBER 3
TEST FOR RELATIONSHIP
Correlations
Maths quiz Stats exam
Maths quiz
Pearson Correlation 1 .889**
Sig. (2-tailed) .001
N 10 10
Stats exam
Pearson Correlation .889** 1
Sig. (2-tailed) .001
N 10 10
**. Correlation is significant at the 0.01 level (2-tailed).
Table 1
Pearson correlation test is used to measure the extent of relationship between two variables. It
measures the relationship both in the positive and negative direction. The range of Pearson
correlation is from -1 to 1. Negative 1 means that there is a very strong relationship between the
two variables but in the negative direction. Positive 1 means that there is a very strong
4 | P a g e
tabler-icon-diamond-filled.svg

Secure Best Marks with AI Grader

Need help grading? Try our AI Grader for instant feedback on your assignments.
Document Page
Statistics
relationship between the two variables but in the positive direction. A Pearson correlation of zero
on the other hand indicates that there is no correlation between the two variables.
From table 1 above therefore it can be observed that there is a very strong and positive
relationship between maths quiz and stats exam scores. This is indicated by a Pearson correlation
value of 0.89.
QUESTION 4
1. The least square formula is as shown on the scatterplot below;
5.5 6 6.5 7 7.5 8 8.5 9 9.5
0
10
20
30
40
50
60
70
80
90
100
f(x) = 8.1578947368421 x + 12.3684210526316
R² = 0.790296052631579
Stats Exam vs Math quiz
MATH QUIZ
STAT EXAM
Figure 1
Stat exam =8.16 ( Mathquiz ) +12.37
2. If a student scores 8 in maths quiz what will he score in stats exam?
Stat exam=8.16 ( 8 ) +12.37=77.65
The student will score 77.65 marks
5 | P a g e
Document Page
Statistics
This is so because the regression equation states that a one unit change in math quiz causes 8.16
units change in stat exam. Therefore if math score changes by 8 units, then stat score will change
to (8 x 8.16) units plus a constant 12.37
6 | P a g e
chevron_up_icon
1 out of 6
circle_padding
hide_on_mobile
zoom_out_icon
logo.png

Your All-in-One AI-Powered Toolkit for Academic Success.

Available 24*7 on WhatsApp / Email

[object Object]