Financial Analysis of JB Hi-Fi Company and Performance Evaluation
VerifiedAdded on 2021/05/30
|16
|4227
|115
Report
AI Summary
This report presents a comprehensive financial analysis of JB Hi-Fi Company, evaluating its performance through various financial tools and techniques. The analysis includes ratio analysis, cash flow analysis, and a comparison with a competitor company. The report assesses profitability, liquidity, and financial leverage, highlighting the company's strengths and weaknesses. Key financial ratios such as return on equity, return on assets, and earnings per share are examined to gauge the company's financial health. The analysis also delves into the company's cash flow statement and financial position, including debt-to-equity ratio and times interest earned. The report concludes with an evaluation of corporate governance and sustainability reporting, providing recommendations for improving business performance and investor value. The report emphasizes the company's strong profitability and liquidity, while also discussing areas for potential improvement such as the need to maintain effective asset turnover and manage the impact of increased fixed asset investments. The findings are intended to assist directors, managers, and investors in making informed decisions.
Jb Hi-fi Company
Financial analysis
Name of Author
Financial analysis
Name of Author
Paraphrase This Document
Need a fresh take? Get an instant paraphrase of this document with our AI Paraphraser
Executive Summary
This report put emphasis upon the financial performance of the Company. The
financial performance of company could be gauged by using the proper financial tools and
technique such as ratio analysis, bottom up analysis, top down analysis, cash flow analysis
and comparison analysis. It has been observed that in order to evaluate the financial
performance of company, there is one competitor company has been taken into consideration.
The ratio analysis uses in this report reflects that company has strong profitability and
liquidity throughout the time. It has been observed that company has kept the financial
leverage maintained which reflects that it will be having high sustainability in long run even
if the market is showing negative business factors. JB HI-FI Company has diversified its
business in other sectors as well which have increased its overall revenue by 25% since last
five year. The corporate governance compliance and reporting of company has shown that
company has strong legal compliance program which will assist organization to implement
the proper statistic program. Company has more than 7 independent directors in its board
composition who evaluates the true and fair view of assets of Company.
Table of Contents
Executive Summary...............................................................................................................................1
Introduction...........................................................................................................................................1
Description of Company........................................................................................................................2
Section-1................................................................................................................................................2
Profitability ratio analysis of JB HI FI and comparison of the same with the CVE technologies.........2
Analysis the cash flow statement of JB HI-FI Company......................................................................3
Financial position of JB HI-FI Company..............................................................................................4
Section no-2...........................................................................................................................................5
Financial analysis of JB Hi-Fi Company...................................................................................................5
Section-3................................................................................................................................................9
Conclusion...........................................................................................................................................10
References...........................................................................................................................................12
⊘ This is a preview!⊘
Do you want full access?
Subscribe today to unlock all pages.
Trusted by 1+ million students worldwide
Introduction
With the changes in the complex business structure ramified business factors,
organization needs to perform effectively by using the effective financial strategic program.
There are several financial analysis tools which could be used by the investors to analysis
whether financial performance of company is strong or not. There are several financial tools
such as ratio analysis, bottom up analysis, top down analysis, cash flow analysis and
comparison analysis which could be used by investors to analysis the business performance
of company. In this report, financial performance of JB Hi-Fi Company has been taken into
consideration to analysis the whether company will have strong position in future or not. In
the starting of this report, financial performance of company with its competitors has been
taken into consideration. After that, ratio analysis tool have been used to evaluate the
financial performance of company. In the end, corporate governance report and sustainability
reporting of the company has been analyzed for the effective functioning of organization. In
the end, recommendation has been given which could be used by directors and managers of
company to improve the business performance of company. It could also be used by investors
to create value on their investment. In the end, conclusion has been given for the core aspects
of the report prepared on the financial performance and governance of JB Hi-Fi Company.
Description of Company
JB Hi-Fi Company has been running its business on international level. It is an
Australian and New Zealand Company indulged in offering video games, Ultra HD Blu-rays,
Blu-rays, DVDs, CDs, electronics/hardware, electrical home appliances, mobile phones and a
number of Telstra services (JB Hi-Fi, 2017). The main headquarter of Company is in Pert,
Australia. In 2017 company had total revenue of 425 billion which increased by 12% since
last two years (Ehiedu, 2014).
Paraphrase This Document
Need a fresh take? Get an instant paraphrase of this document with our AI Paraphraser
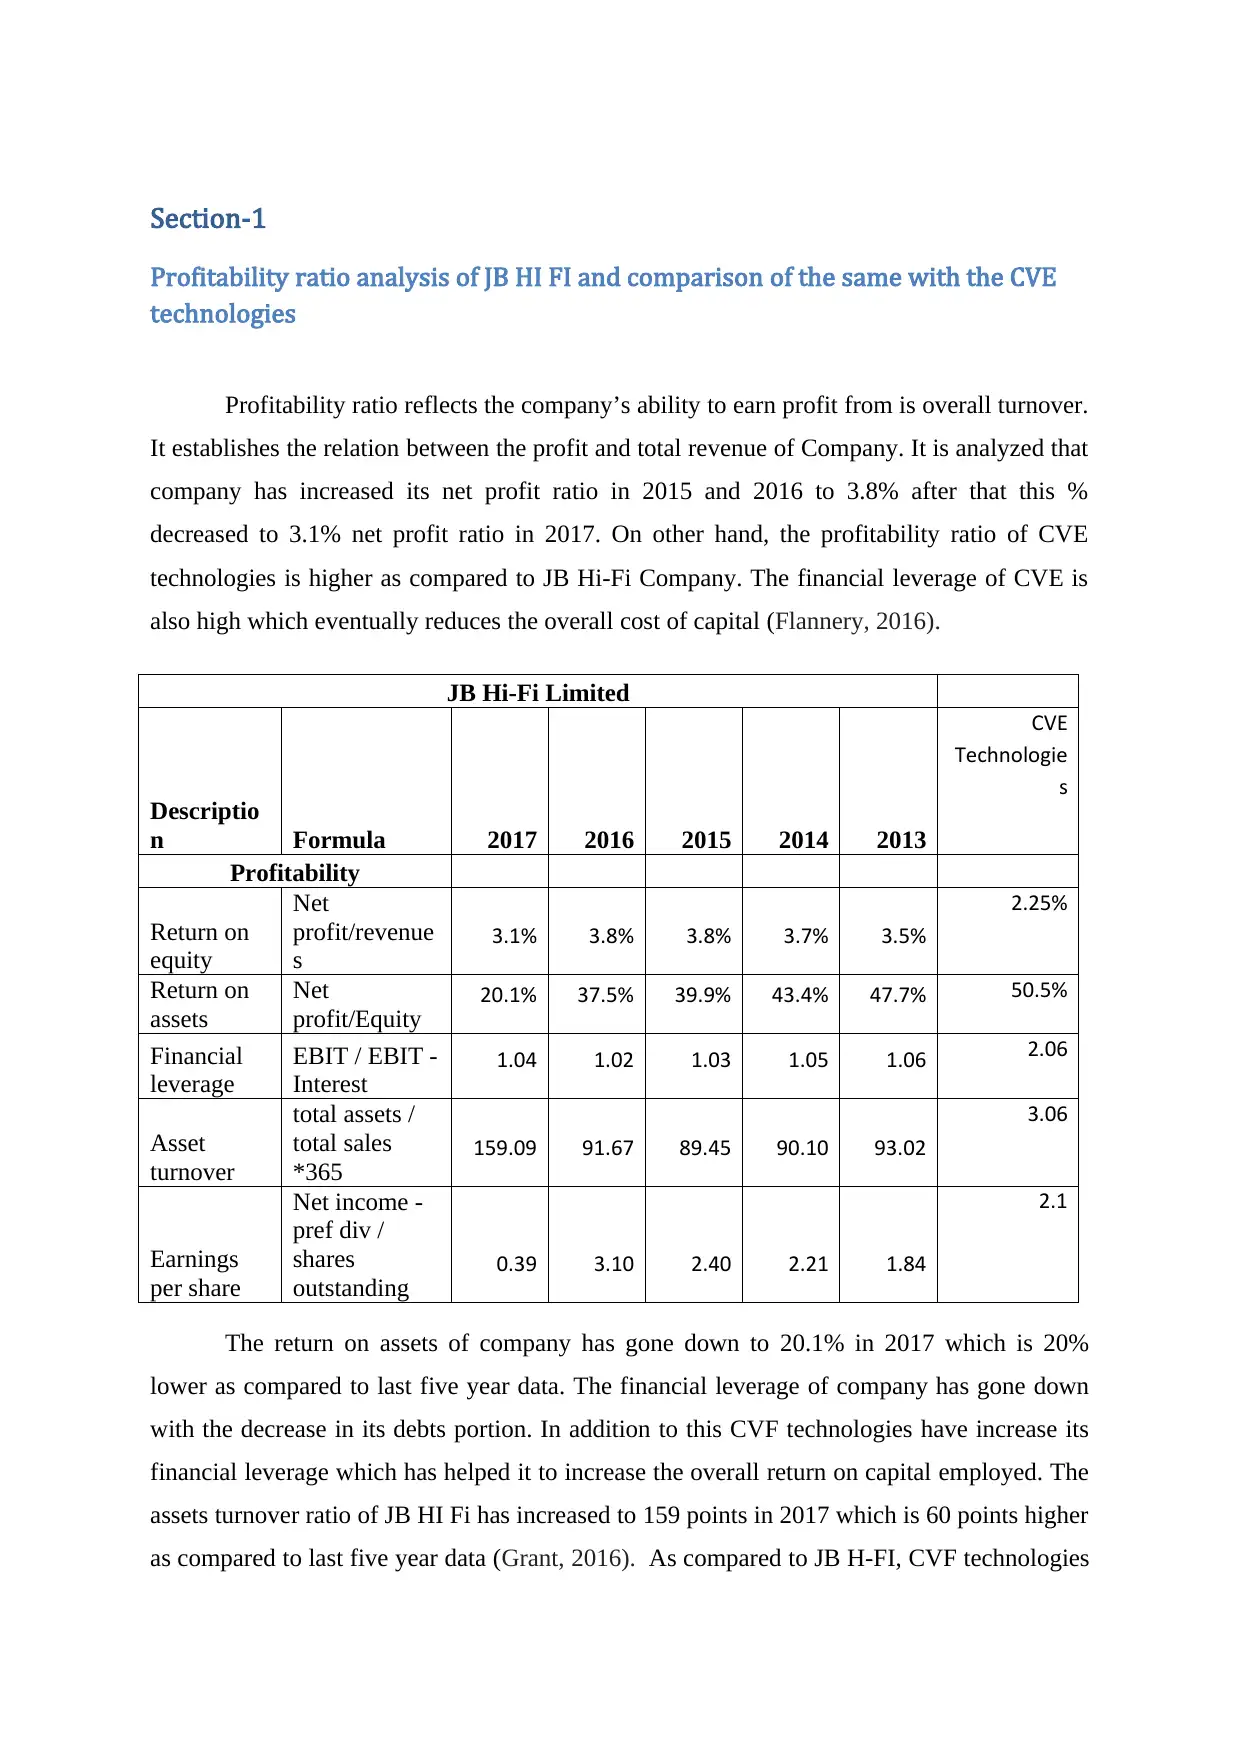
Section-1
Profitability ratio analysis of JB HI FI and comparison of the same with the CVE
technologies
Profitability ratio reflects the company’s ability to earn profit from is overall turnover.
It establishes the relation between the profit and total revenue of Company. It is analyzed that
company has increased its net profit ratio in 2015 and 2016 to 3.8% after that this %
decreased to 3.1% net profit ratio in 2017. On other hand, the profitability ratio of CVE
technologies is higher as compared to JB Hi-Fi Company. The financial leverage of CVE is
also high which eventually reduces the overall cost of capital (Flannery, 2016).
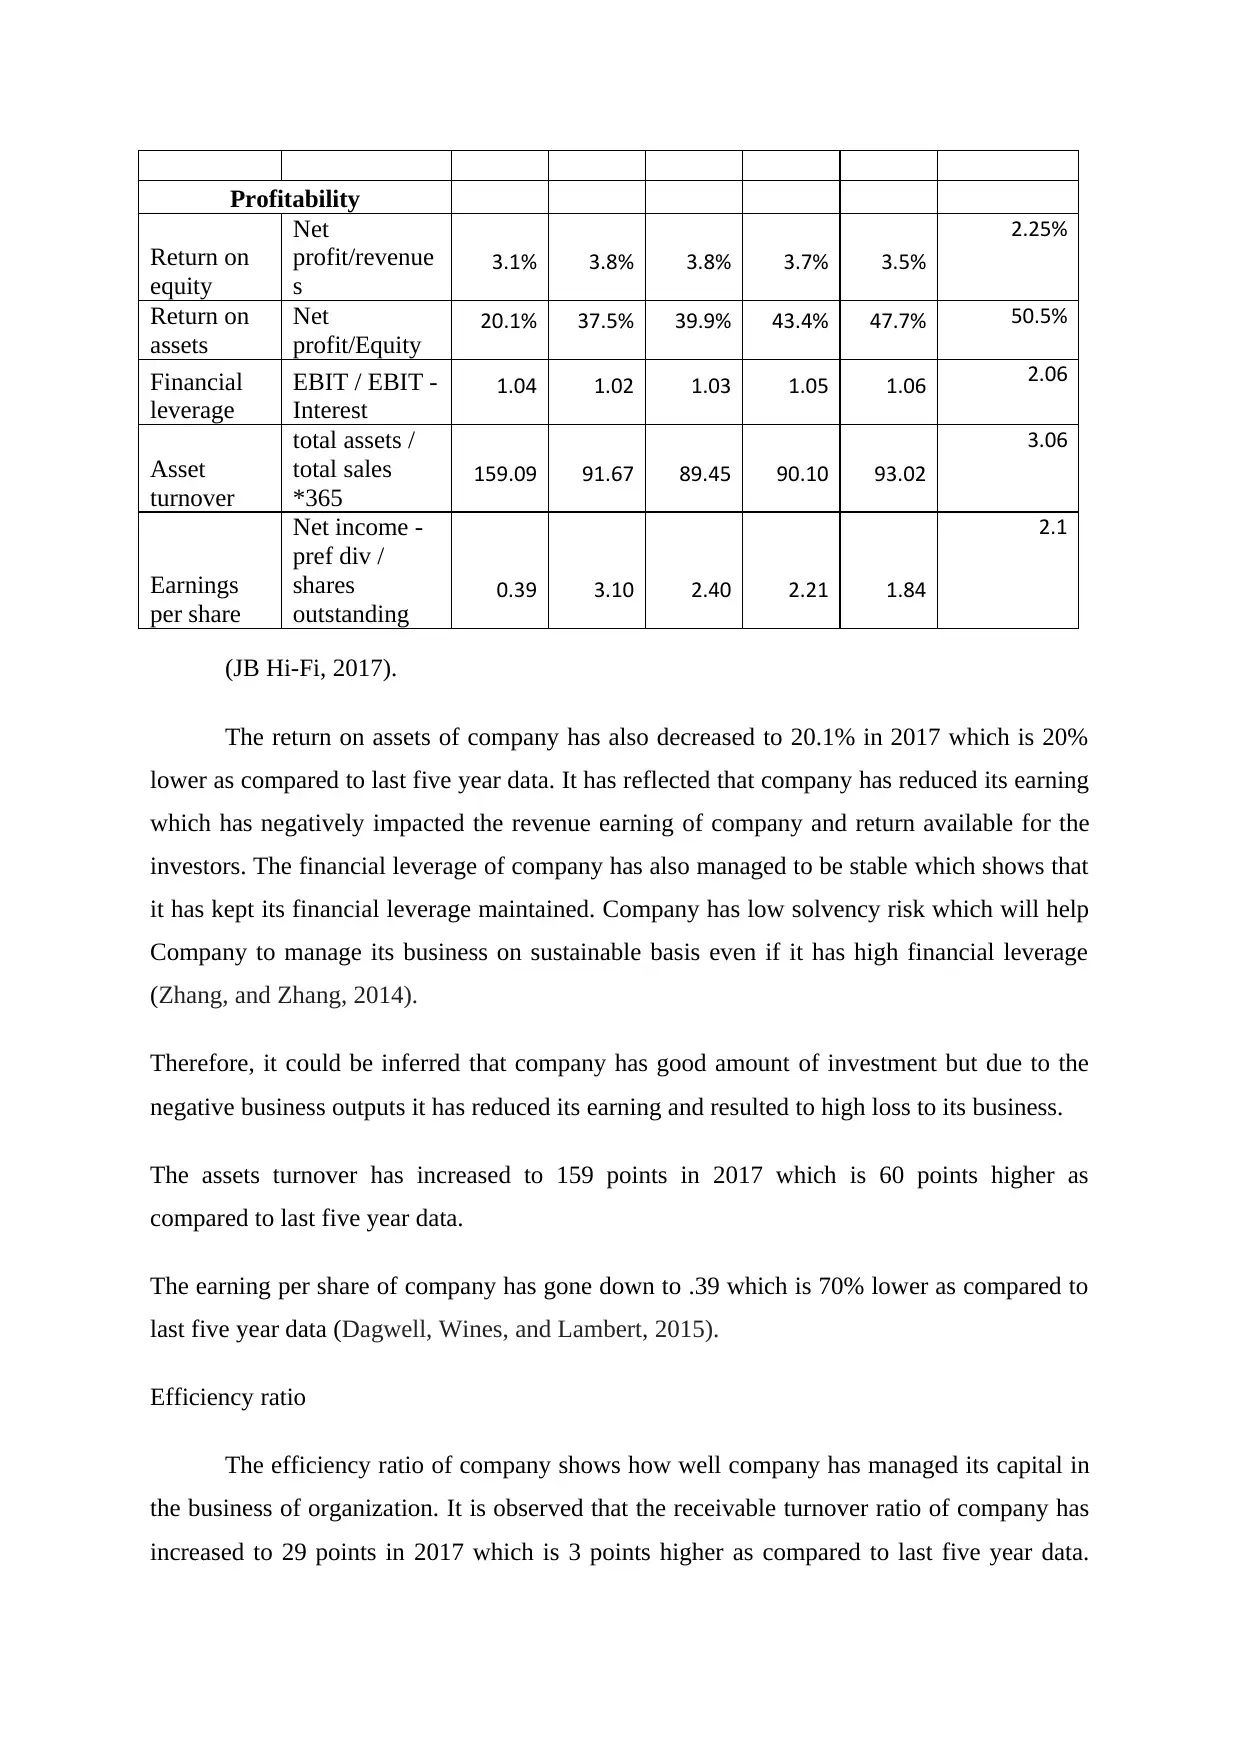
JB Hi-Fi Limited
Descriptio
n Formula 2017 2016 2015 2014 2013
CVE
Technologie
s
Profitability
Return on
equity
Net
profit/revenue
s 3.1% 3.8% 3.8% 3.7% 3.5%
2.25%
Return on
assets
Net
profit/Equity 20.1% 37.5% 39.9% 43.4% 47.7% 50.5%
Financial
leverage
EBIT / EBIT -
Interest 1.04 1.02 1.03 1.05 1.06 2.06
Asset
turnover
total assets /
total sales
*365 159.09 91.67 89.45 90.10 93.02
3.06
Earnings
per share
Net income -
pref div /
shares
outstanding 0.39 3.10 2.40 2.21 1.84
2.1
The return on assets of company has gone down to 20.1% in 2017 which is 20%
lower as compared to last five year data. The financial leverage of company has gone down
with the decrease in its debts portion. In addition to this CVF technologies have increase its
financial leverage which has helped it to increase the overall return on capital employed. The
assets turnover ratio of JB HI Fi has increased to 159 points in 2017 which is 60 points higher
as compared to last five year data (Grant, 2016). As compared to JB H-FI, CVF technologies
Profitability ratio analysis of JB HI FI and comparison of the same with the CVE
technologies
Profitability ratio reflects the company’s ability to earn profit from is overall turnover.
It establishes the relation between the profit and total revenue of Company. It is analyzed that
company has increased its net profit ratio in 2015 and 2016 to 3.8% after that this %
decreased to 3.1% net profit ratio in 2017. On other hand, the profitability ratio of CVE
technologies is higher as compared to JB Hi-Fi Company. The financial leverage of CVE is
also high which eventually reduces the overall cost of capital (Flannery, 2016).
JB Hi-Fi Limited
Descriptio
n Formula 2017 2016 2015 2014 2013
CVE
Technologie
s
Profitability
Return on
equity
Net
profit/revenue
s 3.1% 3.8% 3.8% 3.7% 3.5%
2.25%
Return on
assets
Net
profit/Equity 20.1% 37.5% 39.9% 43.4% 47.7% 50.5%
Financial
leverage
EBIT / EBIT -
Interest 1.04 1.02 1.03 1.05 1.06 2.06
Asset
turnover
total assets /
total sales
*365 159.09 91.67 89.45 90.10 93.02
3.06
Earnings
per share
Net income -
pref div /
shares
outstanding 0.39 3.10 2.40 2.21 1.84
2.1
The return on assets of company has gone down to 20.1% in 2017 which is 20%
lower as compared to last five year data. The financial leverage of company has gone down
with the decrease in its debts portion. In addition to this CVF technologies have increase its
financial leverage which has helped it to increase the overall return on capital employed. The
assets turnover ratio of JB HI Fi has increased to 159 points in 2017 which is 60 points higher
as compared to last five year data (Grant, 2016). As compared to JB H-FI, CVF technologies
has performed well and deployed its funds to create value on its investment. The profitability
ratio of both companies shows that these both companies have positive business outlook
which eventually increases the overall outcomes of the business. It has also further noticed
that JB Hi-Fi Company has invested its capital in its research and development department
which eventually increases overall costing of the busienss. On the other hand, CVF
technologies has set up its business in small innovation which has good turnover in market
and reflecting the positive indicator for the increased business performance (Jordan, 2014).
Analysis the cash flow statement of JB HI-FI Company
The cash flow statement reflects the inflow and outflow of cash in the business
irrespective of the fact whether these transactions belongs to present year or not (Baños-
Caballero, García-Teruel, and Martínez-Solano, 2014).
JB HI FI LTD (JBH) Statement of CASH FLOW
Fiscal year ends in June. AUD in millions
except per share data.
2017-
06
2016-
06
2015-
06
2014-
06
2013-
06
Net cash provided by operating activities 191 185 180 41 156
Net cash used for investing activities -886 -52 -44 -38 -38
Net cash provided by (used for) financing
activities 716 -131 -130 -28 -91
Free cash flow 142 133 137 5 121
It has been observed that the JB HI-FI Company has been showing good amount of
return in its business which has increased to increased operating cash inflow. The operating
cash inflow in its business has increased to AUD $ 191 million which is AUD $ 45 million
higher as compared to last five year data (Mak, 2015). On the other hand, investing activities
shows that company has purchased new assets in its business which have increased its cash
outflow AUD $ 886. It has also shows that company has blocked more funds in its business
activities. The financial activities has shown the positive cash inflow of AUD $ 716 which
have increased due to the increased cash inflow from the long term debts.
The free cash flow of JB Hi-FI Company is AUD $ 142 million which is positive for
the business and help company to grow longer in the sluggish market (McKercher, Mak, and
Wong, 2014).
⊘ This is a preview!⊘
Do you want full access?
Subscribe today to unlock all pages.
Trusted by 1+ million students worldwide
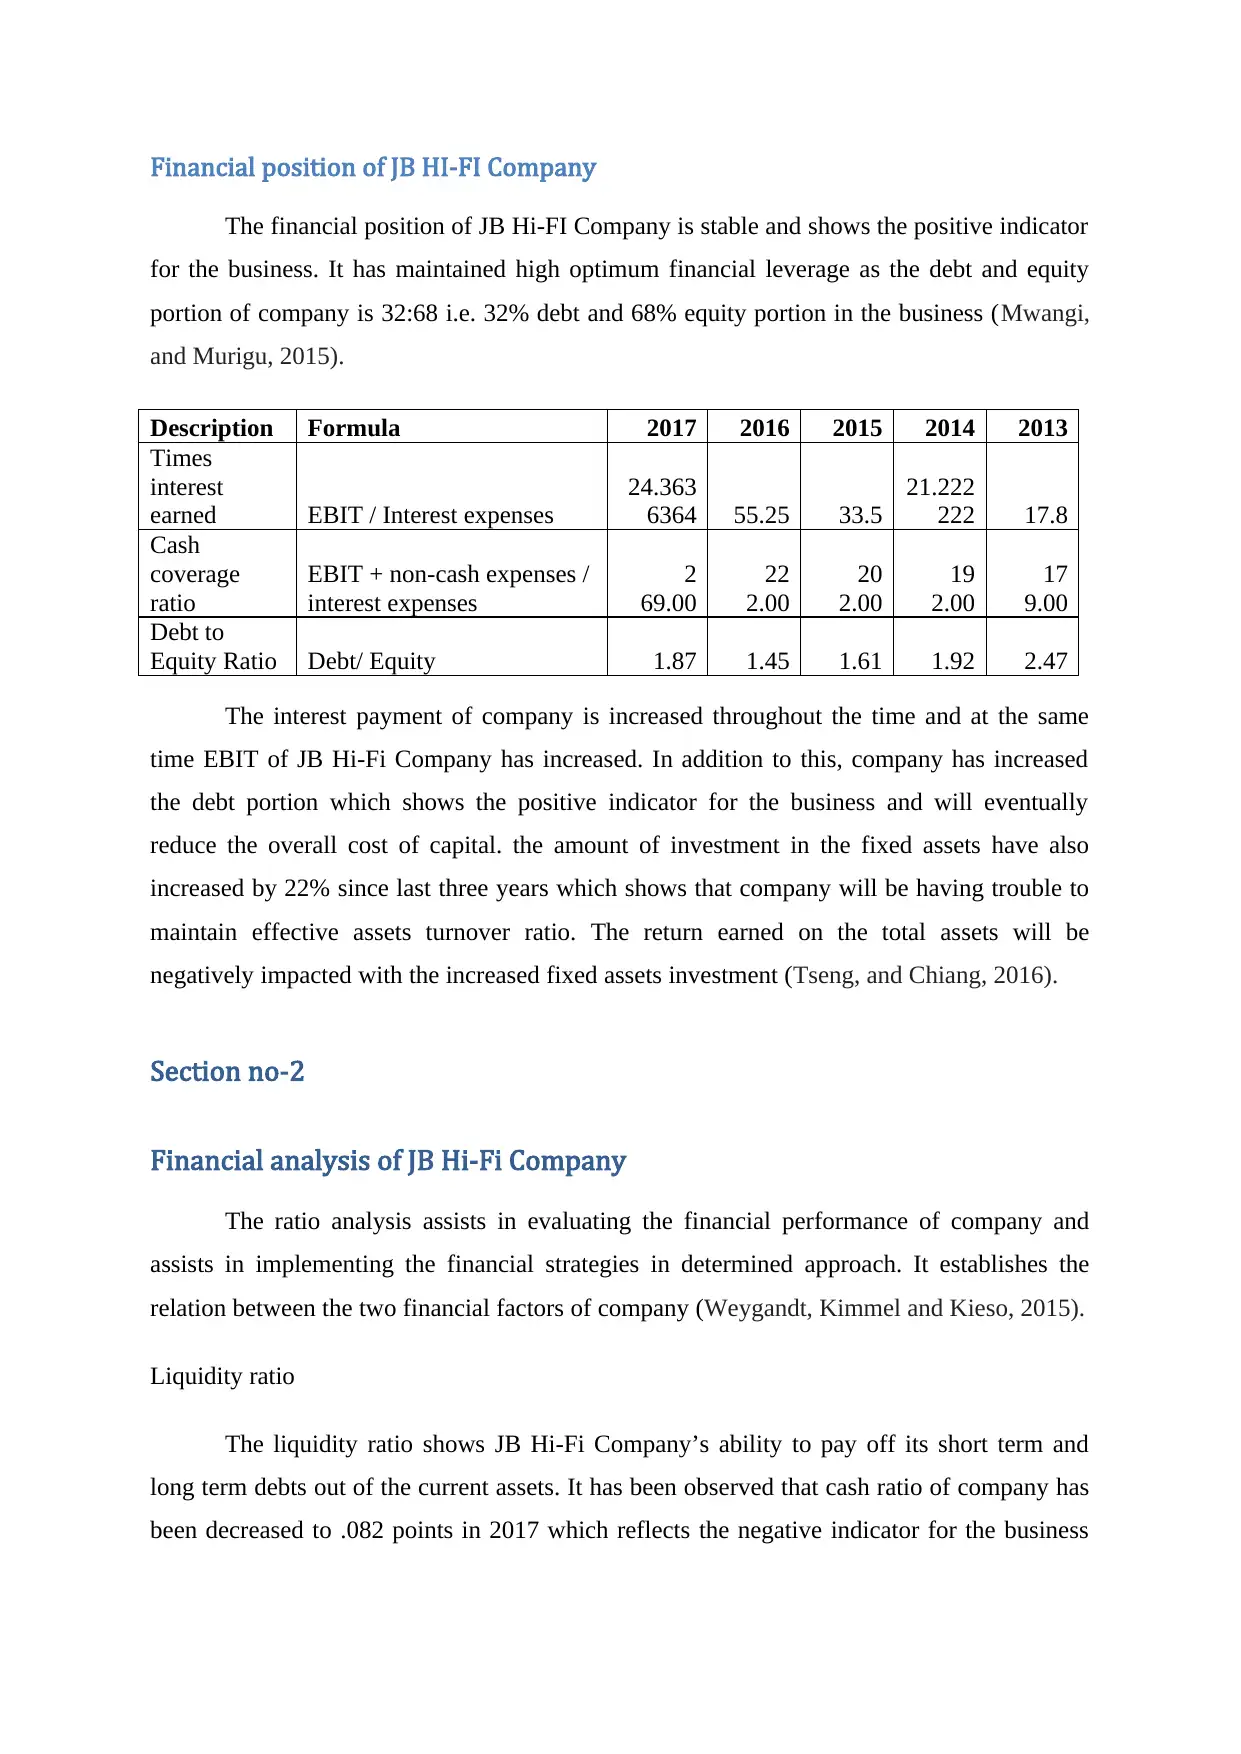
Financial position of JB HI-FI Company
The financial position of JB Hi-FI Company is stable and shows the positive indicator
for the business. It has maintained high optimum financial leverage as the debt and equity
portion of company is 32:68 i.e. 32% debt and 68% equity portion in the business (Mwangi,
and Murigu, 2015).
Description Formula 2017 2016 2015 2014 2013
Times
interest
earned EBIT / Interest expenses
24.363
6364 55.25 33.5
21.222
222 17.8
Cash
coverage
ratio
EBIT + non-cash expenses /
interest expenses
2
69.00
22
2.00
20
2.00
19
2.00
17
9.00
Debt to
Equity Ratio Debt/ Equity 1.87 1.45 1.61 1.92 2.47
The interest payment of company is increased throughout the time and at the same
time EBIT of JB Hi-Fi Company has increased. In addition to this, company has increased
the debt portion which shows the positive indicator for the business and will eventually
reduce the overall cost of capital. the amount of investment in the fixed assets have also
increased by 22% since last three years which shows that company will be having trouble to
maintain effective assets turnover ratio. The return earned on the total assets will be
negatively impacted with the increased fixed assets investment (Tseng, and Chiang, 2016).
Section no-2
Financial analysis of JB Hi-Fi Company
The ratio analysis assists in evaluating the financial performance of company and
assists in implementing the financial strategies in determined approach. It establishes the
relation between the two financial factors of company (Weygandt, Kimmel and Kieso, 2015).
Liquidity ratio
The liquidity ratio shows JB Hi-Fi Company’s ability to pay off its short term and
long term debts out of the current assets. It has been observed that cash ratio of company has
been decreased to .082 points in 2017 which reflects the negative indicator for the business
Paraphrase This Document
Need a fresh take? Get an instant paraphrase of this document with our AI Paraphraser
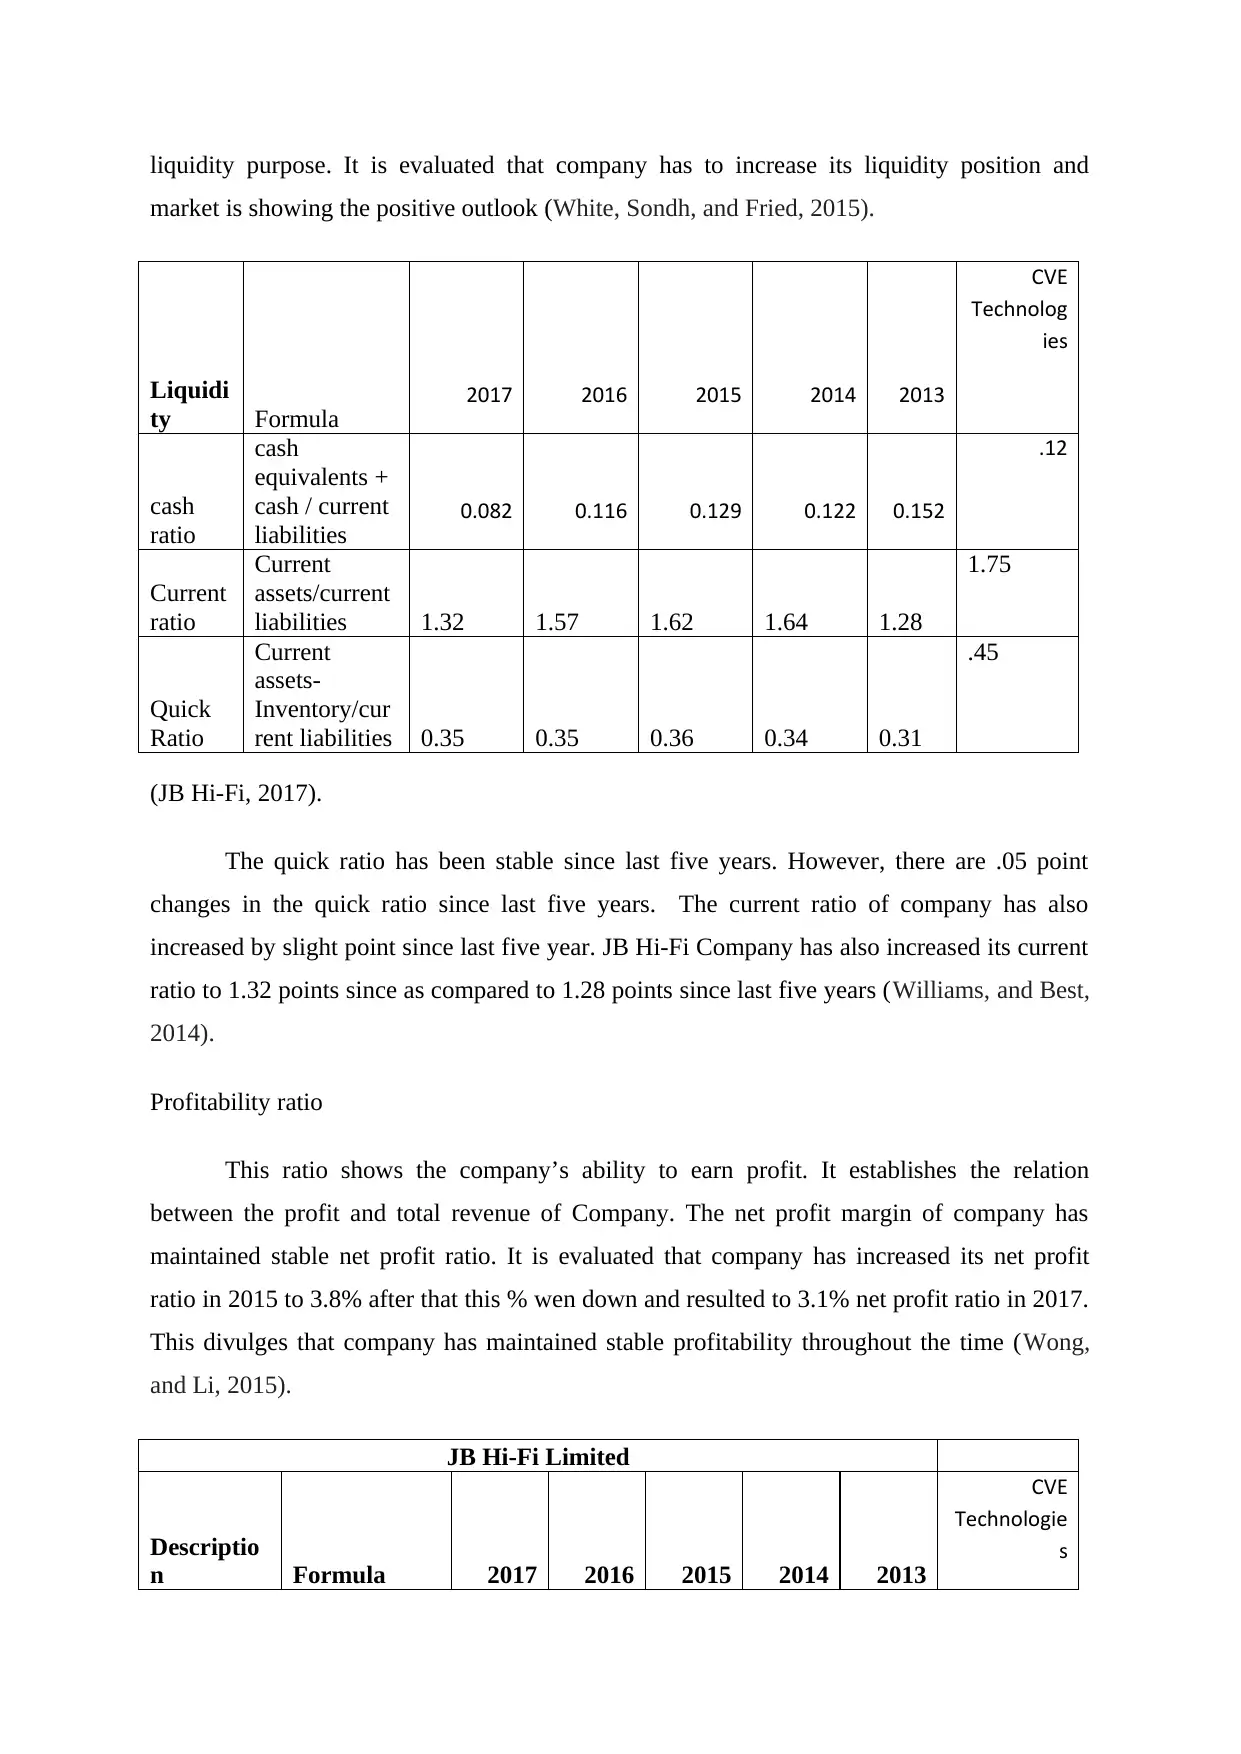
liquidity purpose. It is evaluated that company has to increase its liquidity position and
market is showing the positive outlook (White, Sondh, and Fried, 2015).
Liquidi
ty Formula 2017 2016 2015 2014 2013
CVE
Technolog
ies
cash
ratio
cash
equivalents +
cash / current
liabilities 0.082 0.116 0.129 0.122 0.152
.12
Current
ratio
Current
assets/current
liabilities 1.32 1.57 1.62 1.64 1.28
1.75
Quick
Ratio
Current
assets-
Inventory/cur
rent liabilities 0.35 0.35 0.36 0.34 0.31
.45
(JB Hi-Fi, 2017).
The quick ratio has been stable since last five years. However, there are .05 point
changes in the quick ratio since last five years. The current ratio of company has also
increased by slight point since last five year. JB Hi-Fi Company has also increased its current
ratio to 1.32 points since as compared to 1.28 points since last five years (Williams, and Best,
2014).
Profitability ratio
This ratio shows the company’s ability to earn profit. It establishes the relation
between the profit and total revenue of Company. The net profit margin of company has
maintained stable net profit ratio. It is evaluated that company has increased its net profit
ratio in 2015 to 3.8% after that this % wen down and resulted to 3.1% net profit ratio in 2017.
This divulges that company has maintained stable profitability throughout the time (Wong,
and Li, 2015).
JB Hi-Fi Limited
Descriptio
n Formula 2017 2016 2015 2014 2013
CVE
Technologie
s
Profitability
Return on
equity
Net
profit/revenue
s 3.1% 3.8% 3.8% 3.7% 3.5%
2.25%
Return on
assets
Net
profit/Equity 20.1% 37.5% 39.9% 43.4% 47.7% 50.5%
Financial
leverage
EBIT / EBIT -
Interest 1.04 1.02 1.03 1.05 1.06 2.06
Asset
turnover
total assets /
total sales
*365 159.09 91.67 89.45 90.10 93.02
3.06
Earnings
per share
Net income -
pref div /
shares
outstanding 0.39 3.10 2.40 2.21 1.84
2.1
(JB Hi-Fi, 2017).
The return on assets of company has also decreased to 20.1% in 2017 which is 20%
lower as compared to last five year data. It has reflected that company has reduced its earning
which has negatively impacted the revenue earning of company and return available for the
investors. The financial leverage of company has also managed to be stable which shows that
it has kept its financial leverage maintained. Company has low solvency risk which will help
Company to manage its business on sustainable basis even if it has high financial leverage
(Zhang, and Zhang, 2014).
Therefore, it could be inferred that company has good amount of investment but due to the
negative business outputs it has reduced its earning and resulted to high loss to its business.
The assets turnover has increased to 159 points in 2017 which is 60 points higher as
compared to last five year data.
The earning per share of company has gone down to .39 which is 70% lower as compared to
last five year data (Dagwell, Wines, and Lambert, 2015).
Efficiency ratio
The efficiency ratio of company shows how well company has managed its capital in
the business of organization. It is observed that the receivable turnover ratio of company has
increased to 29 points in 2017 which is 3 points higher as compared to last five year data.
Return on
equity
Net
profit/revenue
s 3.1% 3.8% 3.8% 3.7% 3.5%
2.25%
Return on
assets
Net
profit/Equity 20.1% 37.5% 39.9% 43.4% 47.7% 50.5%
Financial
leverage
EBIT / EBIT -
Interest 1.04 1.02 1.03 1.05 1.06 2.06
Asset
turnover
total assets /
total sales
*365 159.09 91.67 89.45 90.10 93.02
3.06
Earnings
per share
Net income -
pref div /
shares
outstanding 0.39 3.10 2.40 2.21 1.84
2.1
(JB Hi-Fi, 2017).
The return on assets of company has also decreased to 20.1% in 2017 which is 20%
lower as compared to last five year data. It has reflected that company has reduced its earning
which has negatively impacted the revenue earning of company and return available for the
investors. The financial leverage of company has also managed to be stable which shows that
it has kept its financial leverage maintained. Company has low solvency risk which will help
Company to manage its business on sustainable basis even if it has high financial leverage
(Zhang, and Zhang, 2014).
Therefore, it could be inferred that company has good amount of investment but due to the
negative business outputs it has reduced its earning and resulted to high loss to its business.
The assets turnover has increased to 159 points in 2017 which is 60 points higher as
compared to last five year data.
The earning per share of company has gone down to .39 which is 70% lower as compared to
last five year data (Dagwell, Wines, and Lambert, 2015).
Efficiency ratio
The efficiency ratio of company shows how well company has managed its capital in
the business of organization. It is observed that the receivable turnover ratio of company has
increased to 29 points in 2017 which is 3 points higher as compared to last five year data.
⊘ This is a preview!⊘
Do you want full access?
Subscribe today to unlock all pages.
Trusted by 1+ million students worldwide
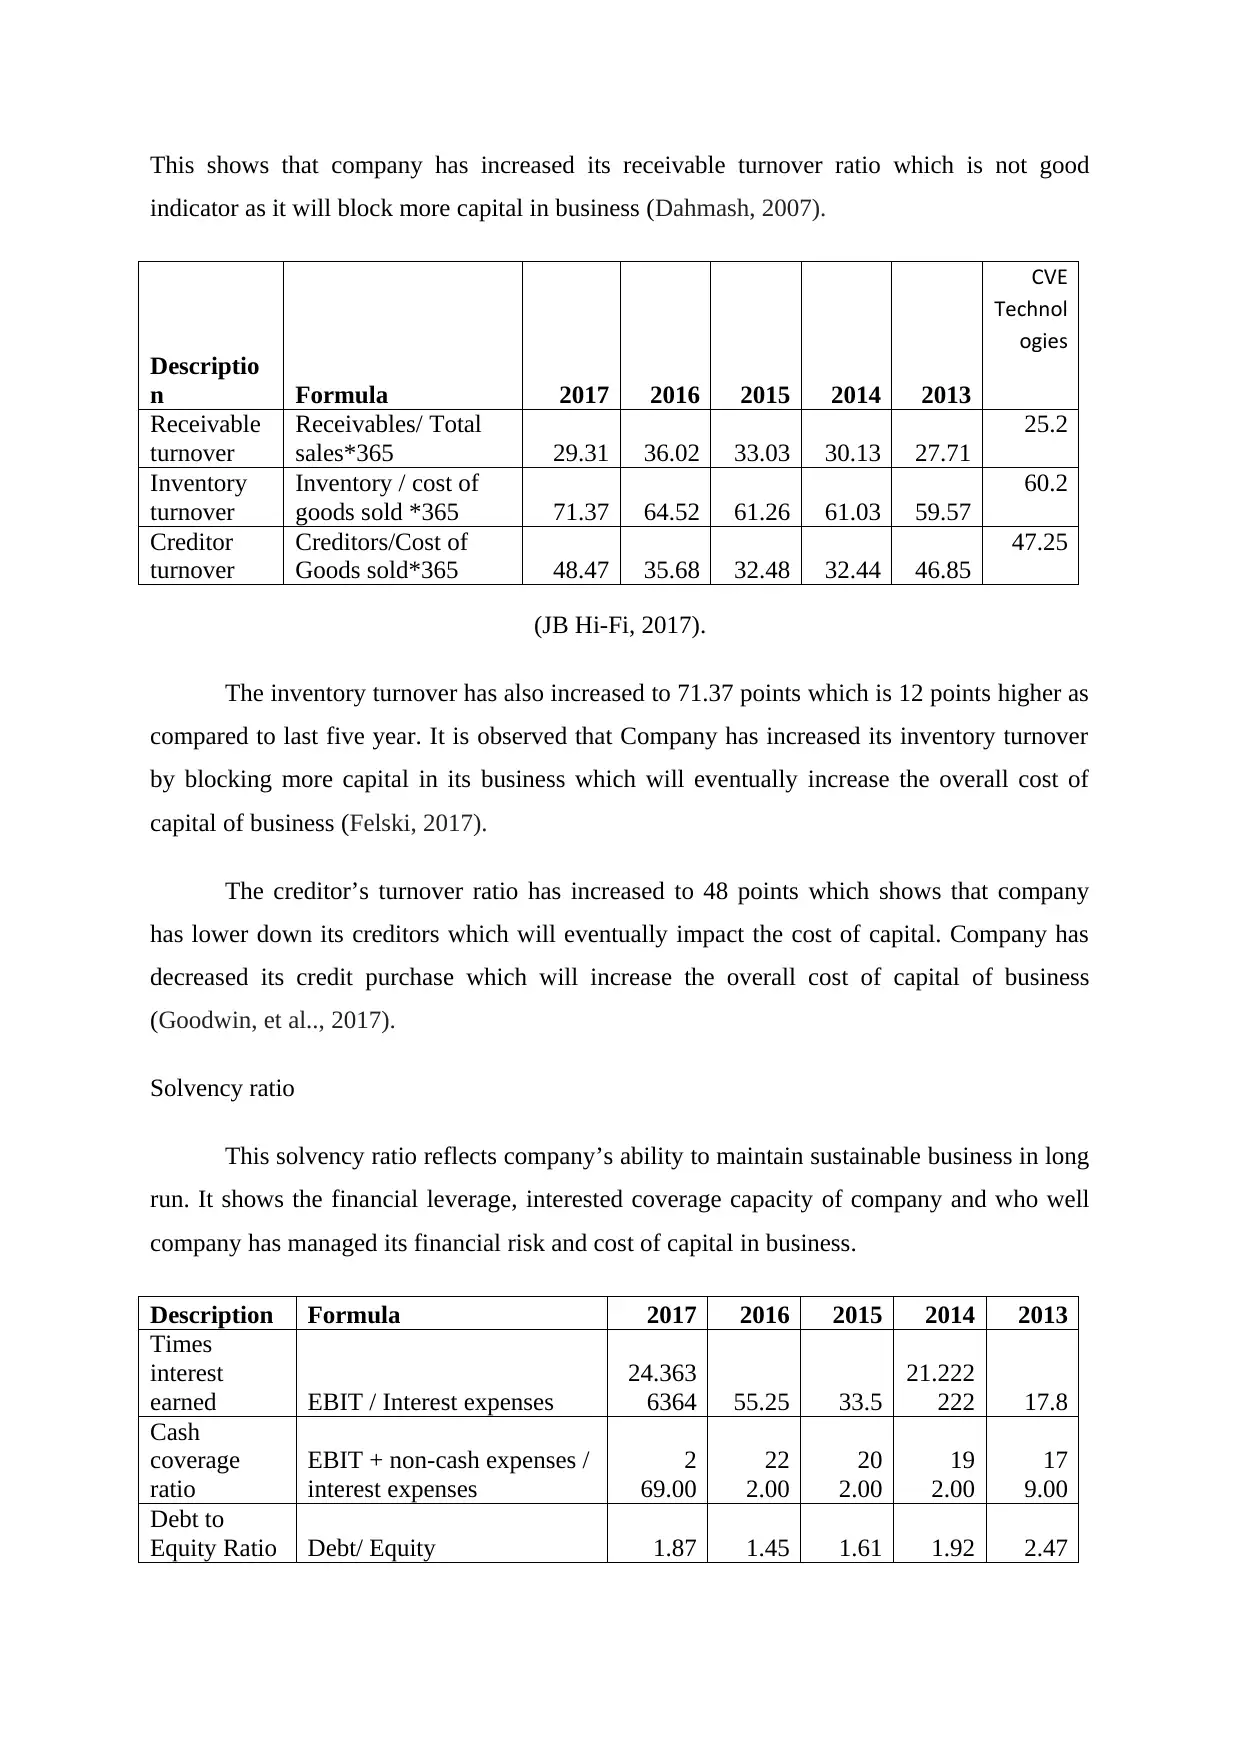
This shows that company has increased its receivable turnover ratio which is not good
indicator as it will block more capital in business (Dahmash, 2007).
Descriptio
n Formula 2017 2016 2015 2014 2013
CVE
Technol
ogies
Receivable
turnover
Receivables/ Total
sales*365 29.31 36.02 33.03 30.13 27.71
25.2
Inventory
turnover
Inventory / cost of
goods sold *365 71.37 64.52 61.26 61.03 59.57
60.2
Creditor
turnover
Creditors/Cost of
Goods sold*365 48.47 35.68 32.48 32.44 46.85
47.25
(JB Hi-Fi, 2017).
The inventory turnover has also increased to 71.37 points which is 12 points higher as
compared to last five year. It is observed that Company has increased its inventory turnover
by blocking more capital in its business which will eventually increase the overall cost of
capital of business (Felski, 2017).
The creditor’s turnover ratio has increased to 48 points which shows that company
has lower down its creditors which will eventually impact the cost of capital. Company has
decreased its credit purchase which will increase the overall cost of capital of business
(Goodwin, et al.., 2017).
Solvency ratio
This solvency ratio reflects company’s ability to maintain sustainable business in long
run. It shows the financial leverage, interested coverage capacity of company and who well
company has managed its financial risk and cost of capital in business.
Description Formula 2017 2016 2015 2014 2013
Times
interest
earned EBIT / Interest expenses
24.363
6364 55.25 33.5
21.222
222 17.8
Cash
coverage
ratio
EBIT + non-cash expenses /
interest expenses
2
69.00
22
2.00
20
2.00
19
2.00
17
9.00
Debt to
Equity Ratio Debt/ Equity 1.87 1.45 1.61 1.92 2.47
Paraphrase This Document
Need a fresh take? Get an instant paraphrase of this document with our AI Paraphraser
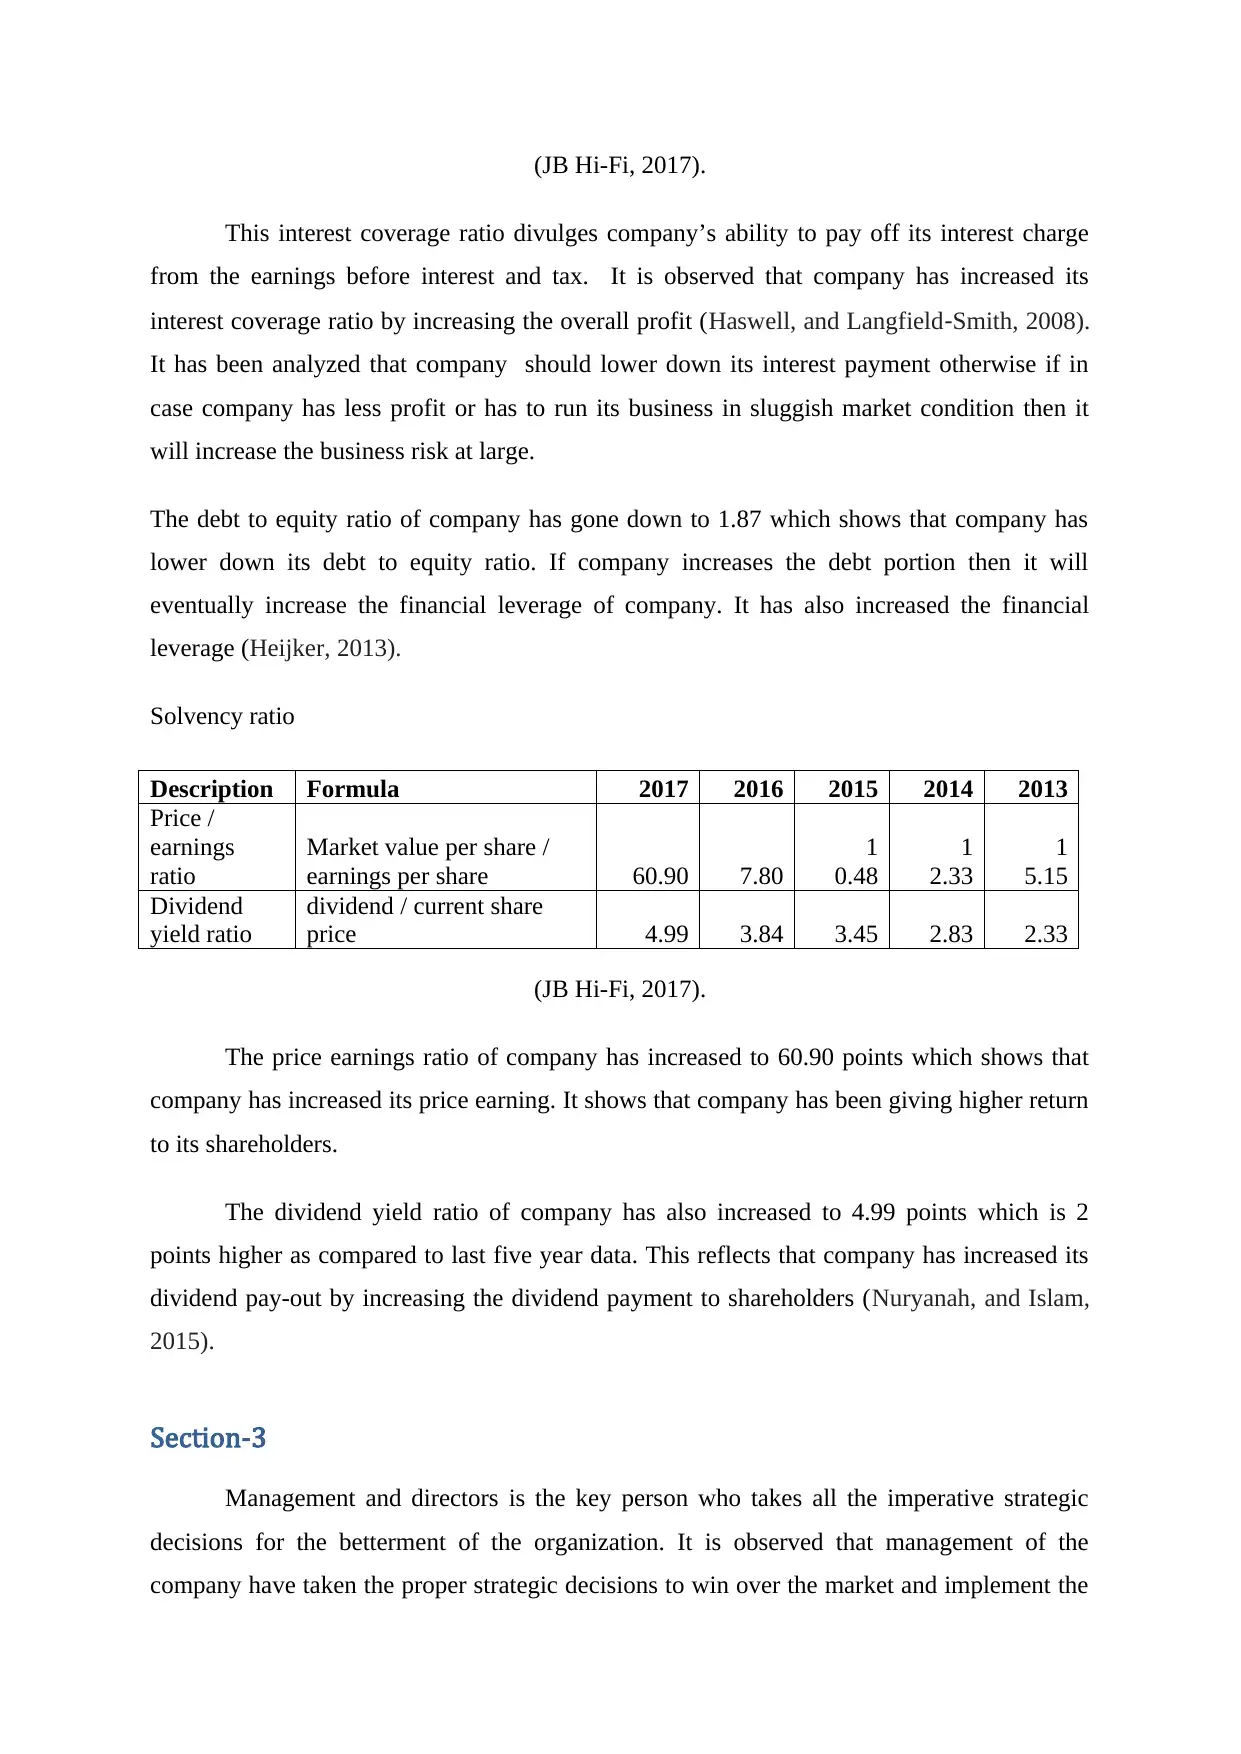
(JB Hi-Fi, 2017).
This interest coverage ratio divulges company’s ability to pay off its interest charge
from the earnings before interest and tax. It is observed that company has increased its
interest coverage ratio by increasing the overall profit (Haswell, and Langfield‐Smith, 2008).
It has been analyzed that company should lower down its interest payment otherwise if in
case company has less profit or has to run its business in sluggish market condition then it
will increase the business risk at large.
The debt to equity ratio of company has gone down to 1.87 which shows that company has
lower down its debt to equity ratio. If company increases the debt portion then it will
eventually increase the financial leverage of company. It has also increased the financial
leverage (Heijker, 2013).
Solvency ratio
Description Formula 2017 2016 2015 2014 2013
Price /
earnings
ratio
Market value per share /
earnings per share 60.90 7.80
1
0.48
1
2.33
1
5.15
Dividend
yield ratio
dividend / current share
price 4.99 3.84 3.45 2.83 2.33
(JB Hi-Fi, 2017).
The price earnings ratio of company has increased to 60.90 points which shows that
company has increased its price earning. It shows that company has been giving higher return
to its shareholders.
The dividend yield ratio of company has also increased to 4.99 points which is 2
points higher as compared to last five year data. This reflects that company has increased its
dividend pay-out by increasing the dividend payment to shareholders (Nuryanah, and Islam,
2015).
Section-3
Management and directors is the key person who takes all the imperative strategic
decisions for the betterment of the organization. It is observed that management of the
company have taken the proper strategic decisions to win over the market and implement the
proper strategic program. With the increasing the growth rate of the technologies market, the
management of the JB Hi-Fi Company has infused AUD $ 2 billion capital in its research and
development department. In addition to this, the cyber computing system and advance
implemented plan will also increase the overall outcomes and efficiency of the business. JB
Hi-Fi Company has also established the harmonization in its domestic and international
reporting frameworks which shows that company will be having no penalties on its business
operations. However, due to the non-effective internal control system, company has faced
inherent risks in its business (Robinson, Stomberg, and Towery, 2015). The board of
directors and Auditors analysis the financial reports of the company which helps in reduction
in these types of risks in effective manner. The management have followed the proper
autocratic and democratic leadership style to positively influence its employees. The
management of company by using the effective work program are implementing the strategic
work program such as setting strong innovation and development in its research and
development department, arrangement of training and development for its employees and
establish nexus between the organization development and employee’s growth.
Ethical standards
JB Hi-Fi Company aims to provide its customers with quality products and value for
the money. The company is committed to uphold human right, fair working condition and
environmental protection
Bribery and corruption
Company has followed the ethical policies that suppliers and employees will to undertake the
acts of bribery.
Labour right
All the employees will be free from any kind of domination and issue and proper legal rules
will be followed for the labour work process.
Child labour
There will be no child or person below 18 year working in the business operation of
Company.
⊘ This is a preview!⊘
Do you want full access?
Subscribe today to unlock all pages.
Trusted by 1+ million students worldwide
1 out of 16
Related Documents


Your All-in-One AI-Powered Toolkit for Academic Success.
+13062052269
info@desklib.com
Available 24*7 on WhatsApp / Email
![[object Object]](/_next/static/media/star-bottom.7253800d.svg)
Unlock your academic potential
Copyright © 2020–2026 A2Z Services. All Rights Reserved. Developed and managed by ZUCOL.