JB Hi Fi Investment Analysis Report - Finance 101, Semester 2
VerifiedAdded on 2022/10/12
|14
|2716
|12
Report
AI Summary
This report provides a comprehensive investment analysis of JB Hi Fi, evaluating its potential through financial projections, valuation, and industry overview. The analysis includes a business description, SWOT and PESTEL analyses to understand the company's competitive positioning and external factors. Financial projections are presented, along with a valuation using the Discounted Cash Flow (DCF) model to determine the theoretical share price. Sensitivity analysis is conducted to assess the impact of varying factors on the valuation. The report concludes that investment in JB Hi Fi could be a strategic move, with the current share price potentially undervalued, offering growth potential. The analysis covers revenue, expenses, and income statements for financial years 2017-2024, as well as balance sheet projections. The valuation uses EBITDA and free cash flow buildup to determine the fair value per share. The report concludes that the organization is at a discount and has growth potential. The report is contributed by a student to be published on Desklib.

Running head: EQUITY METHOD OF INVESTMENT
Equity Method of Investment
Name of the Student:
Name of the University:
Author’s Note
Equity Method of Investment
Name of the Student:
Name of the University:
Author’s Note
Paraphrase This Document
Need a fresh take? Get an instant paraphrase of this document with our AI Paraphraser
1
EQUITY METHOD OF INVESTMENT
Table of Contents
Introduction:....................................................................................................................................2
Investment Summary:......................................................................................................................2
Business Description:......................................................................................................................2
Industry overview and competitive positioning:.............................................................................3
Financial projections:.......................................................................................................................5
Valuation:........................................................................................................................................8
Sensitivity analysis:.......................................................................................................................10
Conclusion:....................................................................................................................................11
References and Bibliography:........................................................................................................13
2
EQUITY METHOD OF INVESTMENT
Introduction:
The overall assessment mainly aims in evaluating the investment scope in in JB Hi Fi,
which is evaluated by analyzing the financial projections, valuation and Industry overview
conditions of the company. The overall analysis is based on company performance and the future
projections of the current cash flows that is been conducted by the organization. Further analysis
has been created by projecting future incomes and cash flow conditions of the company. With
the utilization of the cash flow conditions, the DCF model is used for determining the theoretical
share price for the organization, which is compared for detecting whether the value is at market
premium or discount.
Investment Summary:
The financial analysis of JB Hi Fi directly helps in understanding the current progression
of the company, which is relatively used for projecting future incomes. The calculations
conducted in the projection have relatively helped in understanding the future profitability that
could be achieved by the company over a period of time. In addition, the industry overview and
competitive positioning of JB Hi Fi is also detected to be positive, which will contribute to the
future incomes of the organization. Thus, investments in JB Hi Fi would be attractive and
strategic move by an investor, as it would ensure high growth and future income. The DCF
model also indicated that the current share price value of the organization is at a discount, which
would help investors generate higher returns in the long run.
Business Description:
JB hi fi was established in 1974, where the equity floatation occurred in 2003, while it is
currently ranked as the seventh largest consumer electronics and home appliance retailer in the
⊘ This is a preview!⊘
Do you want full access?
Subscribe today to unlock all pages.
Trusted by 1+ million students worldwide
3
EQUITY METHOD OF INVESTMENT
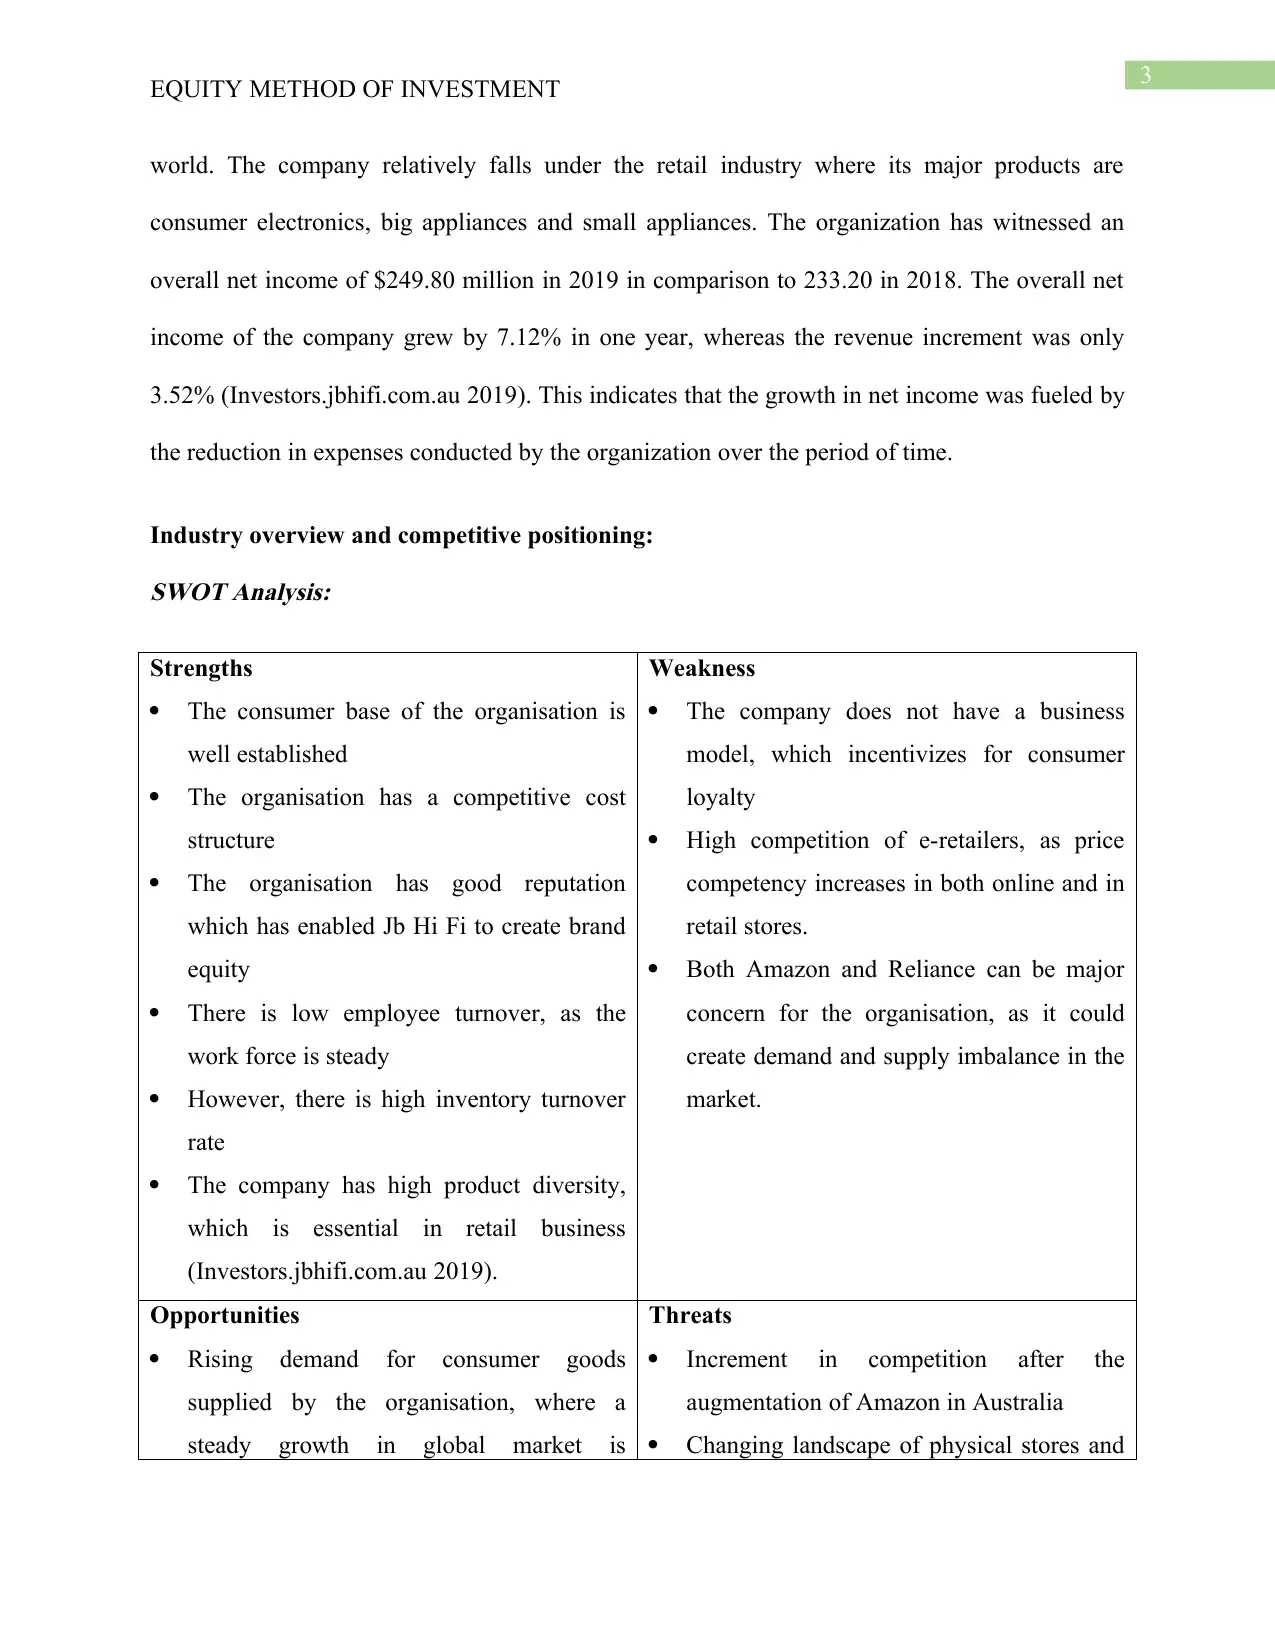
world. The company relatively falls under the retail industry where its major products are
consumer electronics, big appliances and small appliances. The organization has witnessed an
overall net income of $249.80 million in 2019 in comparison to 233.20 in 2018. The overall net
income of the company grew by 7.12% in one year, whereas the revenue increment was only
3.52% (Investors.jbhifi.com.au 2019). This indicates that the growth in net income was fueled by
the reduction in expenses conducted by the organization over the period of time.
Industry overview and competitive positioning:
SWOT Analysis:
Strengths
The consumer base of the organisation is
well established
The organisation has a competitive cost
structure
The organisation has good reputation
which has enabled Jb Hi Fi to create brand
equity
There is low employee turnover, as the
work force is steady
However, there is high inventory turnover
rate
The company has high product diversity,
which is essential in retail business
(Investors.jbhifi.com.au 2019).
Weakness
The company does not have a business
model, which incentivizes for consumer
loyalty
High competition of e-retailers, as price
competency increases in both online and in
retail stores.
Both Amazon and Reliance can be major
concern for the organisation, as it could
create demand and supply imbalance in the
market.
Opportunities
Rising demand for consumer goods
supplied by the organisation, where a
steady growth in global market is
Threats
Increment in competition after the
augmentation of Amazon in Australia
Changing landscape of physical stores and
EQUITY METHOD OF INVESTMENT
world. The company relatively falls under the retail industry where its major products are
consumer electronics, big appliances and small appliances. The organization has witnessed an
overall net income of $249.80 million in 2019 in comparison to 233.20 in 2018. The overall net
income of the company grew by 7.12% in one year, whereas the revenue increment was only
3.52% (Investors.jbhifi.com.au 2019). This indicates that the growth in net income was fueled by
the reduction in expenses conducted by the organization over the period of time.
Industry overview and competitive positioning:
SWOT Analysis:
Strengths
The consumer base of the organisation is
well established
The organisation has a competitive cost
structure
The organisation has good reputation
which has enabled Jb Hi Fi to create brand
equity
There is low employee turnover, as the
work force is steady
However, there is high inventory turnover
rate
The company has high product diversity,
which is essential in retail business
(Investors.jbhifi.com.au 2019).
Weakness
The company does not have a business
model, which incentivizes for consumer
loyalty
High competition of e-retailers, as price
competency increases in both online and in
retail stores.
Both Amazon and Reliance can be major
concern for the organisation, as it could
create demand and supply imbalance in the
market.
Opportunities
Rising demand for consumer goods
supplied by the organisation, where a
steady growth in global market is
Threats
Increment in competition after the
augmentation of Amazon in Australia
Changing landscape of physical stores and
Paraphrase This Document
Need a fresh take? Get an instant paraphrase of this document with our AI Paraphraser
4
EQUITY METHOD OF INVESTMENT
witnessed.
Increased number of innovative products
being developed and launched to increase
sales and demand for electronic goods.
Increasing operations in emerging markets
and capitalisation on technological
transformation for boosting sales and
growth in retail products
increasing demand for online stations.
Unfavourable political stance in form of
tariff, import tax and quotas
(Investors.jbhifi.com.au 2019)
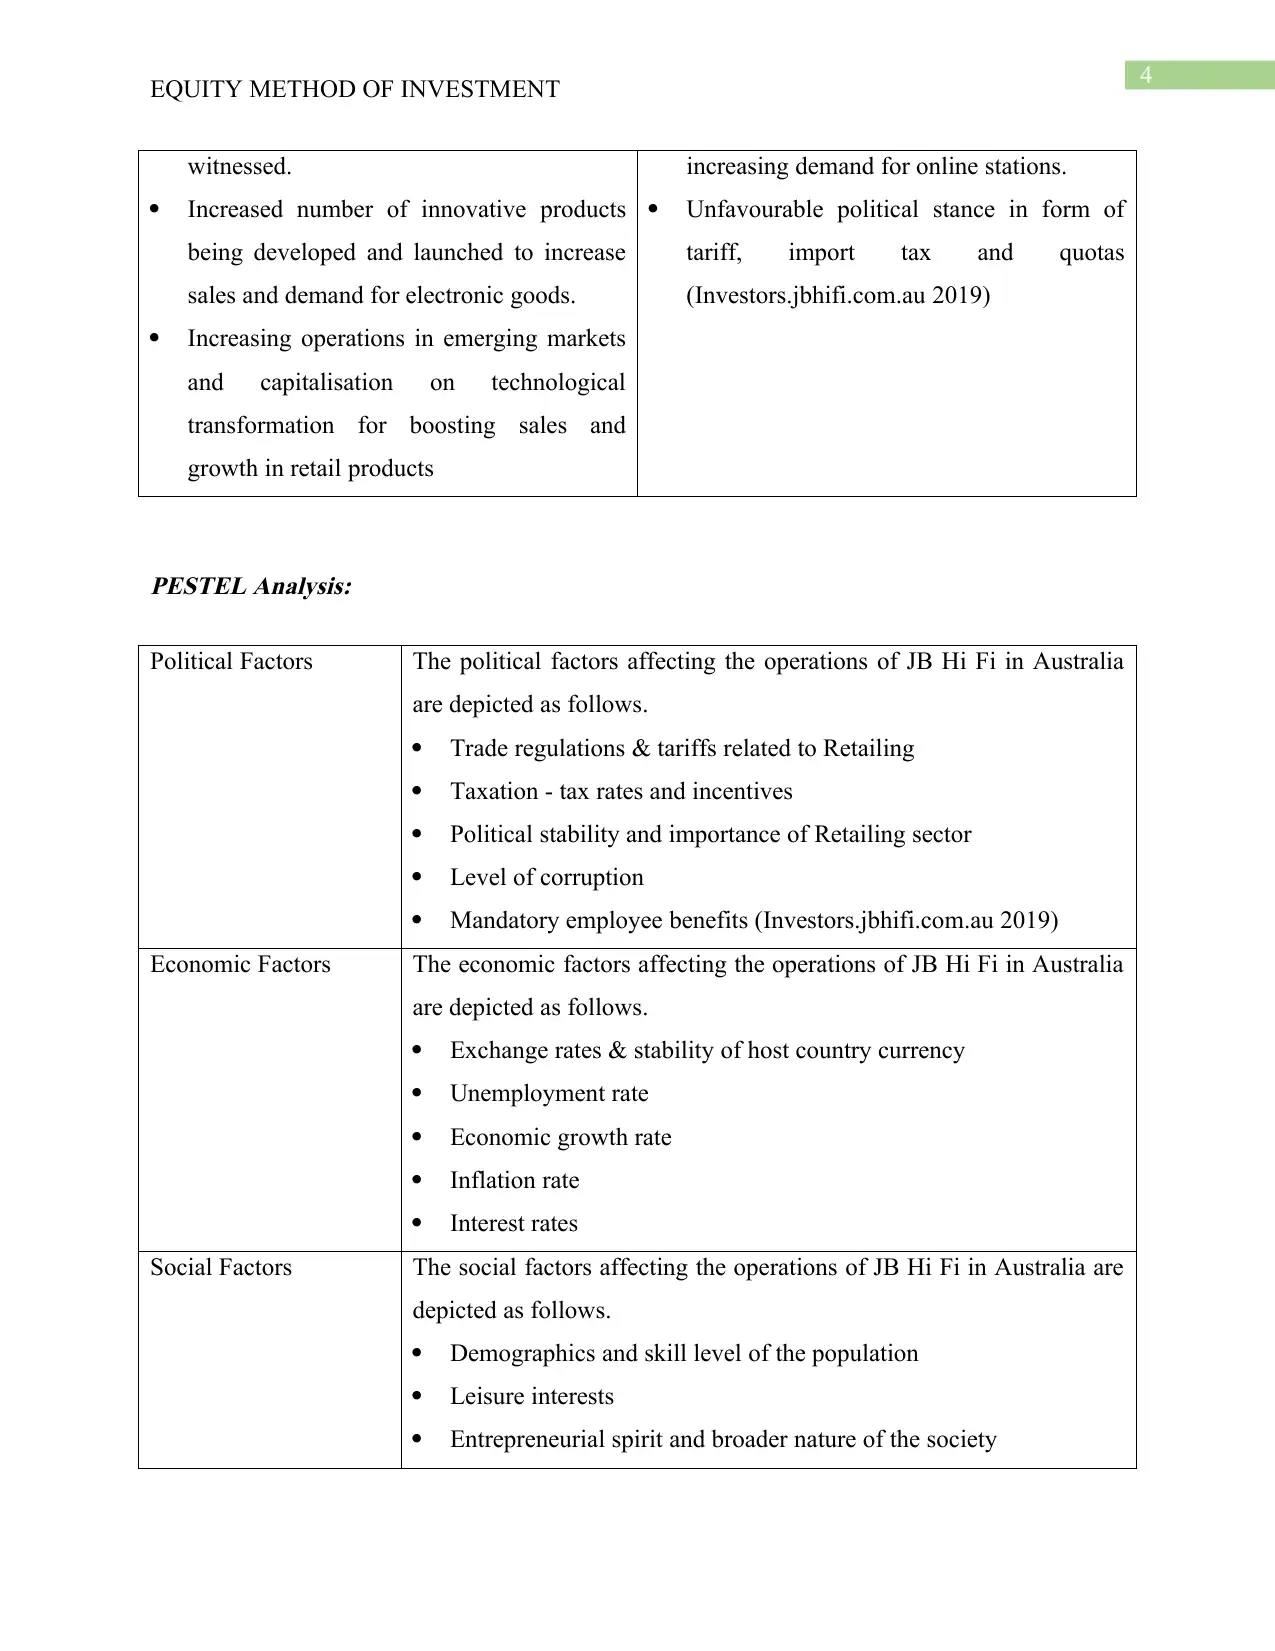
PESTEL Analysis:
Political Factors The political factors affecting the operations of JB Hi Fi in Australia
are depicted as follows.
Trade regulations & tariffs related to Retailing
Taxation - tax rates and incentives
Political stability and importance of Retailing sector
Level of corruption
Mandatory employee benefits (Investors.jbhifi.com.au 2019)
Economic Factors The economic factors affecting the operations of JB Hi Fi in Australia
are depicted as follows.
Exchange rates & stability of host country currency
Unemployment rate
Economic growth rate
Inflation rate
Interest rates
Social Factors The social factors affecting the operations of JB Hi Fi in Australia are
depicted as follows.
Demographics and skill level of the population
Leisure interests
Entrepreneurial spirit and broader nature of the society
EQUITY METHOD OF INVESTMENT
witnessed.
Increased number of innovative products
being developed and launched to increase
sales and demand for electronic goods.
Increasing operations in emerging markets
and capitalisation on technological
transformation for boosting sales and
growth in retail products
increasing demand for online stations.
Unfavourable political stance in form of
tariff, import tax and quotas
(Investors.jbhifi.com.au 2019)
PESTEL Analysis:
Political Factors The political factors affecting the operations of JB Hi Fi in Australia
are depicted as follows.
Trade regulations & tariffs related to Retailing
Taxation - tax rates and incentives
Political stability and importance of Retailing sector
Level of corruption
Mandatory employee benefits (Investors.jbhifi.com.au 2019)
Economic Factors The economic factors affecting the operations of JB Hi Fi in Australia
are depicted as follows.
Exchange rates & stability of host country currency
Unemployment rate
Economic growth rate
Inflation rate
Interest rates
Social Factors The social factors affecting the operations of JB Hi Fi in Australia are
depicted as follows.
Demographics and skill level of the population
Leisure interests
Entrepreneurial spirit and broader nature of the society
5
EQUITY METHOD OF INVESTMENT
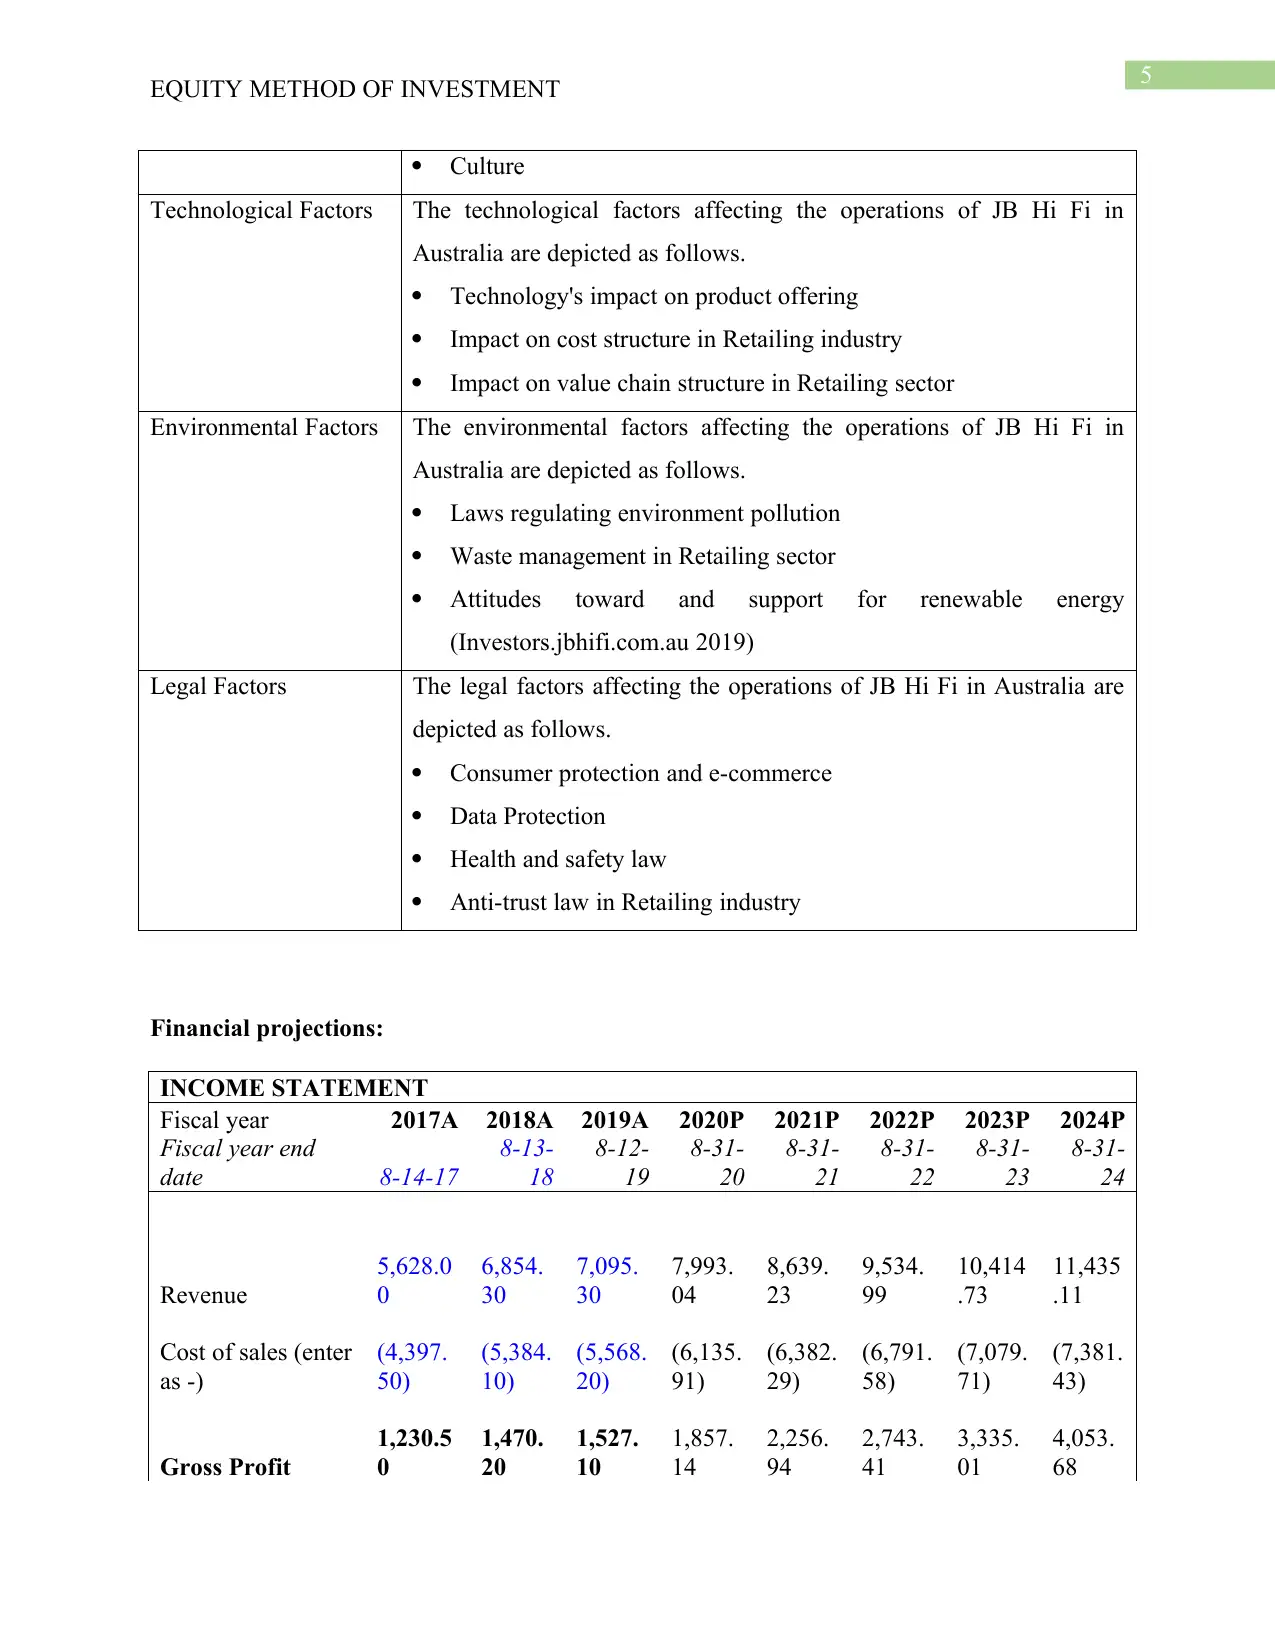
Culture
Technological Factors The technological factors affecting the operations of JB Hi Fi in
Australia are depicted as follows.
Technology's impact on product offering
Impact on cost structure in Retailing industry
Impact on value chain structure in Retailing sector
Environmental Factors The environmental factors affecting the operations of JB Hi Fi in
Australia are depicted as follows.
Laws regulating environment pollution
Waste management in Retailing sector
Attitudes toward and support for renewable energy
(Investors.jbhifi.com.au 2019)
Legal Factors The legal factors affecting the operations of JB Hi Fi in Australia are
depicted as follows.
Consumer protection and e-commerce
Data Protection
Health and safety law
Anti-trust law in Retailing industry
Financial projections:
INCOME STATEMENT
Fiscal year 2017A 2018A 2019A 2020P 2021P 2022P 2023P 2024P
Fiscal year end
date 8-14-17
8-13-
18
8-12-
19
8-31-
20
8-31-
21
8-31-
22
8-31-
23
8-31-
24
Revenue
5,628.0
0
6,854.
30
7,095.
30
7,993.
04
8,639.
23
9,534.
99
10,414
.73
11,435
.11
Cost of sales (enter
as -)
(4,397.
50)
(5,384.
10)
(5,568.
20)
(6,135.
91)
(6,382.
29)
(6,791.
58)
(7,079.
71)
(7,381.
43)
Gross Profit
1,230.5
0
1,470.
20
1,527.
10
1,857.
14
2,256.
94
2,743.
41
3,335.
01
4,053.
68
EQUITY METHOD OF INVESTMENT
Culture
Technological Factors The technological factors affecting the operations of JB Hi Fi in
Australia are depicted as follows.
Technology's impact on product offering
Impact on cost structure in Retailing industry
Impact on value chain structure in Retailing sector
Environmental Factors The environmental factors affecting the operations of JB Hi Fi in
Australia are depicted as follows.
Laws regulating environment pollution
Waste management in Retailing sector
Attitudes toward and support for renewable energy
(Investors.jbhifi.com.au 2019)
Legal Factors The legal factors affecting the operations of JB Hi Fi in Australia are
depicted as follows.
Consumer protection and e-commerce
Data Protection
Health and safety law
Anti-trust law in Retailing industry
Financial projections:
INCOME STATEMENT
Fiscal year 2017A 2018A 2019A 2020P 2021P 2022P 2023P 2024P
Fiscal year end
date 8-14-17
8-13-
18
8-12-
19
8-31-
20
8-31-
21
8-31-
22
8-31-
23
8-31-
24
Revenue
5,628.0
0
6,854.
30
7,095.
30
7,993.
04
8,639.
23
9,534.
99
10,414
.73
11,435
.11
Cost of sales (enter
as -)
(4,397.
50)
(5,384.
10)
(5,568.
20)
(6,135.
91)
(6,382.
29)
(6,791.
58)
(7,079.
71)
(7,381.
43)
Gross Profit
1,230.5
0
1,470.
20
1,527.
10
1,857.
14
2,256.
94
2,743.
41
3,335.
01
4,053.
68
⊘ This is a preview!⊘
Do you want full access?
Subscribe today to unlock all pages.
Trusted by 1+ million students worldwide
6
EQUITY METHOD OF INVESTMENT
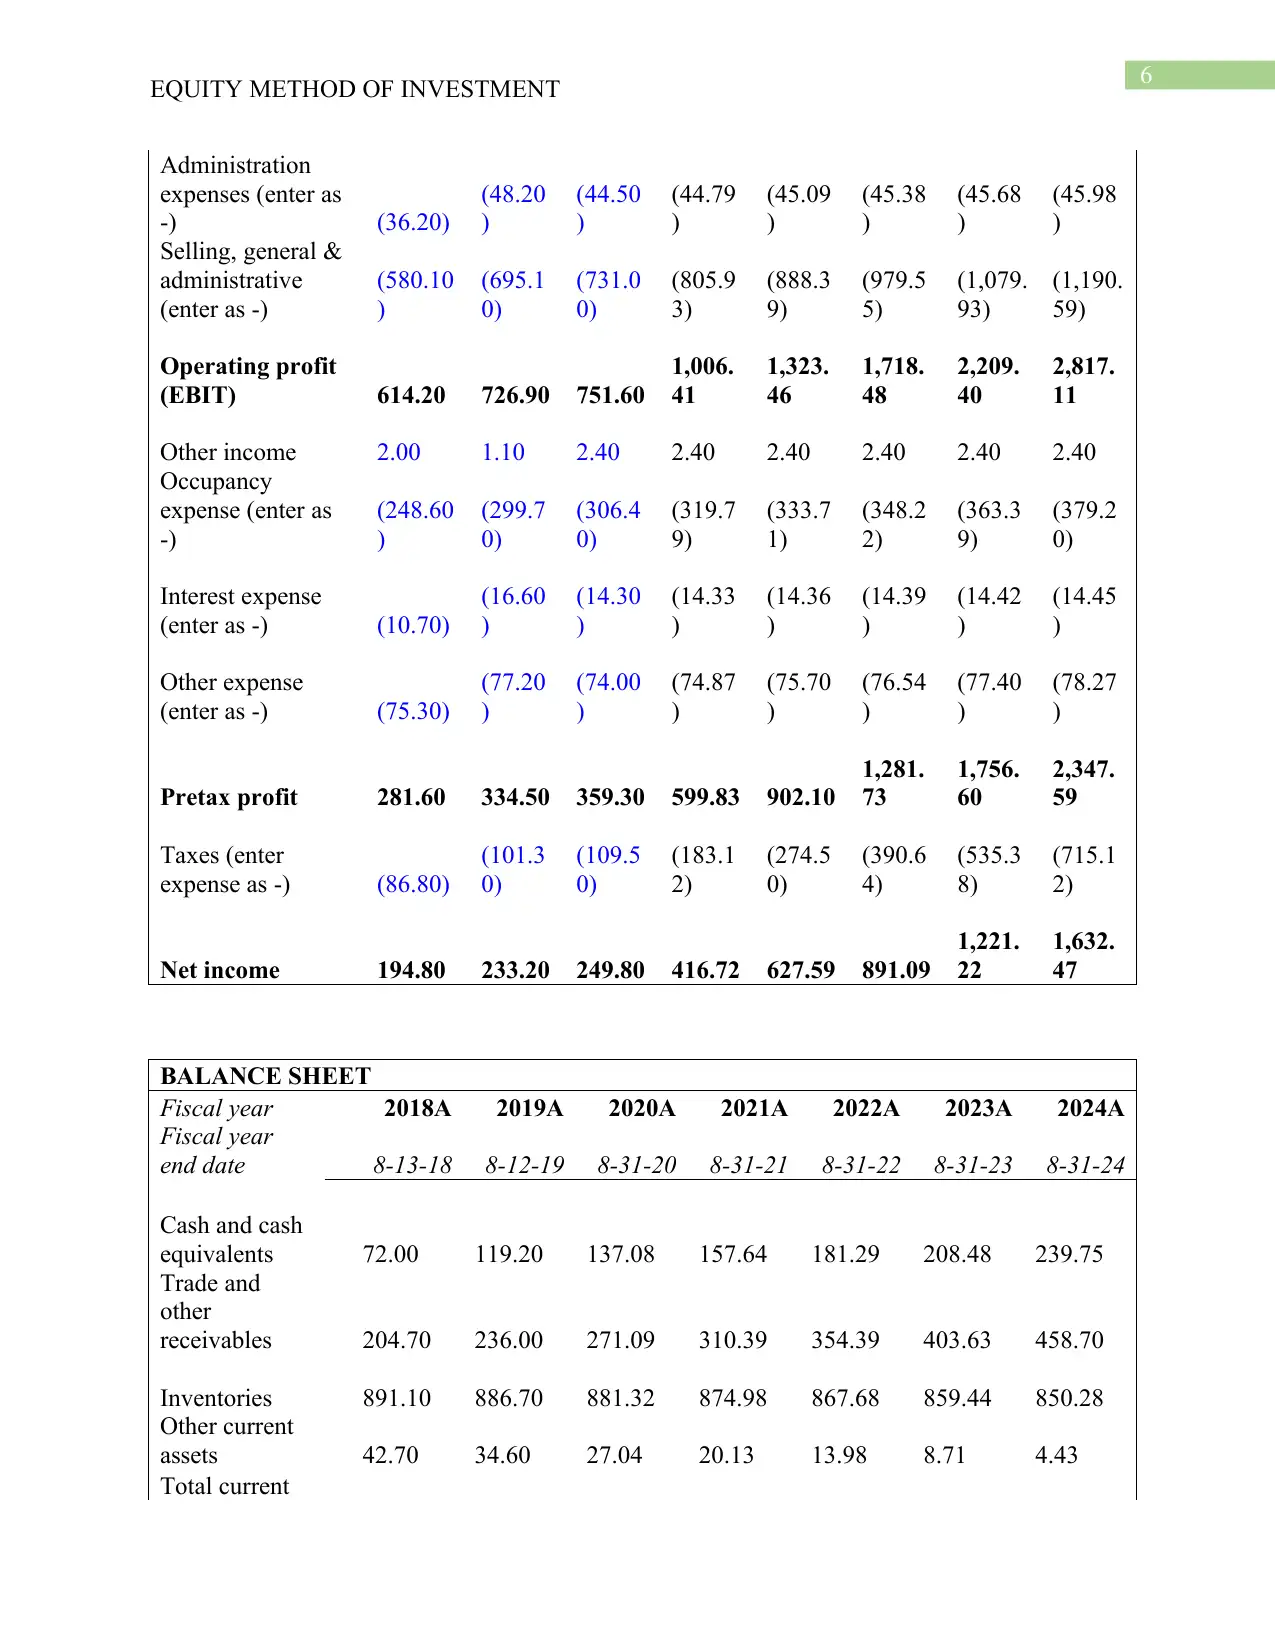
Administration
expenses (enter as
-) (36.20)
(48.20
)
(44.50
)
(44.79
)
(45.09
)
(45.38
)
(45.68
)
(45.98
)
Selling, general &
administrative
(enter as -)
(580.10
)
(695.1
0)
(731.0
0)
(805.9
3)
(888.3
9)
(979.5
5)
(1,079.
93)
(1,190.
59)
Operating profit
(EBIT) 614.20 726.90 751.60
1,006.
41
1,323.
46
1,718.
48
2,209.
40
2,817.
11
Other income 2.00 1.10 2.40 2.40 2.40 2.40 2.40 2.40
Occupancy
expense (enter as
-)
(248.60
)
(299.7
0)
(306.4
0)
(319.7
9)
(333.7
1)
(348.2
2)
(363.3
9)
(379.2
0)
Interest expense
(enter as -) (10.70)
(16.60
)
(14.30
)
(14.33
)
(14.36
)
(14.39
)
(14.42
)
(14.45
)
Other expense
(enter as -) (75.30)
(77.20
)
(74.00
)
(74.87
)
(75.70
)
(76.54
)
(77.40
)
(78.27
)
Pretax profit 281.60 334.50 359.30 599.83 902.10
1,281.
73
1,756.
60
2,347.
59
Taxes (enter
expense as -) (86.80)
(101.3
0)
(109.5
0)
(183.1
2)
(274.5
0)
(390.6
4)
(535.3
8)
(715.1
2)
Net income 194.80 233.20 249.80 416.72 627.59 891.09
1,221.
22
1,632.
47
BALANCE SHEET
Fiscal year 2018A 2019A 2020A 2021A 2022A 2023A 2024A
Fiscal year
end date 8-13-18 8-12-19 8-31-20 8-31-21 8-31-22 8-31-23 8-31-24
Cash and cash
equivalents 72.00 119.20 137.08 157.64 181.29 208.48 239.75
Trade and
other
receivables 204.70 236.00 271.09 310.39 354.39 403.63 458.70
Inventories 891.10 886.70 881.32 874.98 867.68 859.44 850.28
Other current
assets 42.70 34.60 27.04 20.13 13.98 8.71 4.43
Total current
EQUITY METHOD OF INVESTMENT
Administration
expenses (enter as
-) (36.20)
(48.20
)
(44.50
)
(44.79
)
(45.09
)
(45.38
)
(45.68
)
(45.98
)
Selling, general &
administrative
(enter as -)
(580.10
)
(695.1
0)
(731.0
0)
(805.9
3)
(888.3
9)
(979.5
5)
(1,079.
93)
(1,190.
59)
Operating profit
(EBIT) 614.20 726.90 751.60
1,006.
41
1,323.
46
1,718.
48
2,209.
40
2,817.
11
Other income 2.00 1.10 2.40 2.40 2.40 2.40 2.40 2.40
Occupancy
expense (enter as
-)
(248.60
)
(299.7
0)
(306.4
0)
(319.7
9)
(333.7
1)
(348.2
2)
(363.3
9)
(379.2
0)
Interest expense
(enter as -) (10.70)
(16.60
)
(14.30
)
(14.33
)
(14.36
)
(14.39
)
(14.42
)
(14.45
)
Other expense
(enter as -) (75.30)
(77.20
)
(74.00
)
(74.87
)
(75.70
)
(76.54
)
(77.40
)
(78.27
)
Pretax profit 281.60 334.50 359.30 599.83 902.10
1,281.
73
1,756.
60
2,347.
59
Taxes (enter
expense as -) (86.80)
(101.3
0)
(109.5
0)
(183.1
2)
(274.5
0)
(390.6
4)
(535.3
8)
(715.1
2)
Net income 194.80 233.20 249.80 416.72 627.59 891.09
1,221.
22
1,632.
47
BALANCE SHEET
Fiscal year 2018A 2019A 2020A 2021A 2022A 2023A 2024A
Fiscal year
end date 8-13-18 8-12-19 8-31-20 8-31-21 8-31-22 8-31-23 8-31-24
Cash and cash
equivalents 72.00 119.20 137.08 157.64 181.29 208.48 239.75
Trade and
other
receivables 204.70 236.00 271.09 310.39 354.39 403.63 458.70
Inventories 891.10 886.70 881.32 874.98 867.68 859.44 850.28
Other current
assets 42.70 34.60 27.04 20.13 13.98 8.71 4.43
Total current
Paraphrase This Document
Need a fresh take? Get an instant paraphrase of this document with our AI Paraphraser
7
EQUITY METHOD OF INVESTMENT
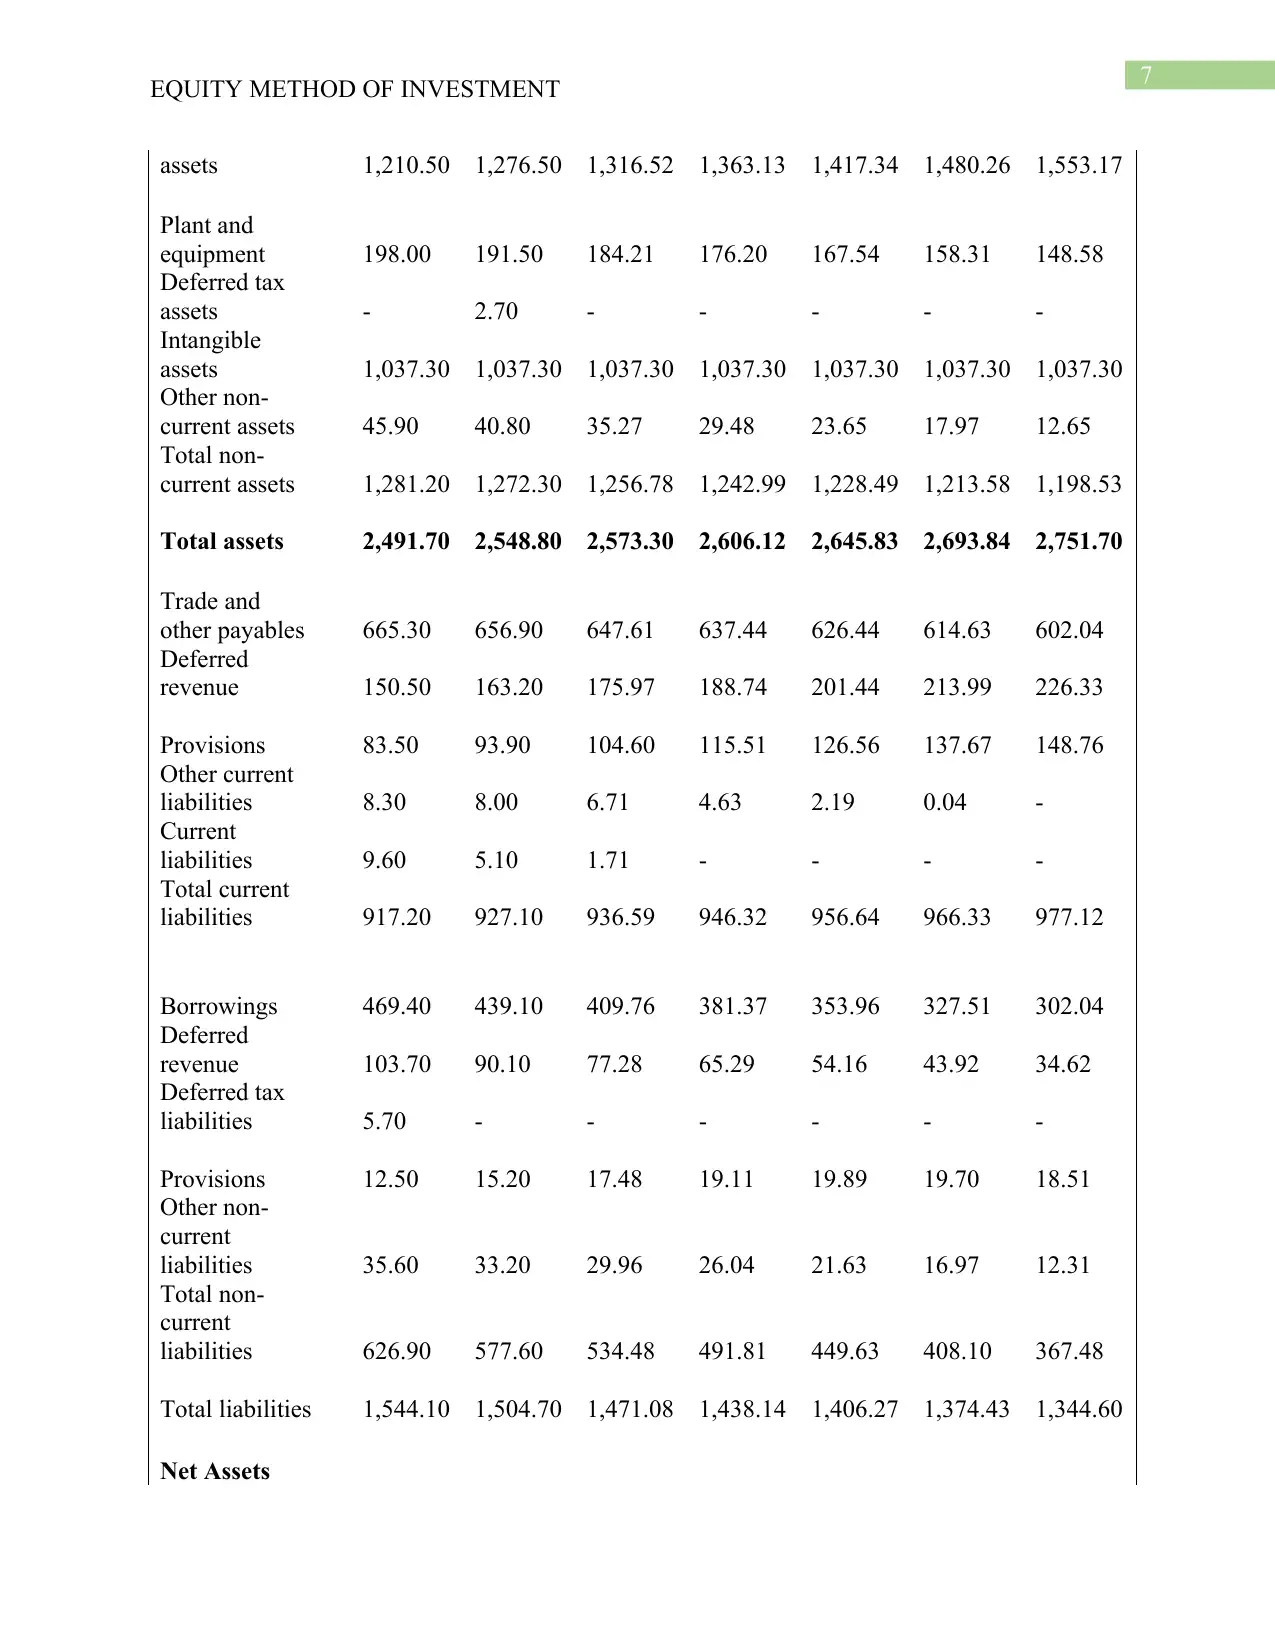
assets 1,210.50 1,276.50 1,316.52 1,363.13 1,417.34 1,480.26 1,553.17
Plant and
equipment 198.00 191.50 184.21 176.20 167.54 158.31 148.58
Deferred tax
assets - 2.70 - - - - -
Intangible
assets 1,037.30 1,037.30 1,037.30 1,037.30 1,037.30 1,037.30 1,037.30
Other non-
current assets 45.90 40.80 35.27 29.48 23.65 17.97 12.65
Total non-
current assets 1,281.20 1,272.30 1,256.78 1,242.99 1,228.49 1,213.58 1,198.53
Total assets 2,491.70 2,548.80 2,573.30 2,606.12 2,645.83 2,693.84 2,751.70
Trade and
other payables 665.30 656.90 647.61 637.44 626.44 614.63 602.04
Deferred
revenue 150.50 163.20 175.97 188.74 201.44 213.99 226.33
Provisions 83.50 93.90 104.60 115.51 126.56 137.67 148.76
Other current
liabilities 8.30 8.00 6.71 4.63 2.19 0.04 -
Current
liabilities 9.60 5.10 1.71 - - - -
Total current
liabilities 917.20 927.10 936.59 946.32 956.64 966.33 977.12
Borrowings 469.40 439.10 409.76 381.37 353.96 327.51 302.04
Deferred
revenue 103.70 90.10 77.28 65.29 54.16 43.92 34.62
Deferred tax
liabilities 5.70 - - - - - -
Provisions 12.50 15.20 17.48 19.11 19.89 19.70 18.51
Other non-
current
liabilities 35.60 33.20 29.96 26.04 21.63 16.97 12.31
Total non-
current
liabilities 626.90 577.60 534.48 491.81 449.63 408.10 367.48
Total liabilities 1,544.10 1,504.70 1,471.08 1,438.14 1,406.27 1,374.43 1,344.60
Net Assets
EQUITY METHOD OF INVESTMENT
assets 1,210.50 1,276.50 1,316.52 1,363.13 1,417.34 1,480.26 1,553.17
Plant and
equipment 198.00 191.50 184.21 176.20 167.54 158.31 148.58
Deferred tax
assets - 2.70 - - - - -
Intangible
assets 1,037.30 1,037.30 1,037.30 1,037.30 1,037.30 1,037.30 1,037.30
Other non-
current assets 45.90 40.80 35.27 29.48 23.65 17.97 12.65
Total non-
current assets 1,281.20 1,272.30 1,256.78 1,242.99 1,228.49 1,213.58 1,198.53
Total assets 2,491.70 2,548.80 2,573.30 2,606.12 2,645.83 2,693.84 2,751.70
Trade and
other payables 665.30 656.90 647.61 637.44 626.44 614.63 602.04
Deferred
revenue 150.50 163.20 175.97 188.74 201.44 213.99 226.33
Provisions 83.50 93.90 104.60 115.51 126.56 137.67 148.76
Other current
liabilities 8.30 8.00 6.71 4.63 2.19 0.04 -
Current
liabilities 9.60 5.10 1.71 - - - -
Total current
liabilities 917.20 927.10 936.59 946.32 956.64 966.33 977.12
Borrowings 469.40 439.10 409.76 381.37 353.96 327.51 302.04
Deferred
revenue 103.70 90.10 77.28 65.29 54.16 43.92 34.62
Deferred tax
liabilities 5.70 - - - - - -
Provisions 12.50 15.20 17.48 19.11 19.89 19.70 18.51
Other non-
current
liabilities 35.60 33.20 29.96 26.04 21.63 16.97 12.31
Total non-
current
liabilities 626.90 577.60 534.48 491.81 449.63 408.10 367.48
Total liabilities 1,544.10 1,504.70 1,471.08 1,438.14 1,406.27 1,374.43 1,344.60
Net Assets
8
EQUITY METHOD OF INVESTMENT
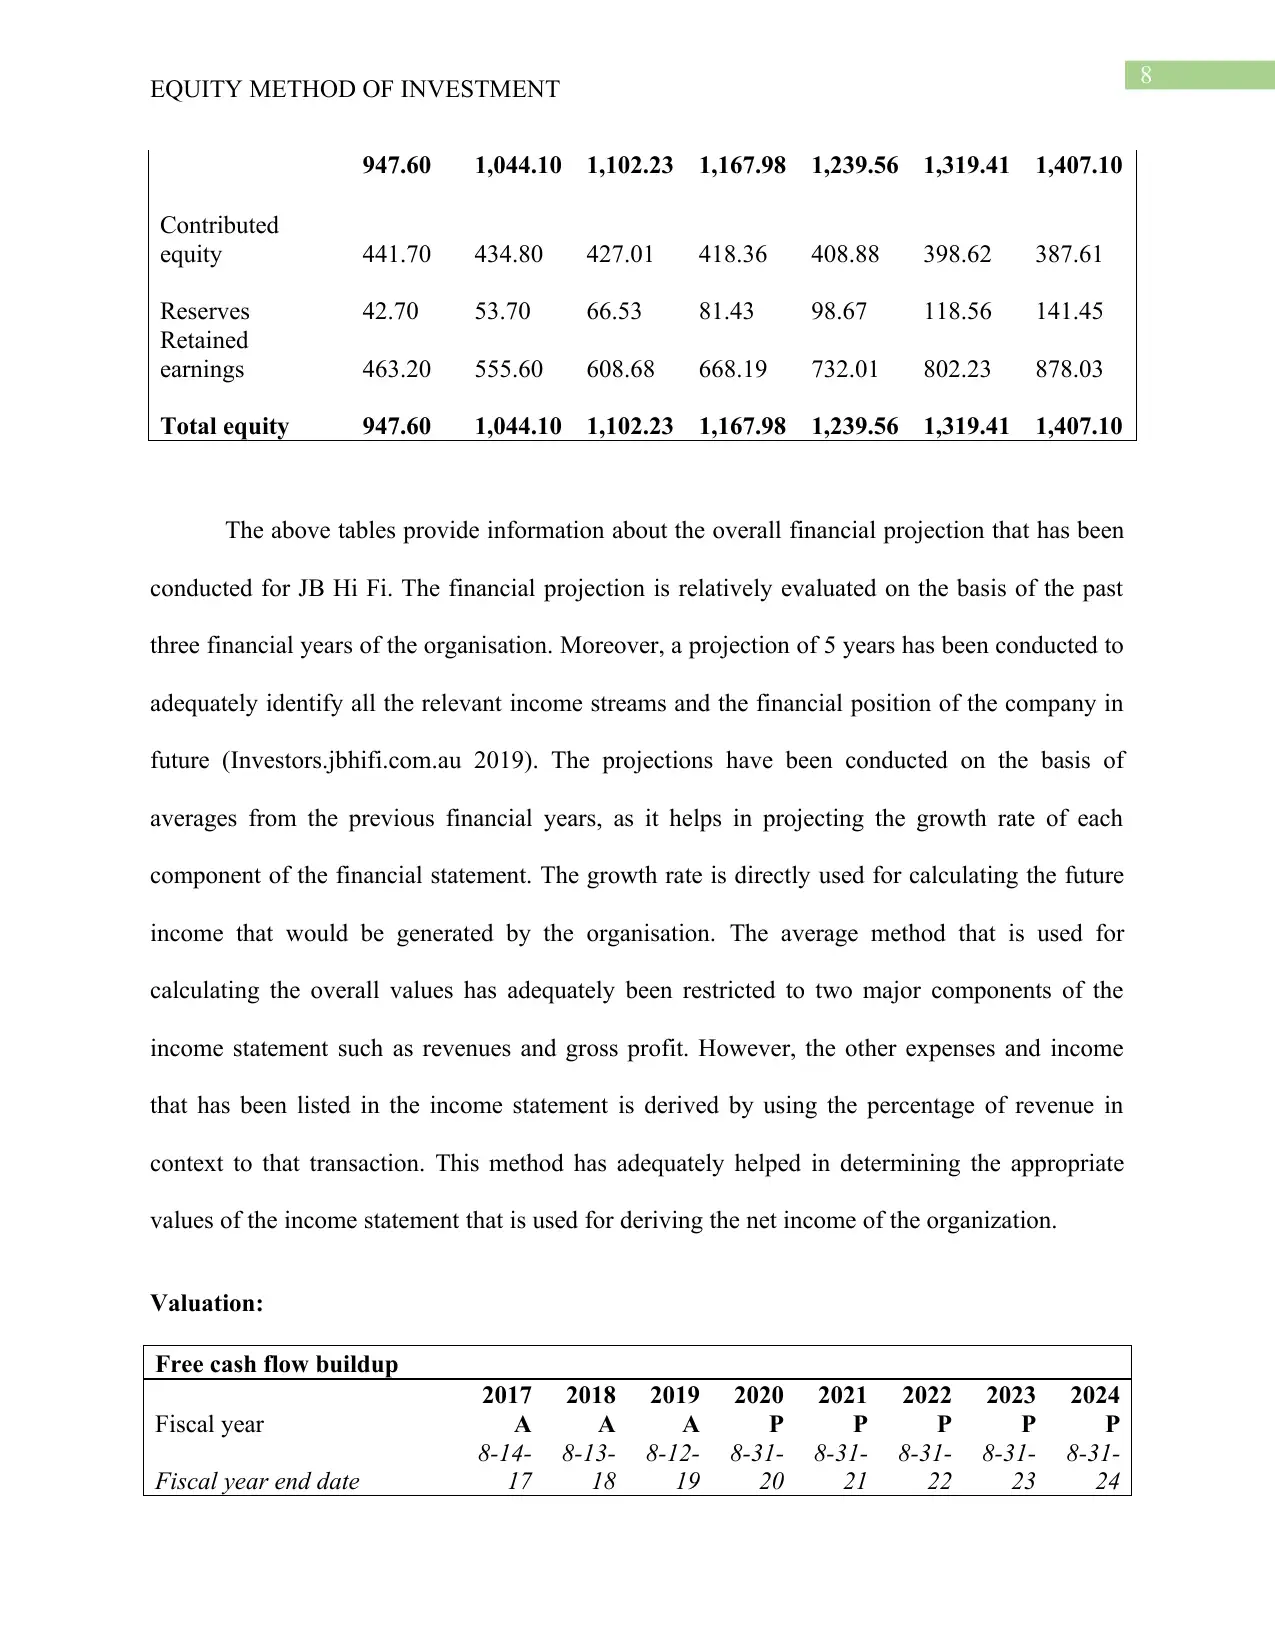
947.60 1,044.10 1,102.23 1,167.98 1,239.56 1,319.41 1,407.10
Contributed
equity 441.70 434.80 427.01 418.36 408.88 398.62 387.61
Reserves 42.70 53.70 66.53 81.43 98.67 118.56 141.45
Retained
earnings 463.20 555.60 608.68 668.19 732.01 802.23 878.03
Total equity 947.60 1,044.10 1,102.23 1,167.98 1,239.56 1,319.41 1,407.10
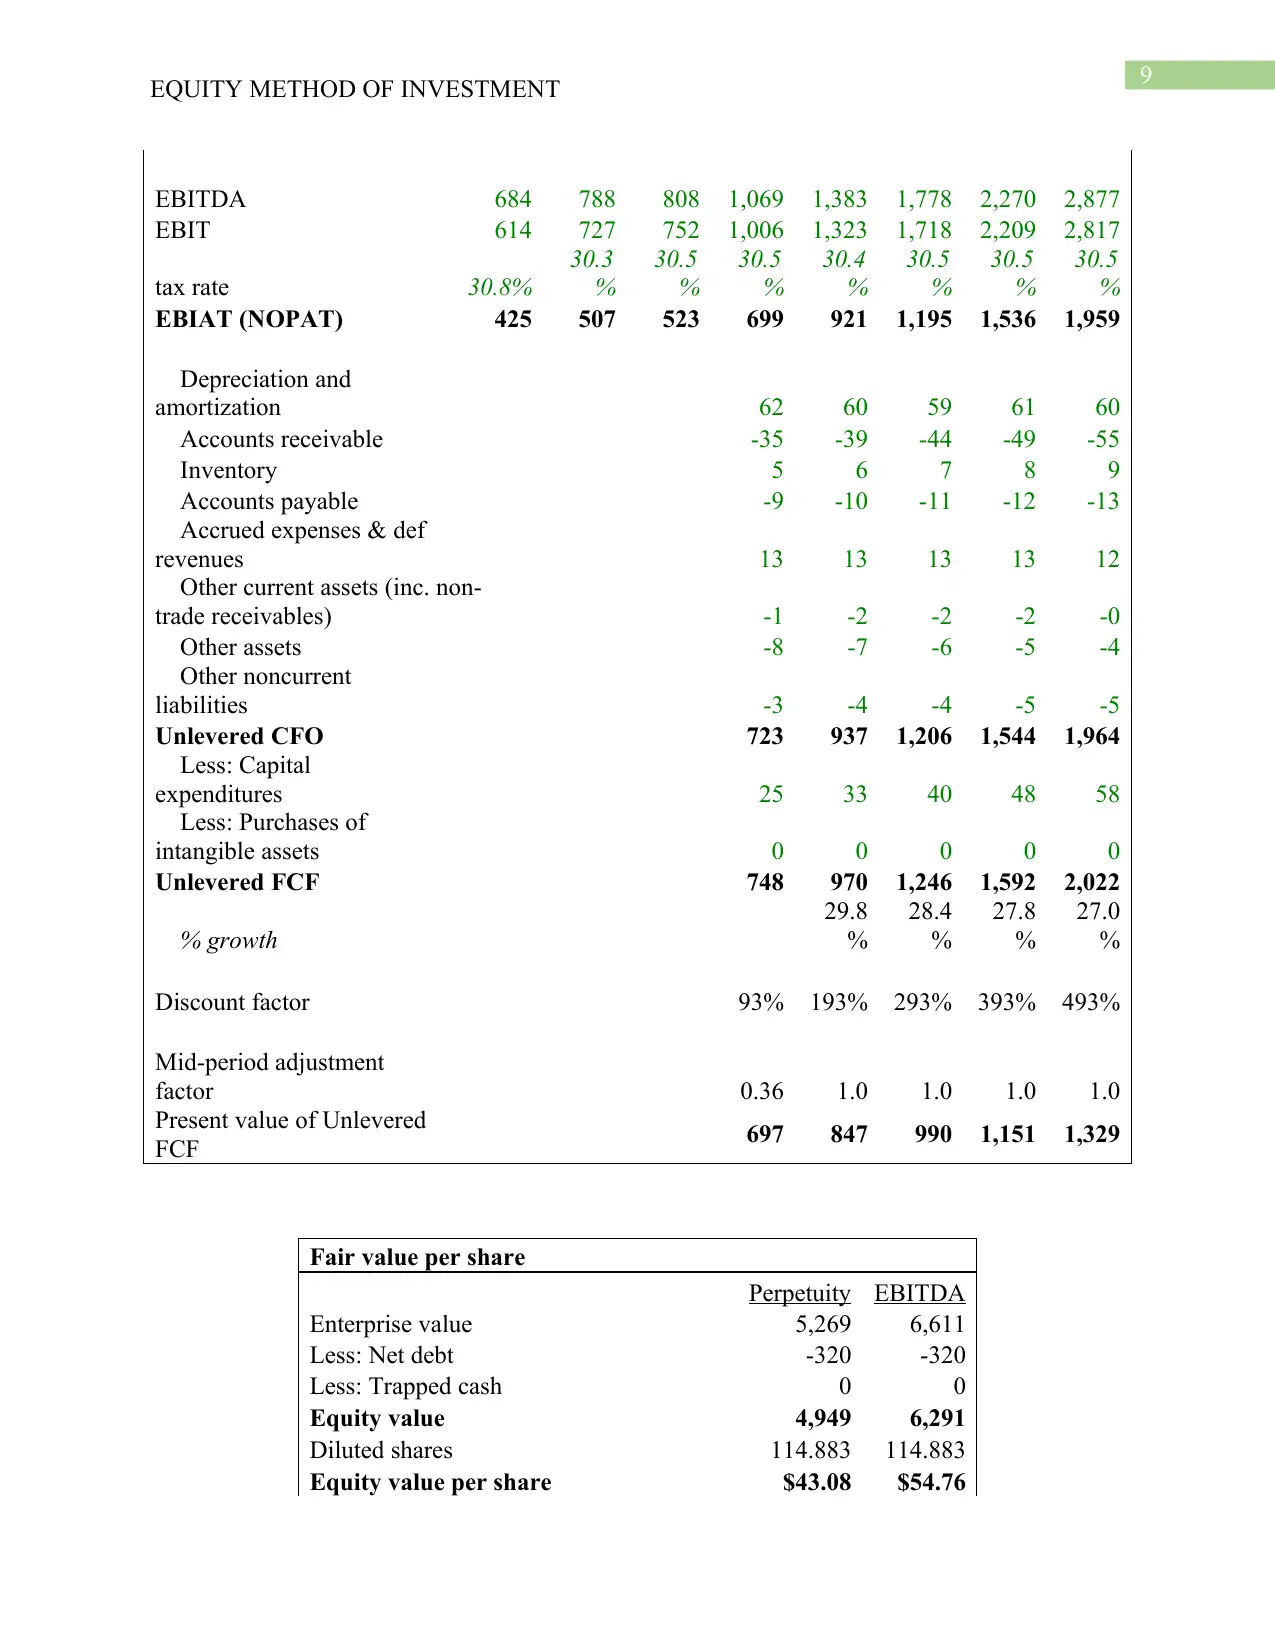
The above tables provide information about the overall financial projection that has been
conducted for JB Hi Fi. The financial projection is relatively evaluated on the basis of the past
three financial years of the organisation. Moreover, a projection of 5 years has been conducted to
adequately identify all the relevant income streams and the financial position of the company in
future (Investors.jbhifi.com.au 2019). The projections have been conducted on the basis of
averages from the previous financial years, as it helps in projecting the growth rate of each
component of the financial statement. The growth rate is directly used for calculating the future
income that would be generated by the organisation. The average method that is used for
calculating the overall values has adequately been restricted to two major components of the
income statement such as revenues and gross profit. However, the other expenses and income
that has been listed in the income statement is derived by using the percentage of revenue in
context to that transaction. This method has adequately helped in determining the appropriate
values of the income statement that is used for deriving the net income of the organization.
Valuation:
Free cash flow buildup
Fiscal year
2017
A
2018
A
2019
A
2020
P
2021
P
2022
P
2023
P
2024
P
Fiscal year end date
8-14-
17
8-13-
18
8-12-
19
8-31-
20
8-31-
21
8-31-
22
8-31-
23
8-31-
24
EQUITY METHOD OF INVESTMENT
947.60 1,044.10 1,102.23 1,167.98 1,239.56 1,319.41 1,407.10
Contributed
equity 441.70 434.80 427.01 418.36 408.88 398.62 387.61
Reserves 42.70 53.70 66.53 81.43 98.67 118.56 141.45
Retained
earnings 463.20 555.60 608.68 668.19 732.01 802.23 878.03
Total equity 947.60 1,044.10 1,102.23 1,167.98 1,239.56 1,319.41 1,407.10
The above tables provide information about the overall financial projection that has been
conducted for JB Hi Fi. The financial projection is relatively evaluated on the basis of the past
three financial years of the organisation. Moreover, a projection of 5 years has been conducted to
adequately identify all the relevant income streams and the financial position of the company in
future (Investors.jbhifi.com.au 2019). The projections have been conducted on the basis of
averages from the previous financial years, as it helps in projecting the growth rate of each
component of the financial statement. The growth rate is directly used for calculating the future
income that would be generated by the organisation. The average method that is used for
calculating the overall values has adequately been restricted to two major components of the
income statement such as revenues and gross profit. However, the other expenses and income
that has been listed in the income statement is derived by using the percentage of revenue in
context to that transaction. This method has adequately helped in determining the appropriate
values of the income statement that is used for deriving the net income of the organization.
Valuation:
Free cash flow buildup
Fiscal year
2017
A
2018
A
2019
A
2020
P
2021
P
2022
P
2023
P
2024
P
Fiscal year end date
8-14-
17
8-13-
18
8-12-
19
8-31-
20
8-31-
21
8-31-
22
8-31-
23
8-31-
24
⊘ This is a preview!⊘
Do you want full access?
Subscribe today to unlock all pages.
Trusted by 1+ million students worldwide
9
EQUITY METHOD OF INVESTMENT
EBITDA 684 788 808 1,069 1,383 1,778 2,270 2,877
EBIT 614 727 752 1,006 1,323 1,718 2,209 2,817
tax rate 30.8%
30.3
%
30.5
%
30.5
%
30.4
%
30.5
%
30.5
%
30.5
%
EBIAT (NOPAT) 425 507 523 699 921 1,195 1,536 1,959
Depreciation and
amortization 62 60 59 61 60
Accounts receivable -35 -39 -44 -49 -55
Inventory 5 6 7 8 9
Accounts payable -9 -10 -11 -12 -13
Accrued expenses & def
revenues 13 13 13 13 12
Other current assets (inc. non-
trade receivables) -1 -2 -2 -2 -0
Other assets -8 -7 -6 -5 -4
Other noncurrent
liabilities -3 -4 -4 -5 -5
Unlevered CFO 723 937 1,206 1,544 1,964
Less: Capital
expenditures 25 33 40 48 58
Less: Purchases of
intangible assets 0 0 0 0 0
Unlevered FCF 748 970 1,246 1,592 2,022
% growth
29.8
%
28.4
%
27.8
%
27.0
%
Discount factor 93% 193% 293% 393% 493%
Mid-period adjustment
factor 0.36 1.0 1.0 1.0 1.0
Present value of Unlevered
FCF 697 847 990 1,151 1,329
Fair value per share
Perpetuity EBITDA
Enterprise value 5,269 6,611
Less: Net debt -320 -320
Less: Trapped cash 0 0
Equity value 4,949 6,291
Diluted shares 114.883 114.883
Equity value per share $43.08 $54.76
Paraphrase This Document
Need a fresh take? Get an instant paraphrase of this document with our AI Paraphraser
10
EQUITY METHOD OF INVESTMENT
Market premium / (discount) to fair value (19.9%) (37.0%)
Cost of capital assumptions
Cost of debt 3.3%
Tax rate 30.0%
After tax cost of debt 2.3%
Risk free rate 1.0%
Beta 0.74
Market risk premium 13.9%
Cost of equity 10.6%
Capital weights
Amount % of total
Market value of equity 3,963.5 92.5%
Net debt 319.9 7.5%
Cost of capital (WACC) 9.9%
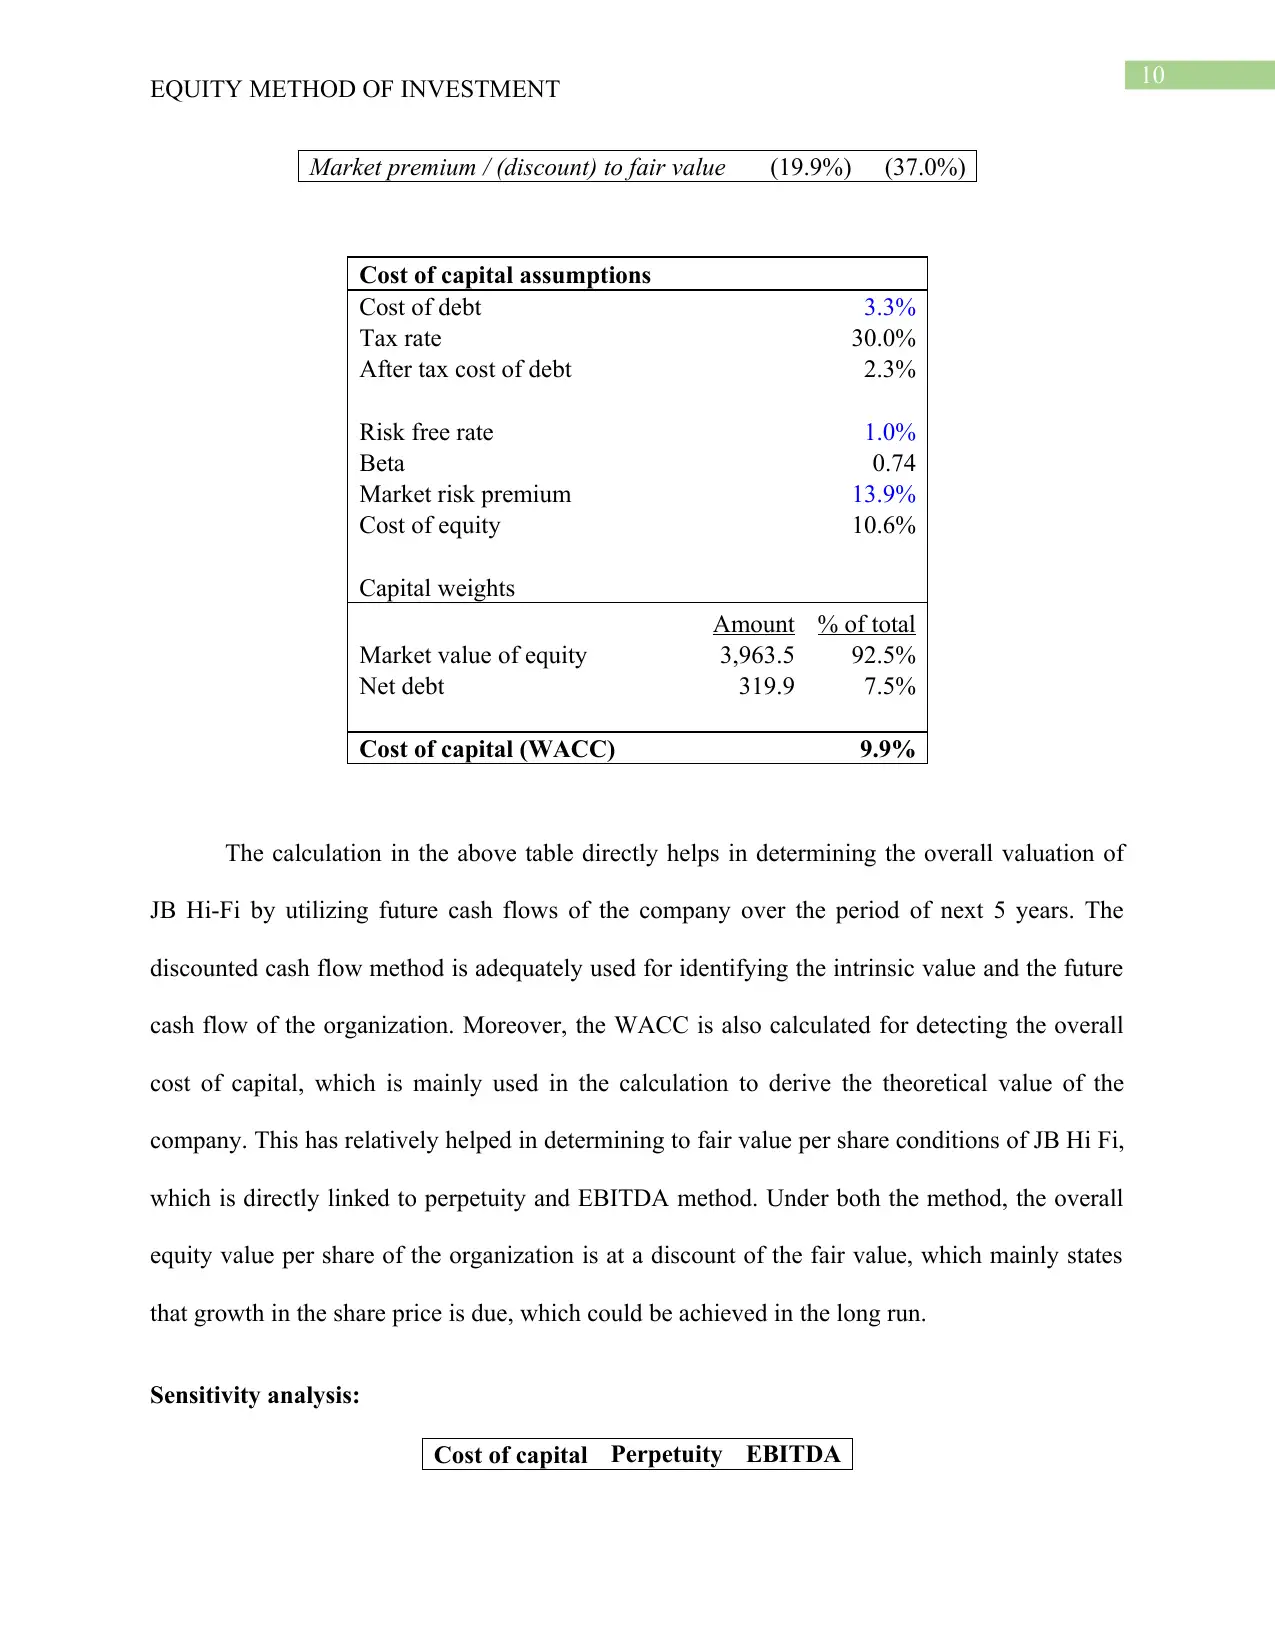
The calculation in the above table directly helps in determining the overall valuation of
JB Hi-Fi by utilizing future cash flows of the company over the period of next 5 years. The
discounted cash flow method is adequately used for identifying the intrinsic value and the future
cash flow of the organization. Moreover, the WACC is also calculated for detecting the overall
cost of capital, which is mainly used in the calculation to derive the theoretical value of the
company. This has relatively helped in determining to fair value per share conditions of JB Hi Fi,
which is directly linked to perpetuity and EBITDA method. Under both the method, the overall
equity value per share of the organization is at a discount of the fair value, which mainly states
that growth in the share price is due, which could be achieved in the long run.
Sensitivity analysis:
Cost of capital Perpetuity EBITDA
EQUITY METHOD OF INVESTMENT
Market premium / (discount) to fair value (19.9%) (37.0%)
Cost of capital assumptions
Cost of debt 3.3%
Tax rate 30.0%
After tax cost of debt 2.3%
Risk free rate 1.0%
Beta 0.74
Market risk premium 13.9%
Cost of equity 10.6%
Capital weights
Amount % of total
Market value of equity 3,963.5 92.5%
Net debt 319.9 7.5%
Cost of capital (WACC) 9.9%
The calculation in the above table directly helps in determining the overall valuation of
JB Hi-Fi by utilizing future cash flows of the company over the period of next 5 years. The
discounted cash flow method is adequately used for identifying the intrinsic value and the future
cash flow of the organization. Moreover, the WACC is also calculated for detecting the overall
cost of capital, which is mainly used in the calculation to derive the theoretical value of the
company. This has relatively helped in determining to fair value per share conditions of JB Hi Fi,
which is directly linked to perpetuity and EBITDA method. Under both the method, the overall
equity value per share of the organization is at a discount of the fair value, which mainly states
that growth in the share price is due, which could be achieved in the long run.
Sensitivity analysis:
Cost of capital Perpetuity EBITDA
11
EQUITY METHOD OF INVESTMENT
6.94% $114.24 $101.42
7.30% $102.72 $90.05
7.69% $92.44 $79.92
8.09% $83.23 $70.87
8.52% $74.96 $62.77
8.96% $67.52 $55.50
9.44% $60.81 $48.96
9.93% $54.76 $43.08
10.43% $49.53 $38.03
10.95% $44.78 $33.46
11.50% $40.46 $29.31
12.07% $36.52 $25.56
12.68% $32.93 $22.16
13.31% $29.66 $19.08
13.98% $26.68 $16.29
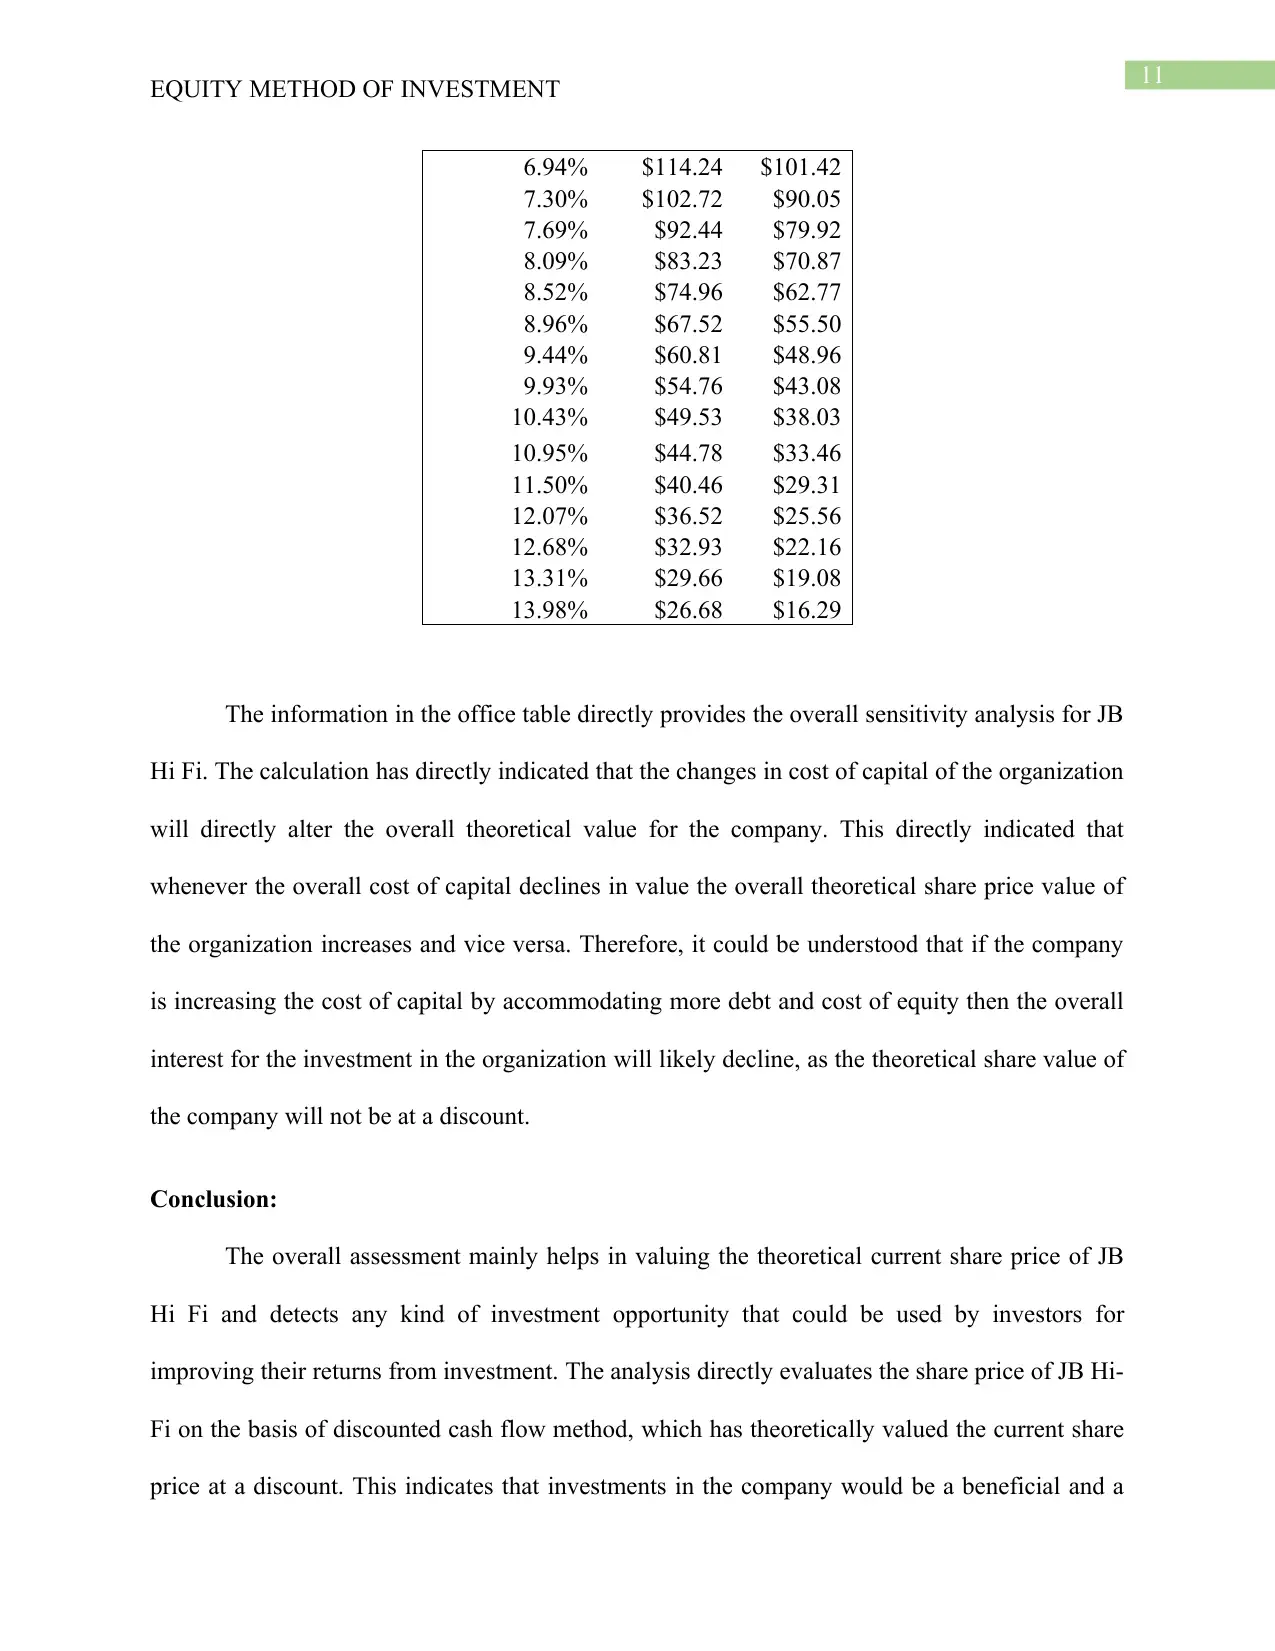
The information in the office table directly provides the overall sensitivity analysis for JB
Hi Fi. The calculation has directly indicated that the changes in cost of capital of the organization
will directly alter the overall theoretical value for the company. This directly indicated that
whenever the overall cost of capital declines in value the overall theoretical share price value of
the organization increases and vice versa. Therefore, it could be understood that if the company
is increasing the cost of capital by accommodating more debt and cost of equity then the overall
interest for the investment in the organization will likely decline, as the theoretical share value of
the company will not be at a discount.
Conclusion:
The overall assessment mainly helps in valuing the theoretical current share price of JB
Hi Fi and detects any kind of investment opportunity that could be used by investors for
improving their returns from investment. The analysis directly evaluates the share price of JB Hi-
Fi on the basis of discounted cash flow method, which has theoretically valued the current share
price at a discount. This indicates that investments in the company would be a beneficial and a
EQUITY METHOD OF INVESTMENT
6.94% $114.24 $101.42
7.30% $102.72 $90.05
7.69% $92.44 $79.92
8.09% $83.23 $70.87
8.52% $74.96 $62.77
8.96% $67.52 $55.50
9.44% $60.81 $48.96
9.93% $54.76 $43.08
10.43% $49.53 $38.03
10.95% $44.78 $33.46
11.50% $40.46 $29.31
12.07% $36.52 $25.56
12.68% $32.93 $22.16
13.31% $29.66 $19.08
13.98% $26.68 $16.29
The information in the office table directly provides the overall sensitivity analysis for JB
Hi Fi. The calculation has directly indicated that the changes in cost of capital of the organization
will directly alter the overall theoretical value for the company. This directly indicated that
whenever the overall cost of capital declines in value the overall theoretical share price value of
the organization increases and vice versa. Therefore, it could be understood that if the company
is increasing the cost of capital by accommodating more debt and cost of equity then the overall
interest for the investment in the organization will likely decline, as the theoretical share value of
the company will not be at a discount.
Conclusion:
The overall assessment mainly helps in valuing the theoretical current share price of JB
Hi Fi and detects any kind of investment opportunity that could be used by investors for
improving their returns from investment. The analysis directly evaluates the share price of JB Hi-
Fi on the basis of discounted cash flow method, which has theoretically valued the current share
price at a discount. This indicates that investments in the company would be a beneficial and a
⊘ This is a preview!⊘
Do you want full access?
Subscribe today to unlock all pages.
Trusted by 1+ million students worldwide
1 out of 14
Related Documents


Your All-in-One AI-Powered Toolkit for Academic Success.
+13062052269
info@desklib.com
Available 24*7 on WhatsApp / Email
![[object Object]](/_next/static/media/star-bottom.7253800d.svg)
Unlock your academic potential
Copyright © 2020–2026 A2Z Services. All Rights Reserved. Developed and managed by ZUCOL.