Research Report: Knowledge Sharing, Innovation & Firm Performance

Verified

Added on  2023/06/10

|34
|6012
|466
Report
AI Summary
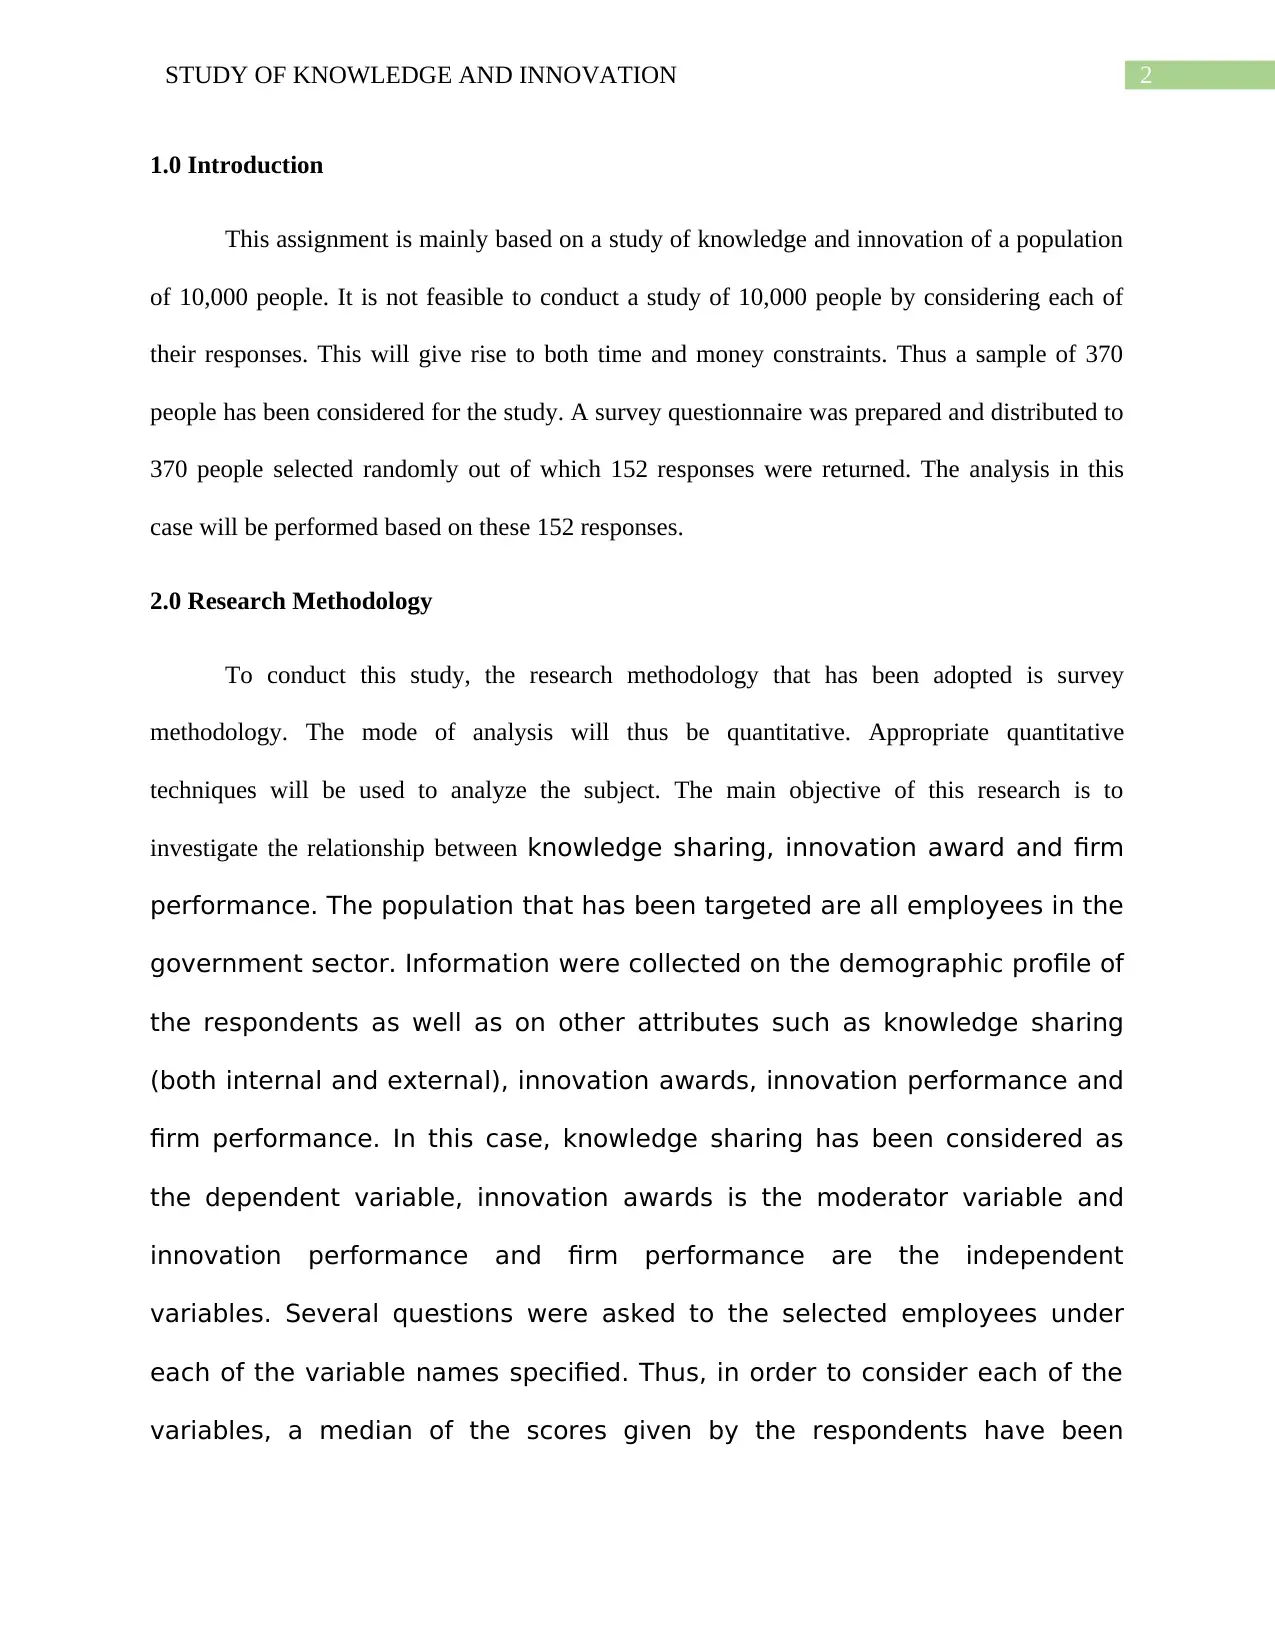
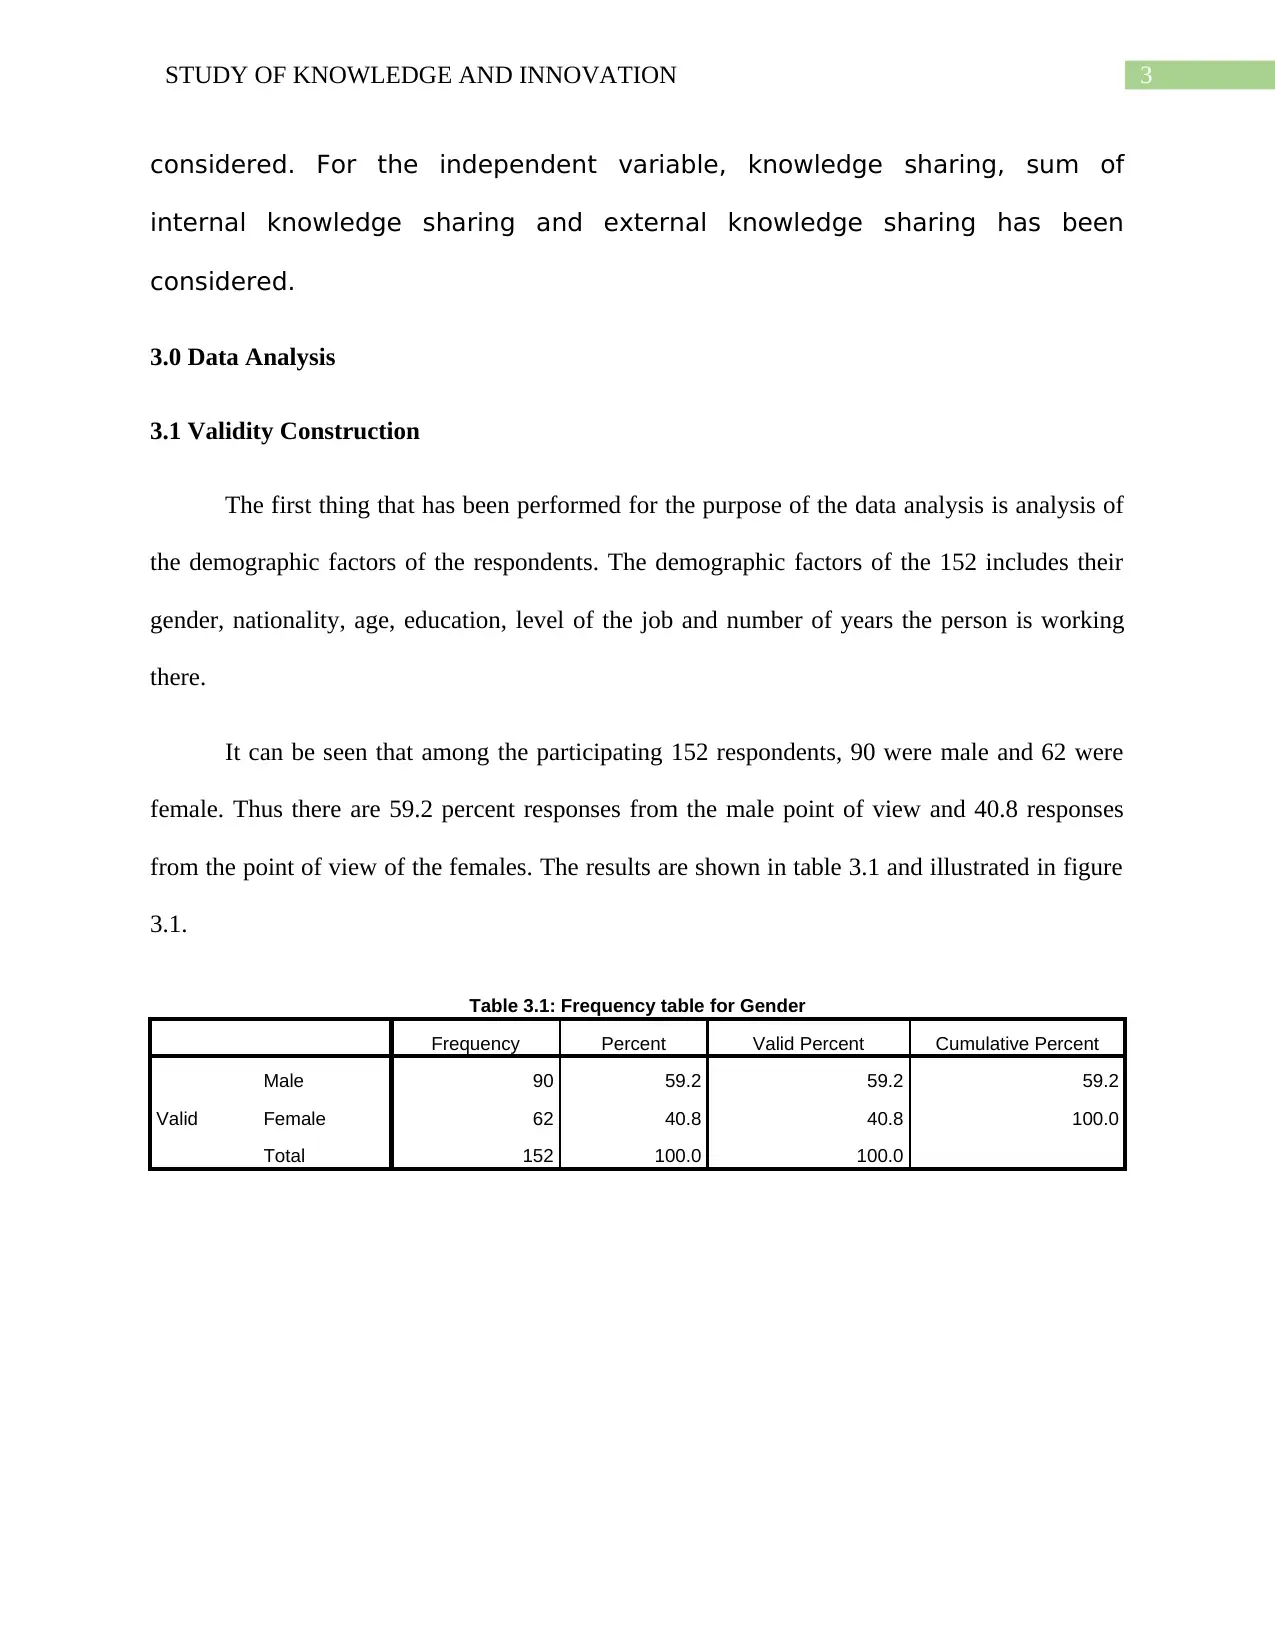
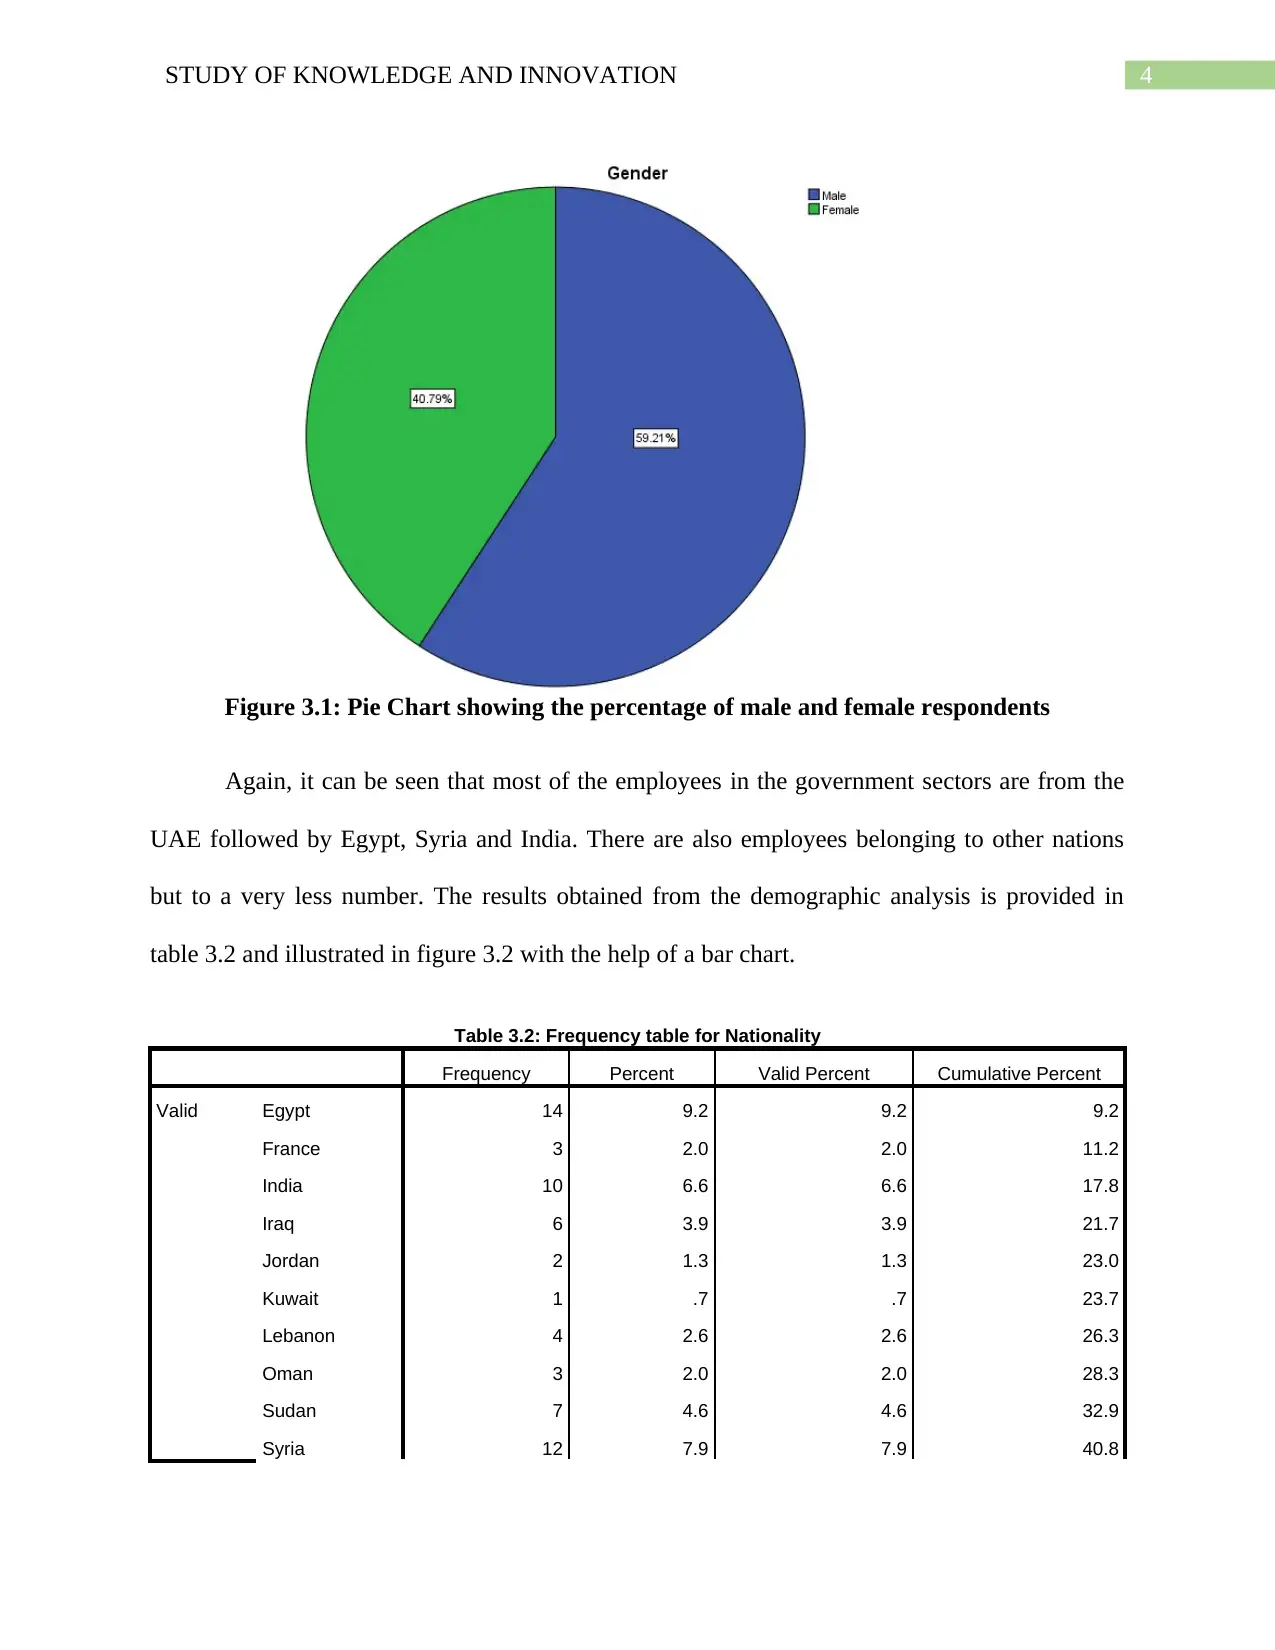
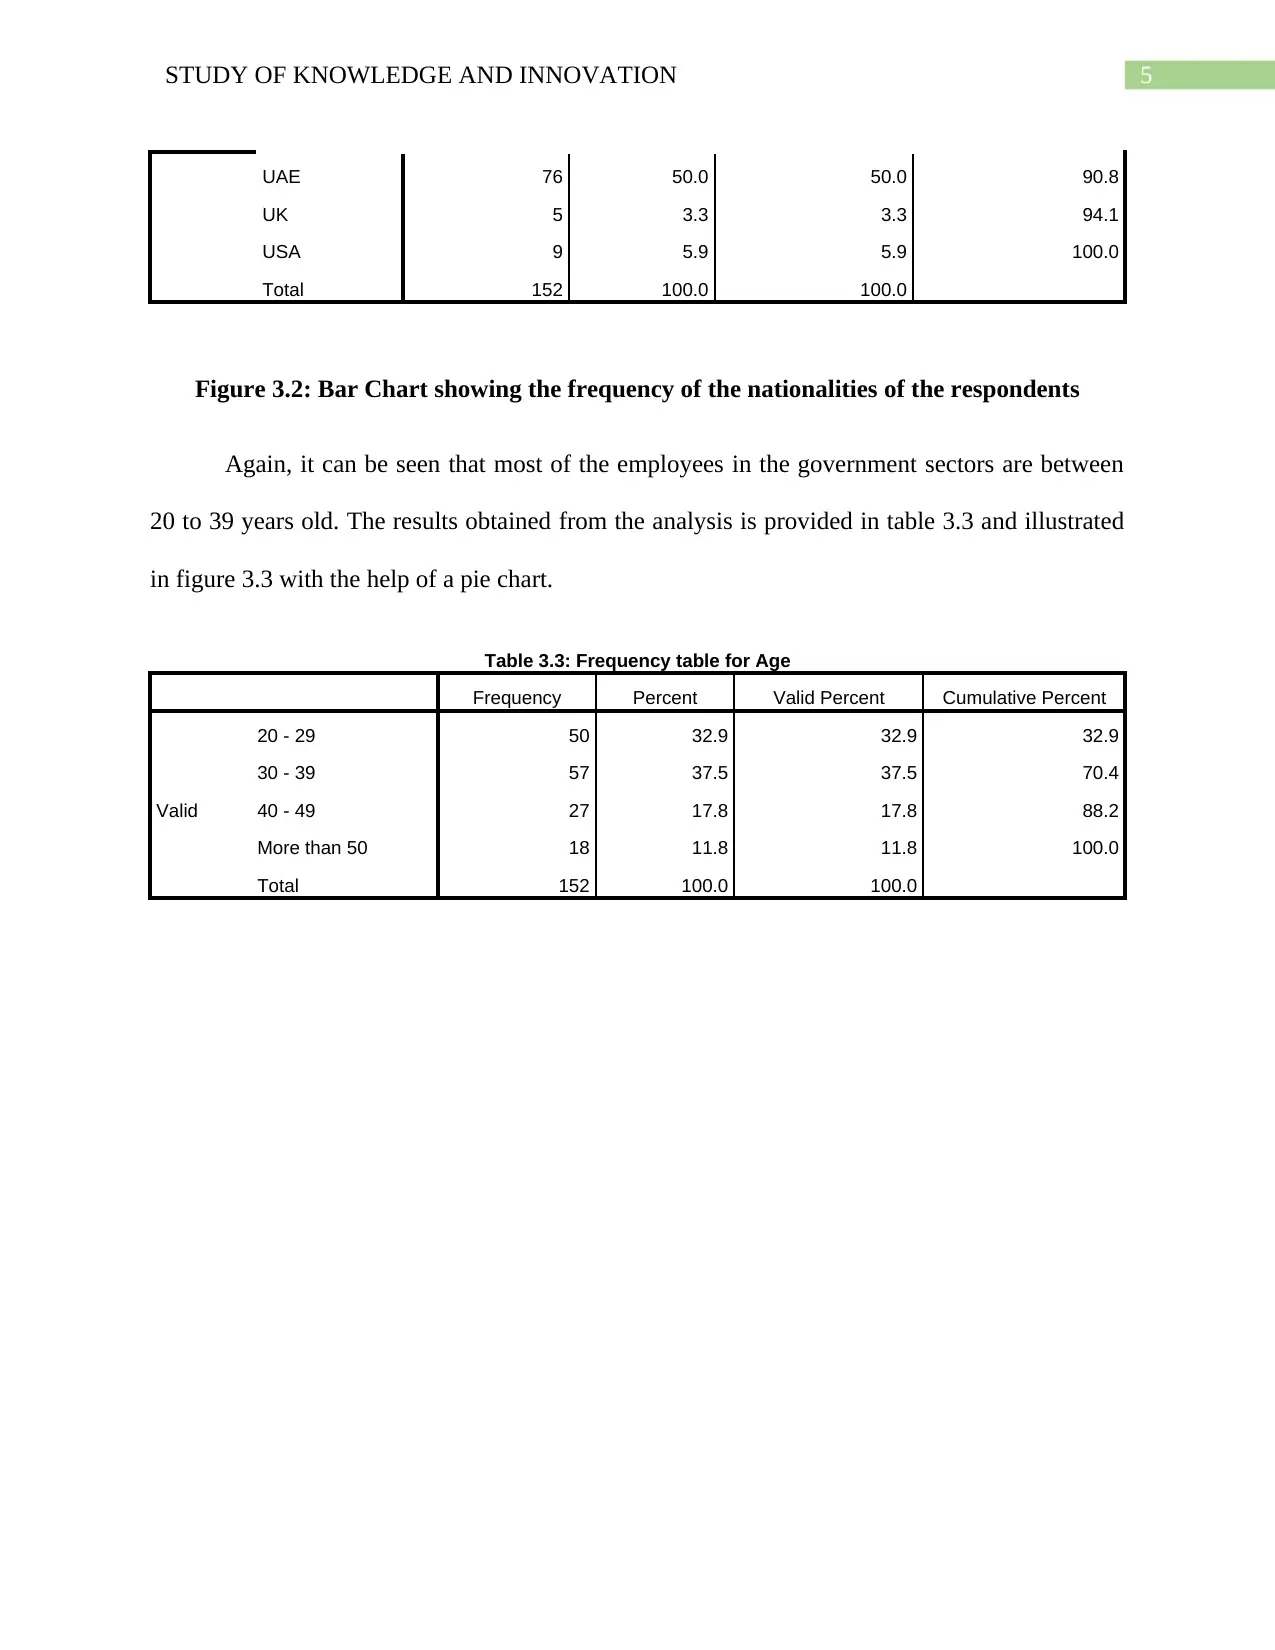
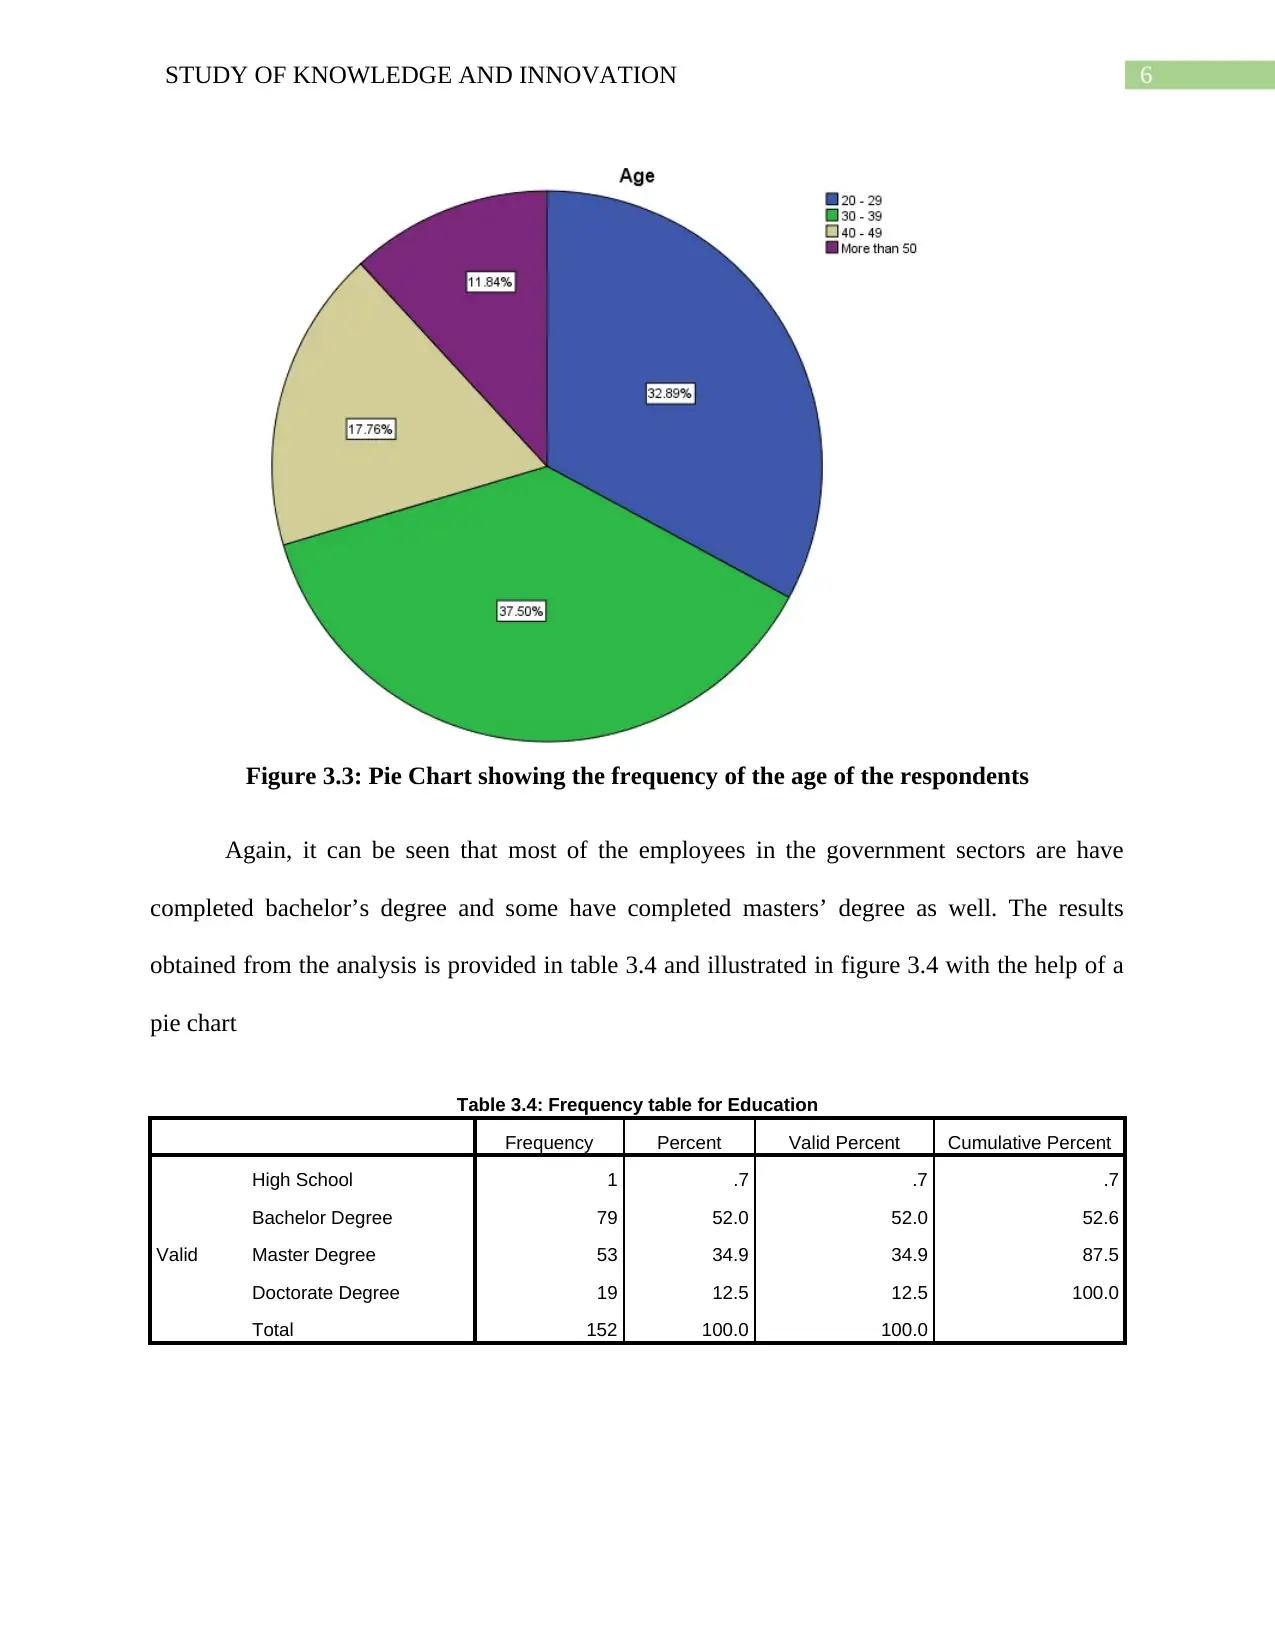
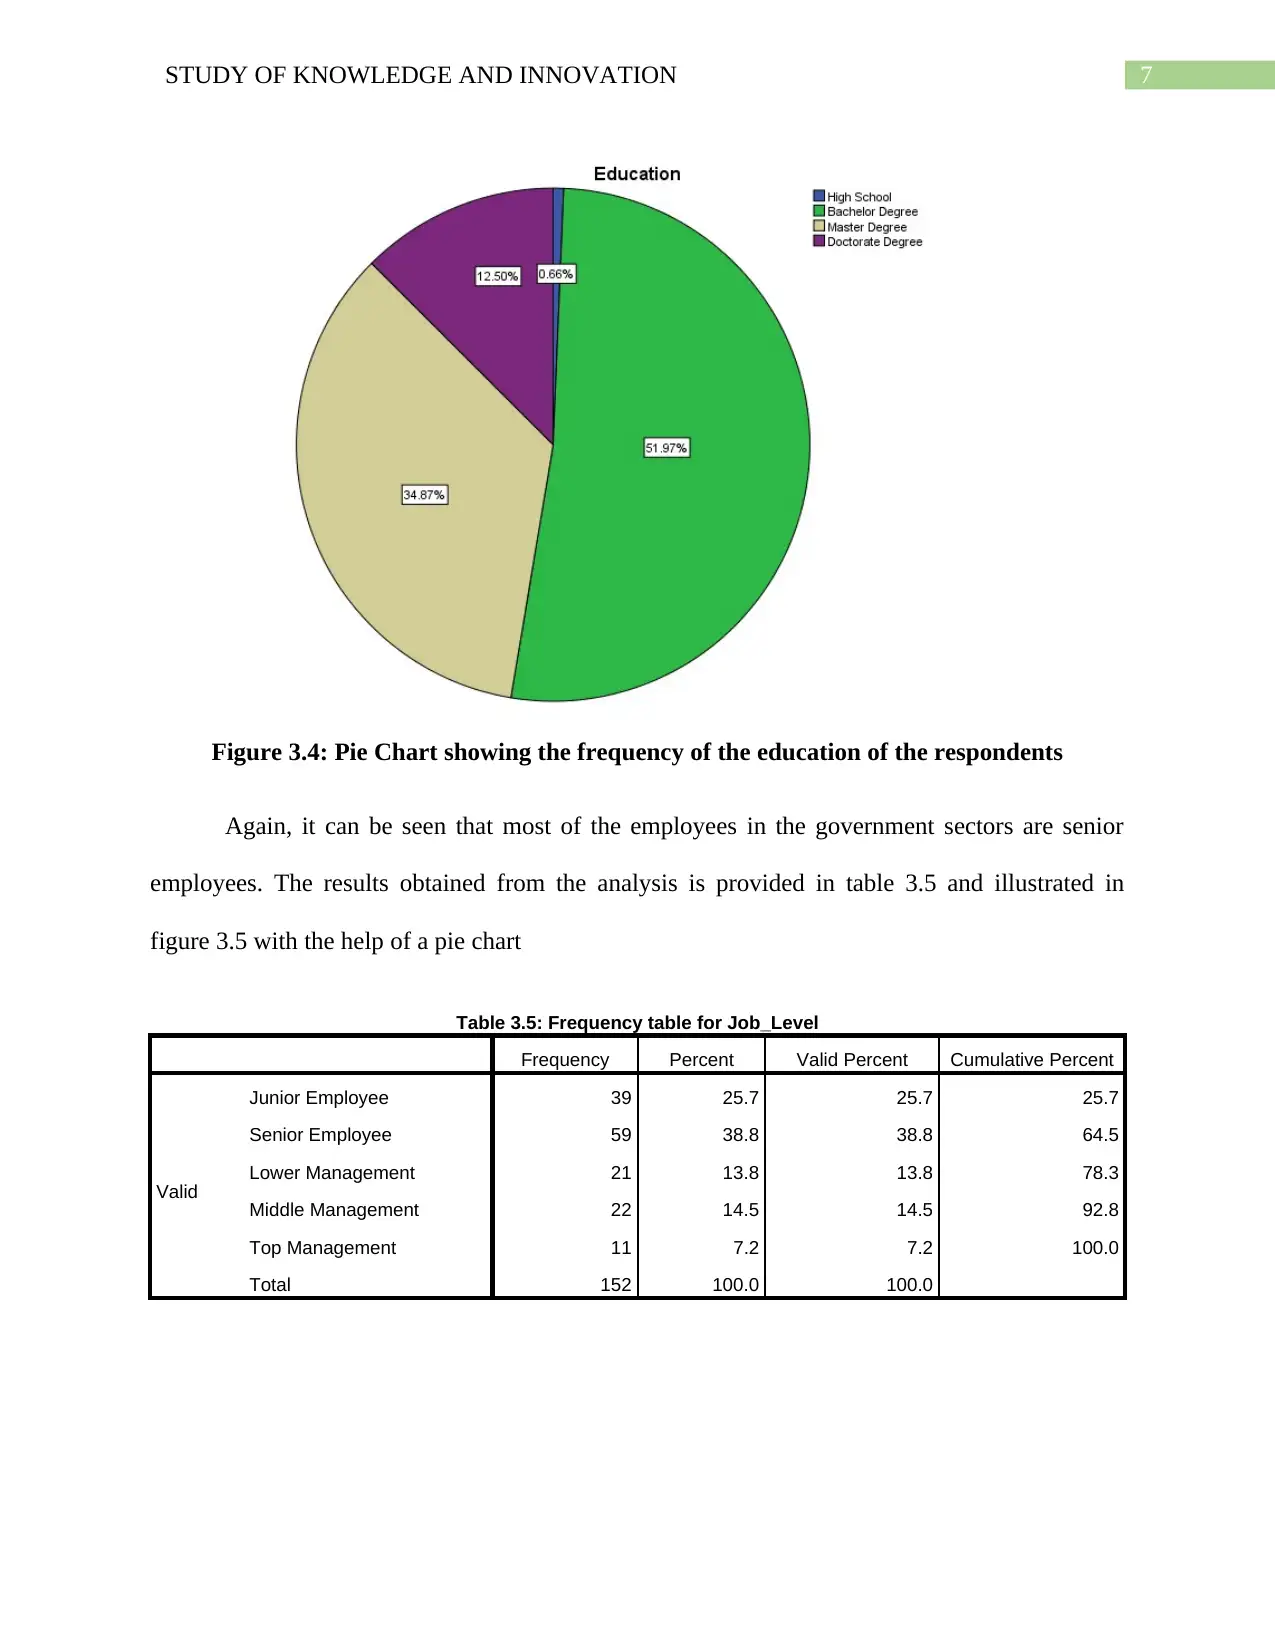
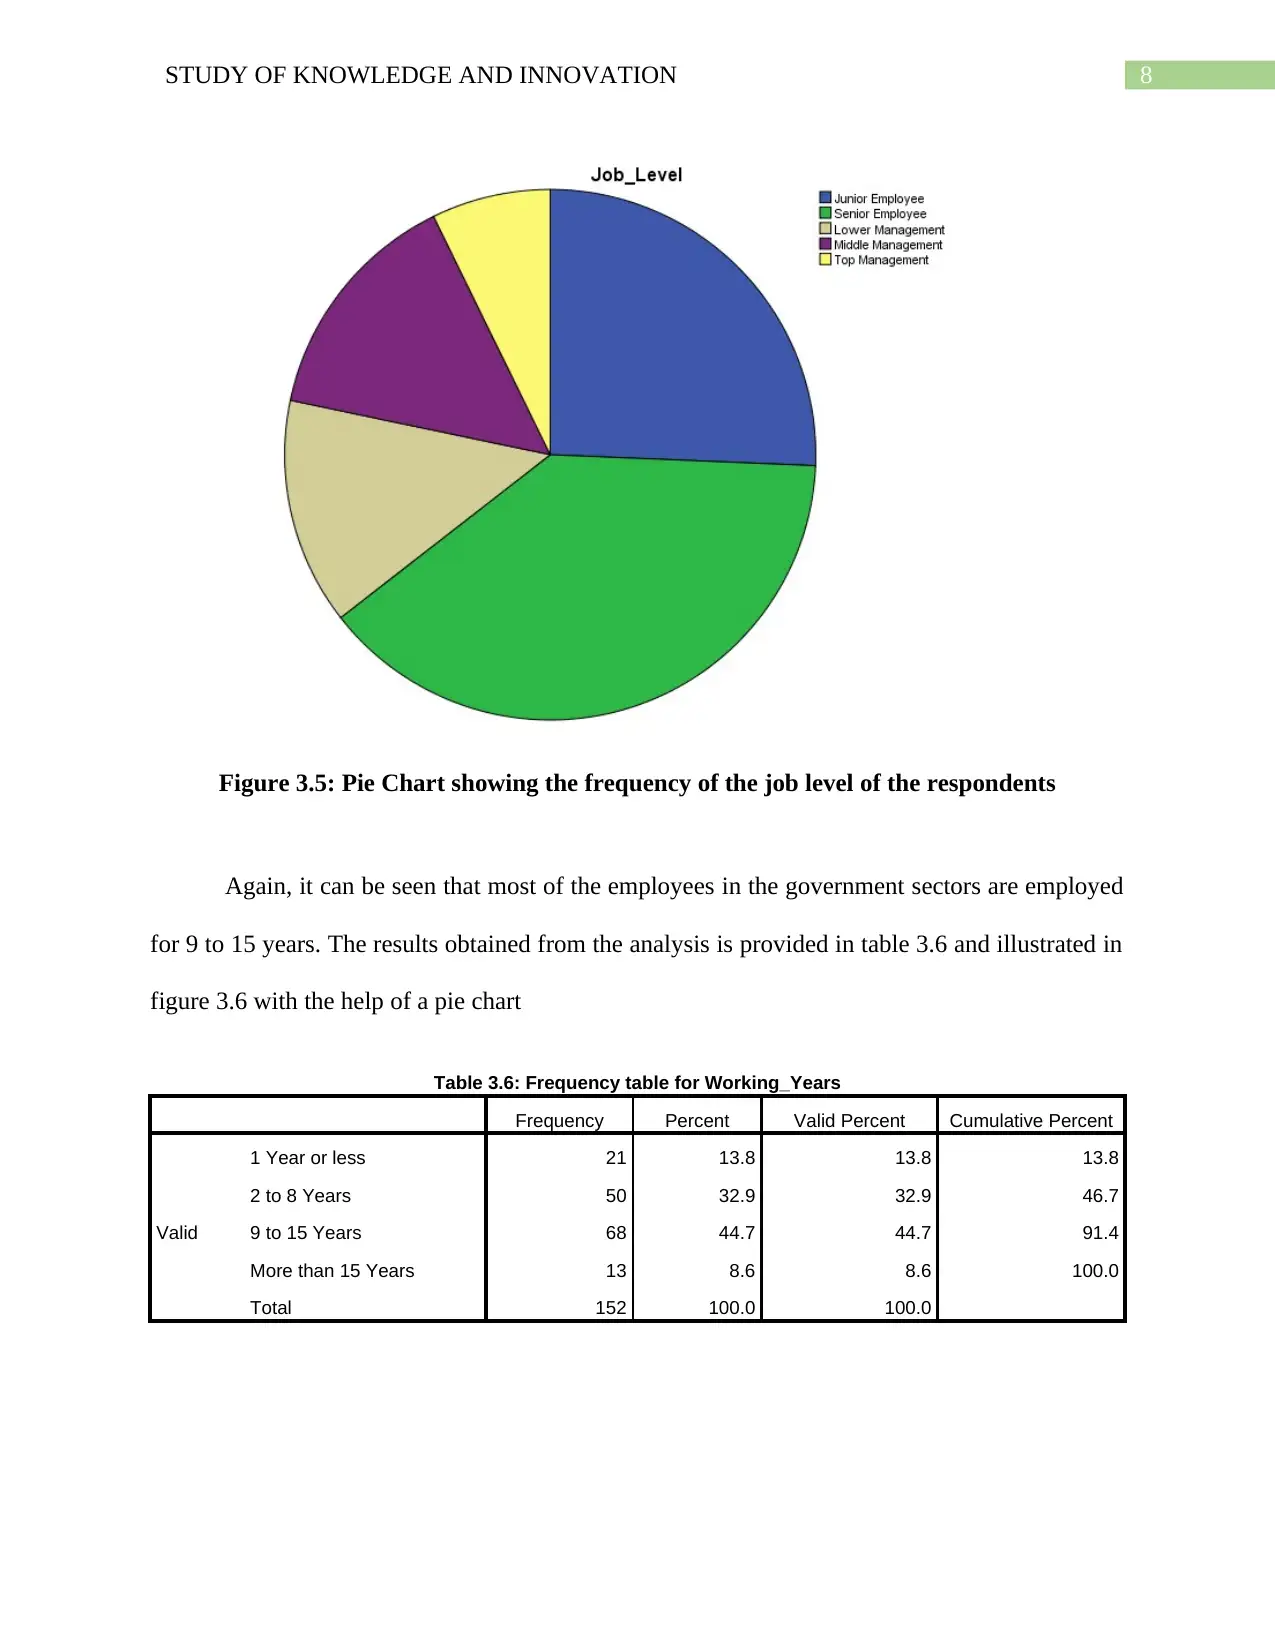
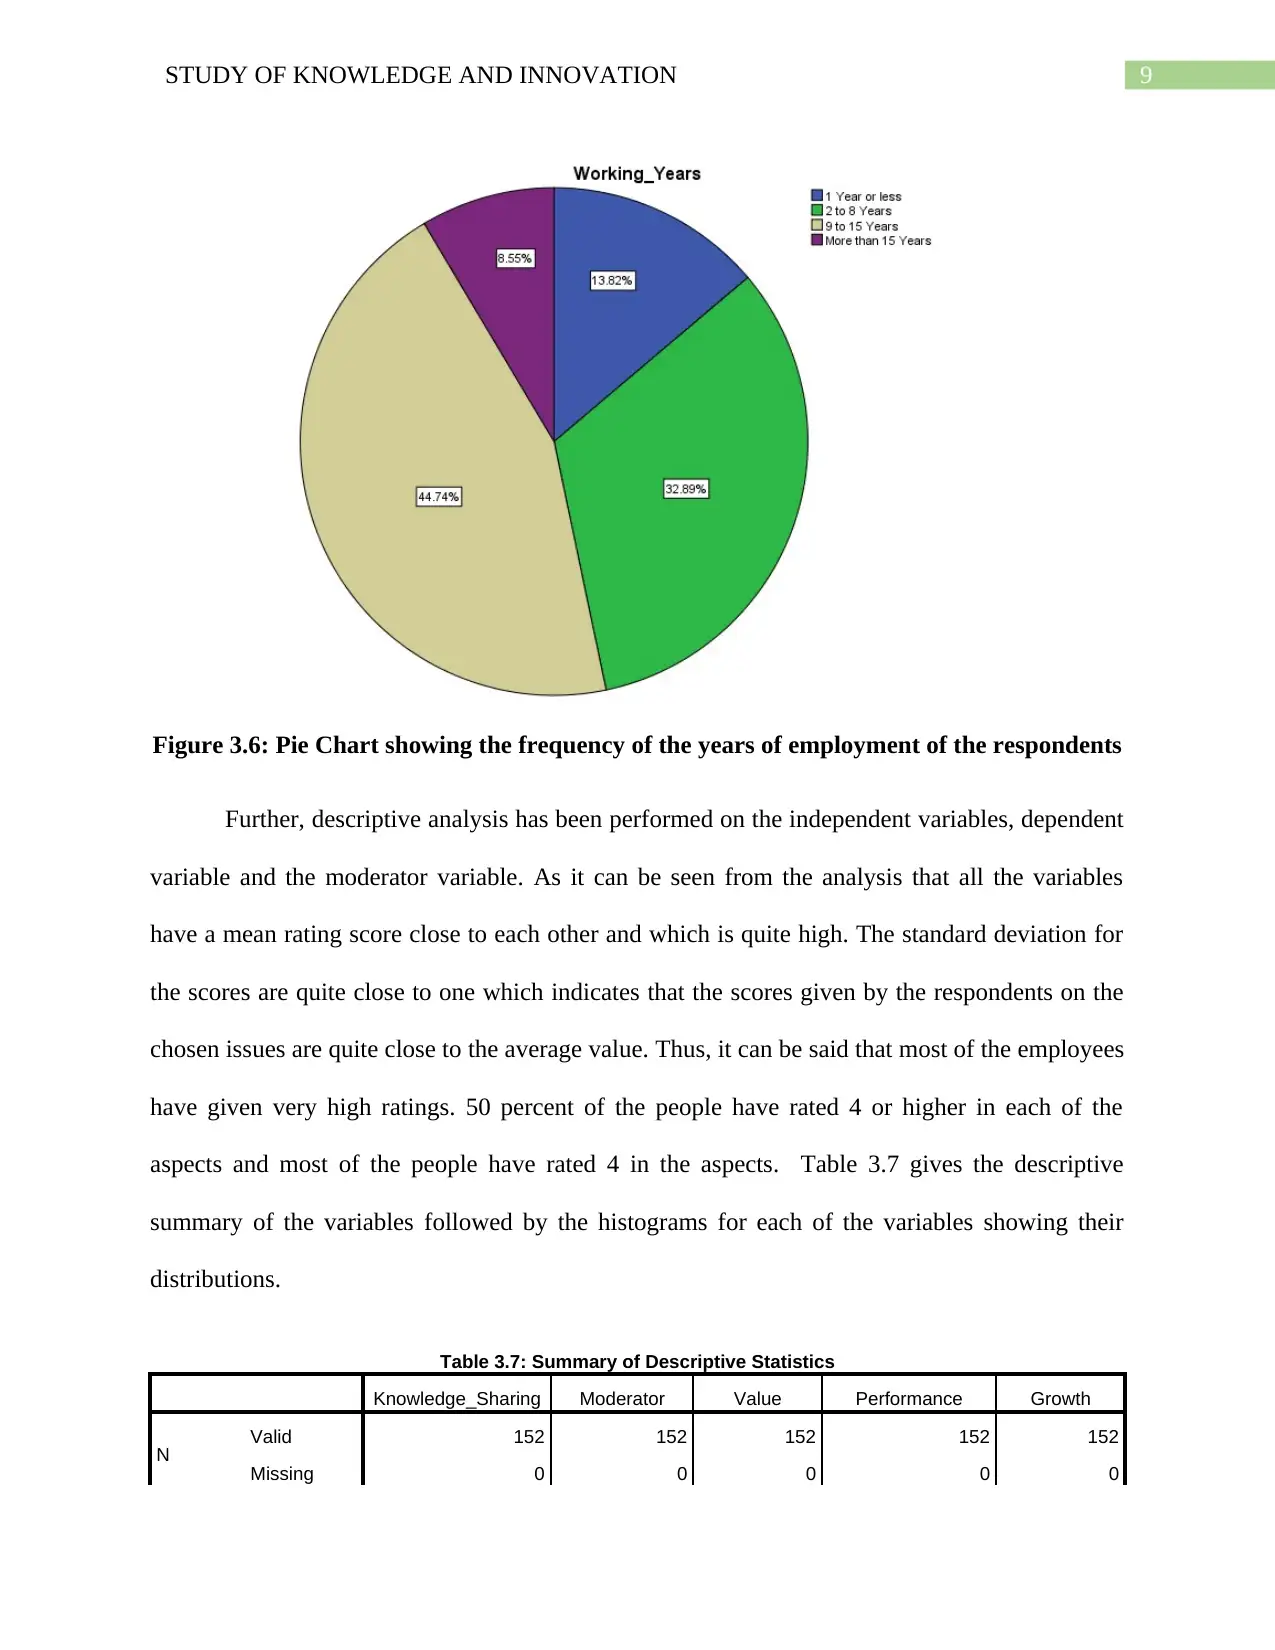
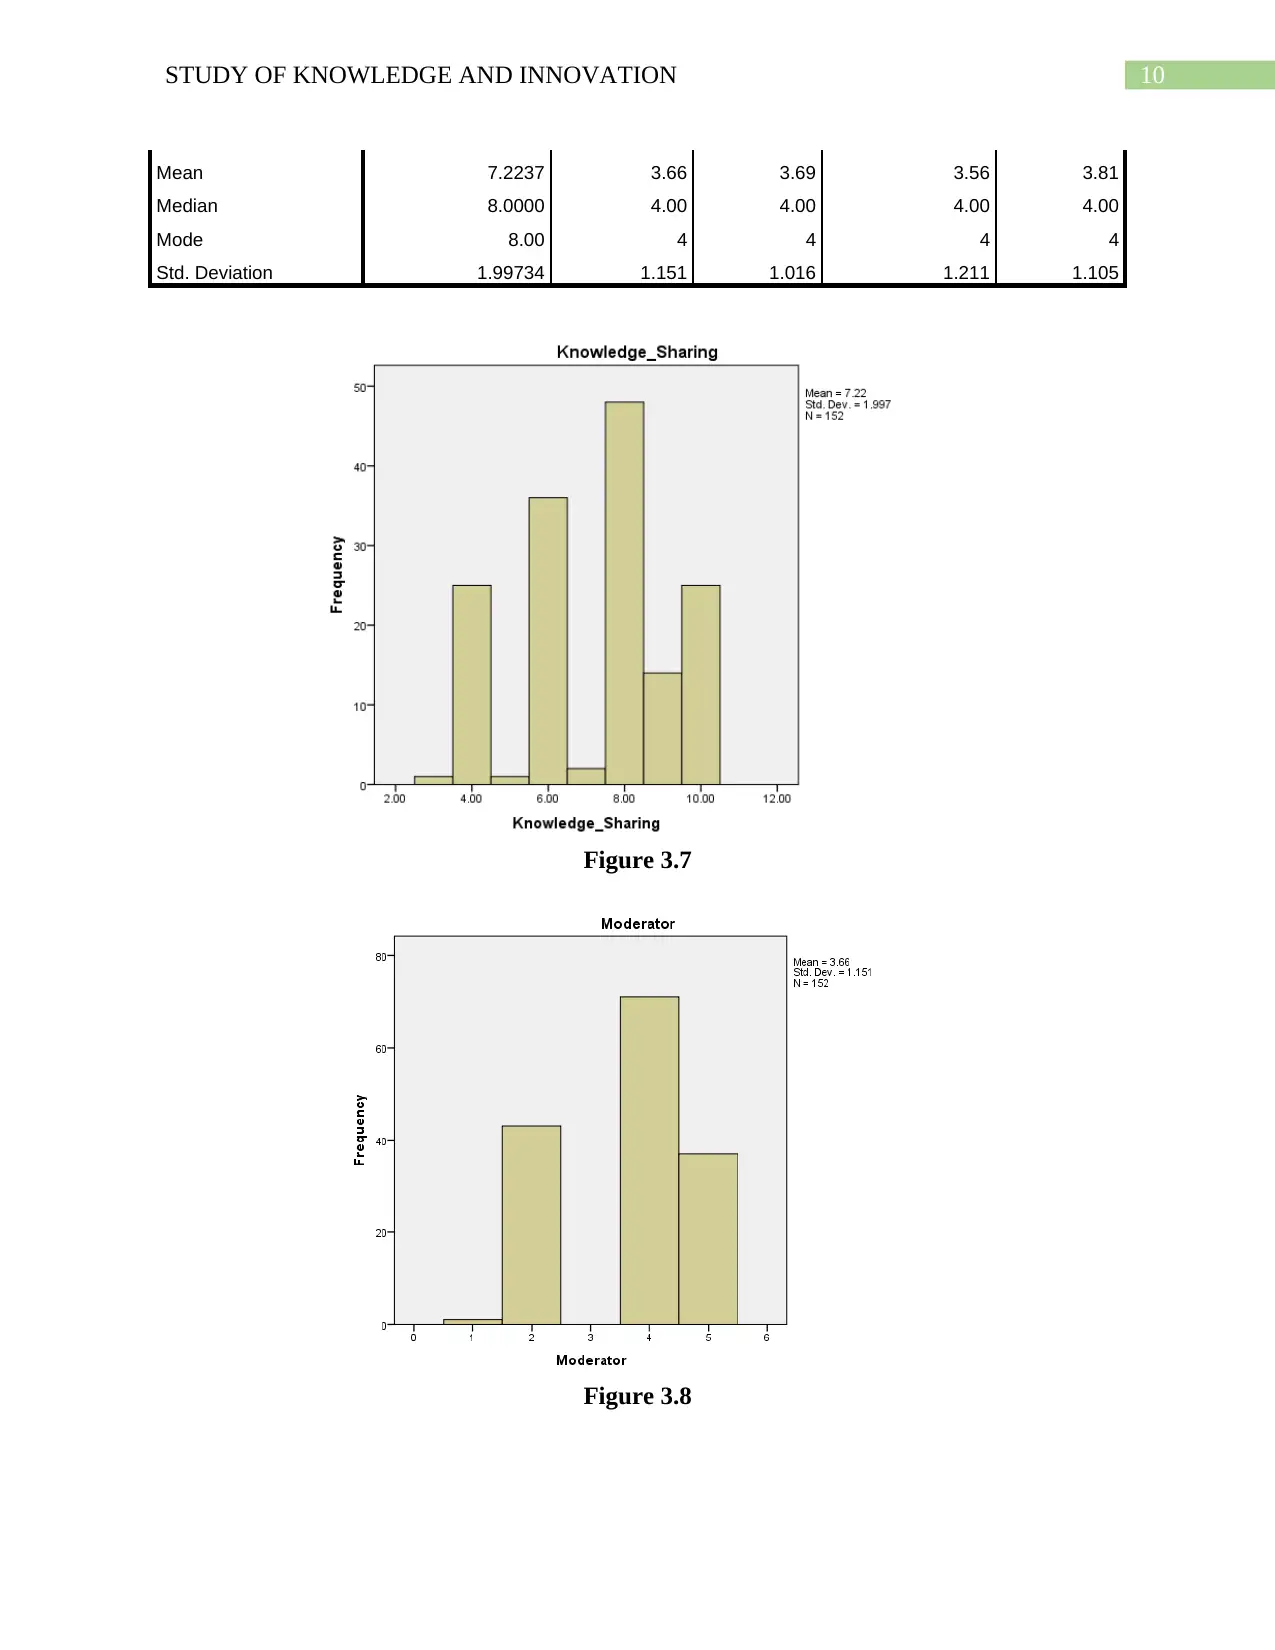
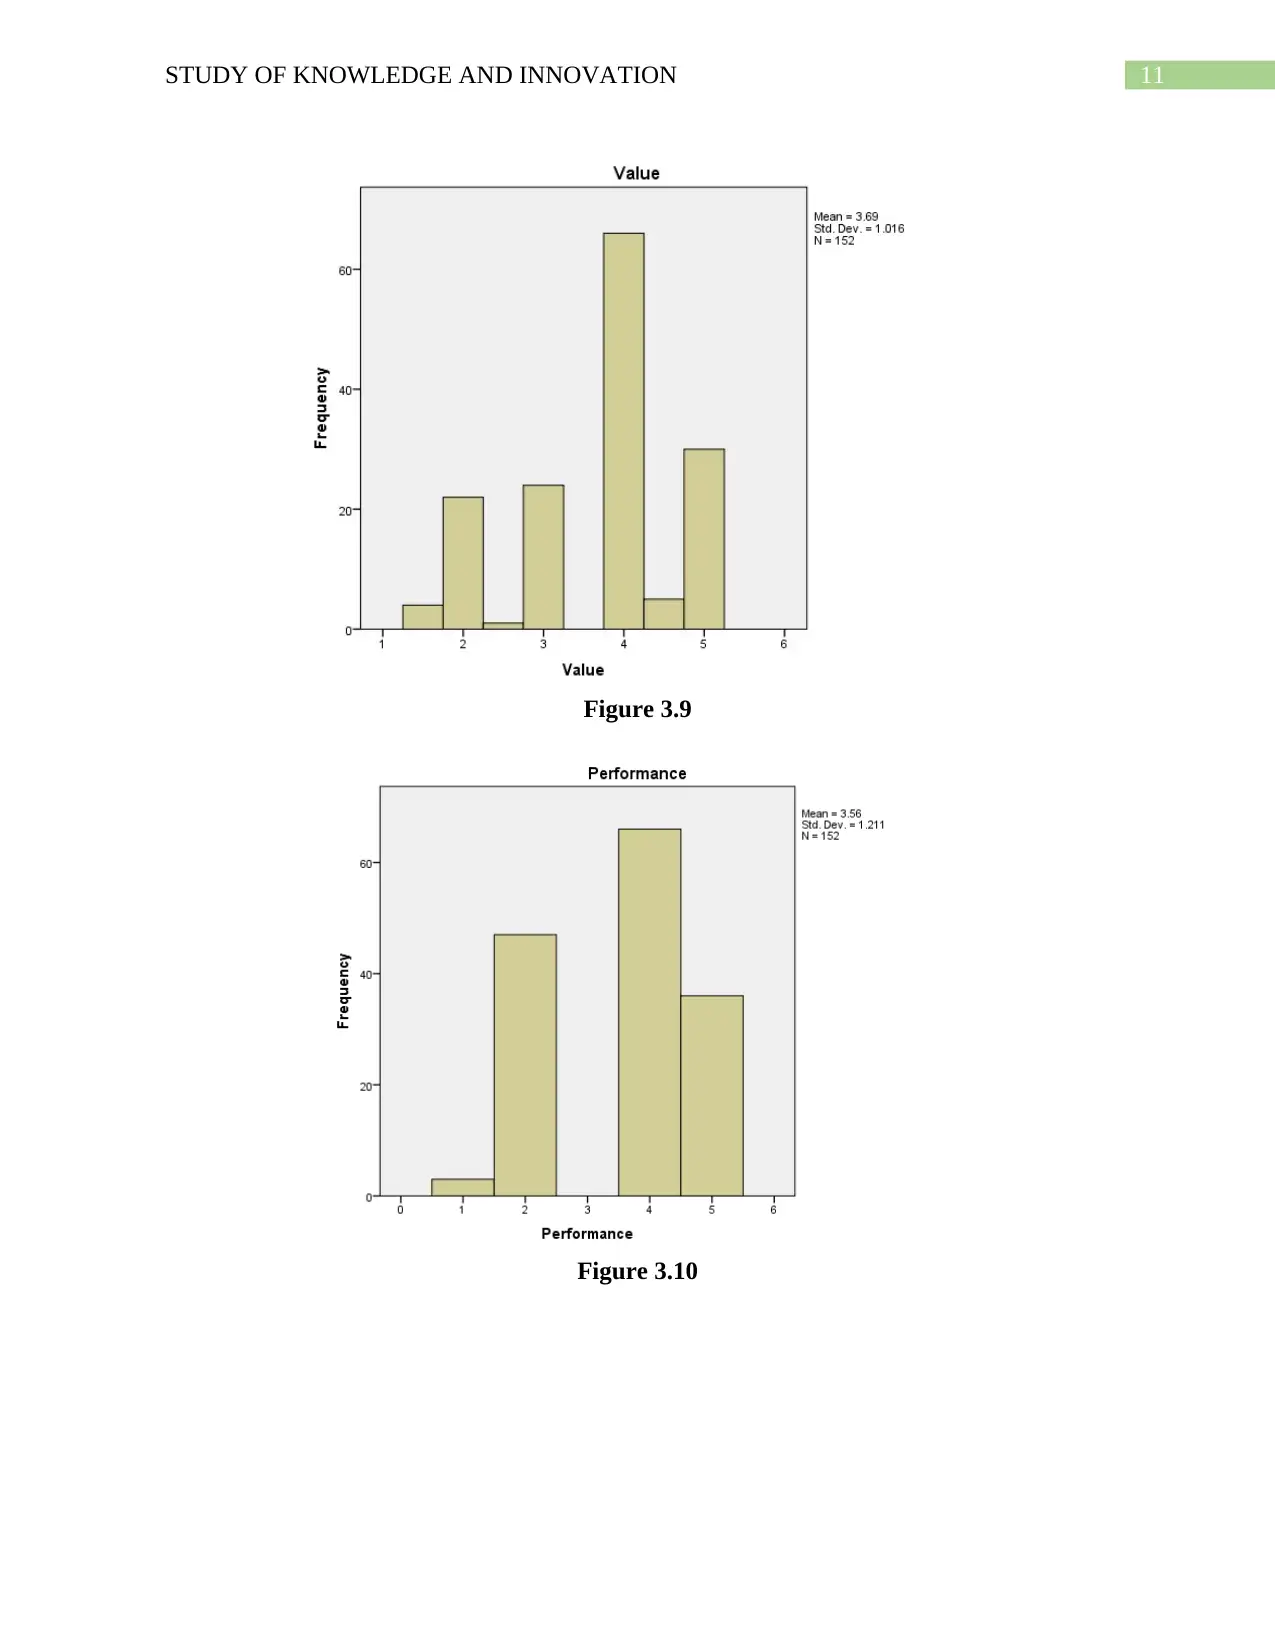
This report presents a study on knowledge and innovation within a population, focusing on a sample of 152 responses from a survey distributed to 370 randomly selected individuals. The research employs a quantitative survey methodology to investigate the relationship between knowledge sharing (both internal and external), innovation awards, innovation performance, and firm performance within the government sector. Demographic factors such as gender, nationality, age, education, job level, and years of employment are analyzed. Descriptive statistics, correlation analysis, reliability tests (Cronbach's alpha), and factor analysis are conducted using SPSS to assess the validity and reliability of the data and to explore the associations between the variables. The findings highlight the strong association between knowledge sharing and other variables, suggesting their potential for predicting knowledge sharing among employees. The report concludes with a reliability test indicating high data reliability and a factor analysis identifying five key components explaining a significant portion of the total variation in the data.
Document Page
Running Head: STUDY OF KNOWLEDGE AND INNOVATION
Study of Knowledge and Innovation
Name of the Student
Name of the University
Student ID
tabler-icon-diamond-filled.svg

Paraphrase This Document

Need a fresh take? Get an instant paraphrase of this document with our AI Paraphraser
Document Page
1STUDY OF KNOWLEDGE AND INNOVATION
Table of Contents
1.0 Introduction................................................................................................................................2
2.0 Research Methodology..............................................................................................................2
3.0 Data Analysis.............................................................................................................................2
3.1 Validity Construction.............................................................................................................3
3.2 Reliability Test.....................................................................................................................12
3.3 Factor Analysis....................................................................................................................12
3.4 Multiple Linear Regression.................................................................................................25
Document Page
2STUDY OF KNOWLEDGE AND INNOVATION
1.0 Introduction
This assignment is mainly based on a study of knowledge and innovation of a population
of 10,000 people. It is not feasible to conduct a study of 10,000 people by considering each of
their responses. This will give rise to both time and money constraints. Thus a sample of 370
people has been considered for the study. A survey questionnaire was prepared and distributed to
370 people selected randomly out of which 152 responses were returned. The analysis in this
case will be performed based on these 152 responses.
2.0 Research Methodology
To conduct this study, the research methodology that has been adopted is survey
methodology. The mode of analysis will thus be quantitative. Appropriate quantitative
techniques will be used to analyze the subject. The main objective of this research is to
investigate the relationship between knowledge sharing, innovation award and firm
performance. The population that has been targeted are all employees in the
government sector. Information were collected on the demographic profile of
the respondents as well as on other attributes such as knowledge sharing
(both internal and external), innovation awards, innovation performance and
firm performance. In this case, knowledge sharing has been considered as
the dependent variable, innovation awards is the moderator variable and
innovation performance and firm performance are the independent
variables. Several questions were asked to the selected employees under
each of the variable names specified. Thus, in order to consider each of the
variables, a median of the scores given by the respondents have been
Document Page
3STUDY OF KNOWLEDGE AND INNOVATION
considered. For the independent variable, knowledge sharing, sum of
internal knowledge sharing and external knowledge sharing has been
considered.
3.0 Data Analysis
3.1 Validity Construction
The first thing that has been performed for the purpose of the data analysis is analysis of
the demographic factors of the respondents. The demographic factors of the 152 includes their
gender, nationality, age, education, level of the job and number of years the person is working
there.
It can be seen that among the participating 152 respondents, 90 were male and 62 were
female. Thus there are 59.2 percent responses from the male point of view and 40.8 responses
from the point of view of the females. The results are shown in table 3.1 and illustrated in figure
3.1.
Table 3.1: Frequency table for Gender
Frequency Percent Valid Percent Cumulative Percent
Valid
Male 90 59.2 59.2 59.2
Female 62 40.8 40.8 100.0
Total 152 100.0 100.0
tabler-icon-diamond-filled.svg

Paraphrase This Document

Need a fresh take? Get an instant paraphrase of this document with our AI Paraphraser
Document Page
4STUDY OF KNOWLEDGE AND INNOVATION
Figure 3.1: Pie Chart showing the percentage of male and female respondents
Again, it can be seen that most of the employees in the government sectors are from the
UAE followed by Egypt, Syria and India. There are also employees belonging to other nations
but to a very less number. The results obtained from the demographic analysis is provided in
table 3.2 and illustrated in figure 3.2 with the help of a bar chart.
Table 3.2: Frequency table for Nationality
Frequency Percent Valid Percent Cumulative Percent
Valid Egypt 14 9.2 9.2 9.2
France 3 2.0 2.0 11.2
India 10 6.6 6.6 17.8
Iraq 6 3.9 3.9 21.7
Jordan 2 1.3 1.3 23.0
Kuwait 1 .7 .7 23.7
Lebanon 4 2.6 2.6 26.3
Oman 3 2.0 2.0 28.3
Sudan 7 4.6 4.6 32.9
Syria 12 7.9 7.9 40.8
Document Page
5STUDY OF KNOWLEDGE AND INNOVATION
UAE 76 50.0 50.0 90.8
UK 5 3.3 3.3 94.1
USA 9 5.9 5.9 100.0
Total 152 100.0 100.0
Figure 3.2: Bar Chart showing the frequency of the nationalities of the respondents
Again, it can be seen that most of the employees in the government sectors are between
20 to 39 years old. The results obtained from the analysis is provided in table 3.3 and illustrated
in figure 3.3 with the help of a pie chart.
Table 3.3: Frequency table for Age
Frequency Percent Valid Percent Cumulative Percent
Valid
20 - 29 50 32.9 32.9 32.9
30 - 39 57 37.5 37.5 70.4
40 - 49 27 17.8 17.8 88.2
More than 50 18 11.8 11.8 100.0
Total 152 100.0 100.0
Document Page
6STUDY OF KNOWLEDGE AND INNOVATION
Figure 3.3: Pie Chart showing the frequency of the age of the respondents
Again, it can be seen that most of the employees in the government sectors are have
completed bachelor’s degree and some have completed masters’ degree as well. The results
obtained from the analysis is provided in table 3.4 and illustrated in figure 3.4 with the help of a
pie chart
Table 3.4: Frequency table for Education
Frequency Percent Valid Percent Cumulative Percent
Valid
High School 1 .7 .7 .7
Bachelor Degree 79 52.0 52.0 52.6
Master Degree 53 34.9 34.9 87.5
Doctorate Degree 19 12.5 12.5 100.0
Total 152 100.0 100.0
tabler-icon-diamond-filled.svg

Paraphrase This Document

Need a fresh take? Get an instant paraphrase of this document with our AI Paraphraser
Document Page
7STUDY OF KNOWLEDGE AND INNOVATION
Figure 3.4: Pie Chart showing the frequency of the education of the respondents
Again, it can be seen that most of the employees in the government sectors are senior
employees. The results obtained from the analysis is provided in table 3.5 and illustrated in
figure 3.5 with the help of a pie chart
Table 3.5: Frequency table for Job_Level
Frequency Percent Valid Percent Cumulative Percent
Valid
Junior Employee 39 25.7 25.7 25.7
Senior Employee 59 38.8 38.8 64.5
Lower Management 21 13.8 13.8 78.3
Middle Management 22 14.5 14.5 92.8
Top Management 11 7.2 7.2 100.0
Total 152 100.0 100.0
Document Page
8STUDY OF KNOWLEDGE AND INNOVATION
Figure 3.5: Pie Chart showing the frequency of the job level of the respondents
Again, it can be seen that most of the employees in the government sectors are employed
for 9 to 15 years. The results obtained from the analysis is provided in table 3.6 and illustrated in
figure 3.6 with the help of a pie chart
Table 3.6: Frequency table for Working_Years
Frequency Percent Valid Percent Cumulative Percent
Valid
1 Year or less 21 13.8 13.8 13.8
2 to 8 Years 50 32.9 32.9 46.7
9 to 15 Years 68 44.7 44.7 91.4
More than 15 Years 13 8.6 8.6 100.0
Total 152 100.0 100.0
Document Page
9STUDY OF KNOWLEDGE AND INNOVATION
Figure 3.6: Pie Chart showing the frequency of the years of employment of the respondents
Further, descriptive analysis has been performed on the independent variables, dependent
variable and the moderator variable. As it can be seen from the analysis that all the variables
have a mean rating score close to each other and which is quite high. The standard deviation for
the scores are quite close to one which indicates that the scores given by the respondents on the
chosen issues are quite close to the average value. Thus, it can be said that most of the employees
have given very high ratings. 50 percent of the people have rated 4 or higher in each of the
aspects and most of the people have rated 4 in the aspects. Table 3.7 gives the descriptive
summary of the variables followed by the histograms for each of the variables showing their
distributions.
Table 3.7: Summary of Descriptive Statistics
Knowledge_Sharing Moderator Value Performance Growth
N Valid 152 152 152 152 152
Missing 0 0 0 0 0
tabler-icon-diamond-filled.svg

Paraphrase This Document

Need a fresh take? Get an instant paraphrase of this document with our AI Paraphraser
Document Page
10STUDY OF KNOWLEDGE AND INNOVATION
Mean 7.2237 3.66 3.69 3.56 3.81
Median 8.0000 4.00 4.00 4.00 4.00
Mode 8.00 4 4 4 4
Std. Deviation 1.99734 1.151 1.016 1.211 1.105
Figure 3.7
Figure 3.8
Document Page
11STUDY OF KNOWLEDGE AND INNOVATION
Figure 3.9
Figure 3.10
chevron_up_icon
1 out of 34
circle_padding
hide_on_mobile
zoom_out_icon
[object Object]