Comprehensive Research Method Design Report: Lincoln Christmas Market
VerifiedAdded on 2023/01/23
|33
|4889
|93
Report
AI Summary
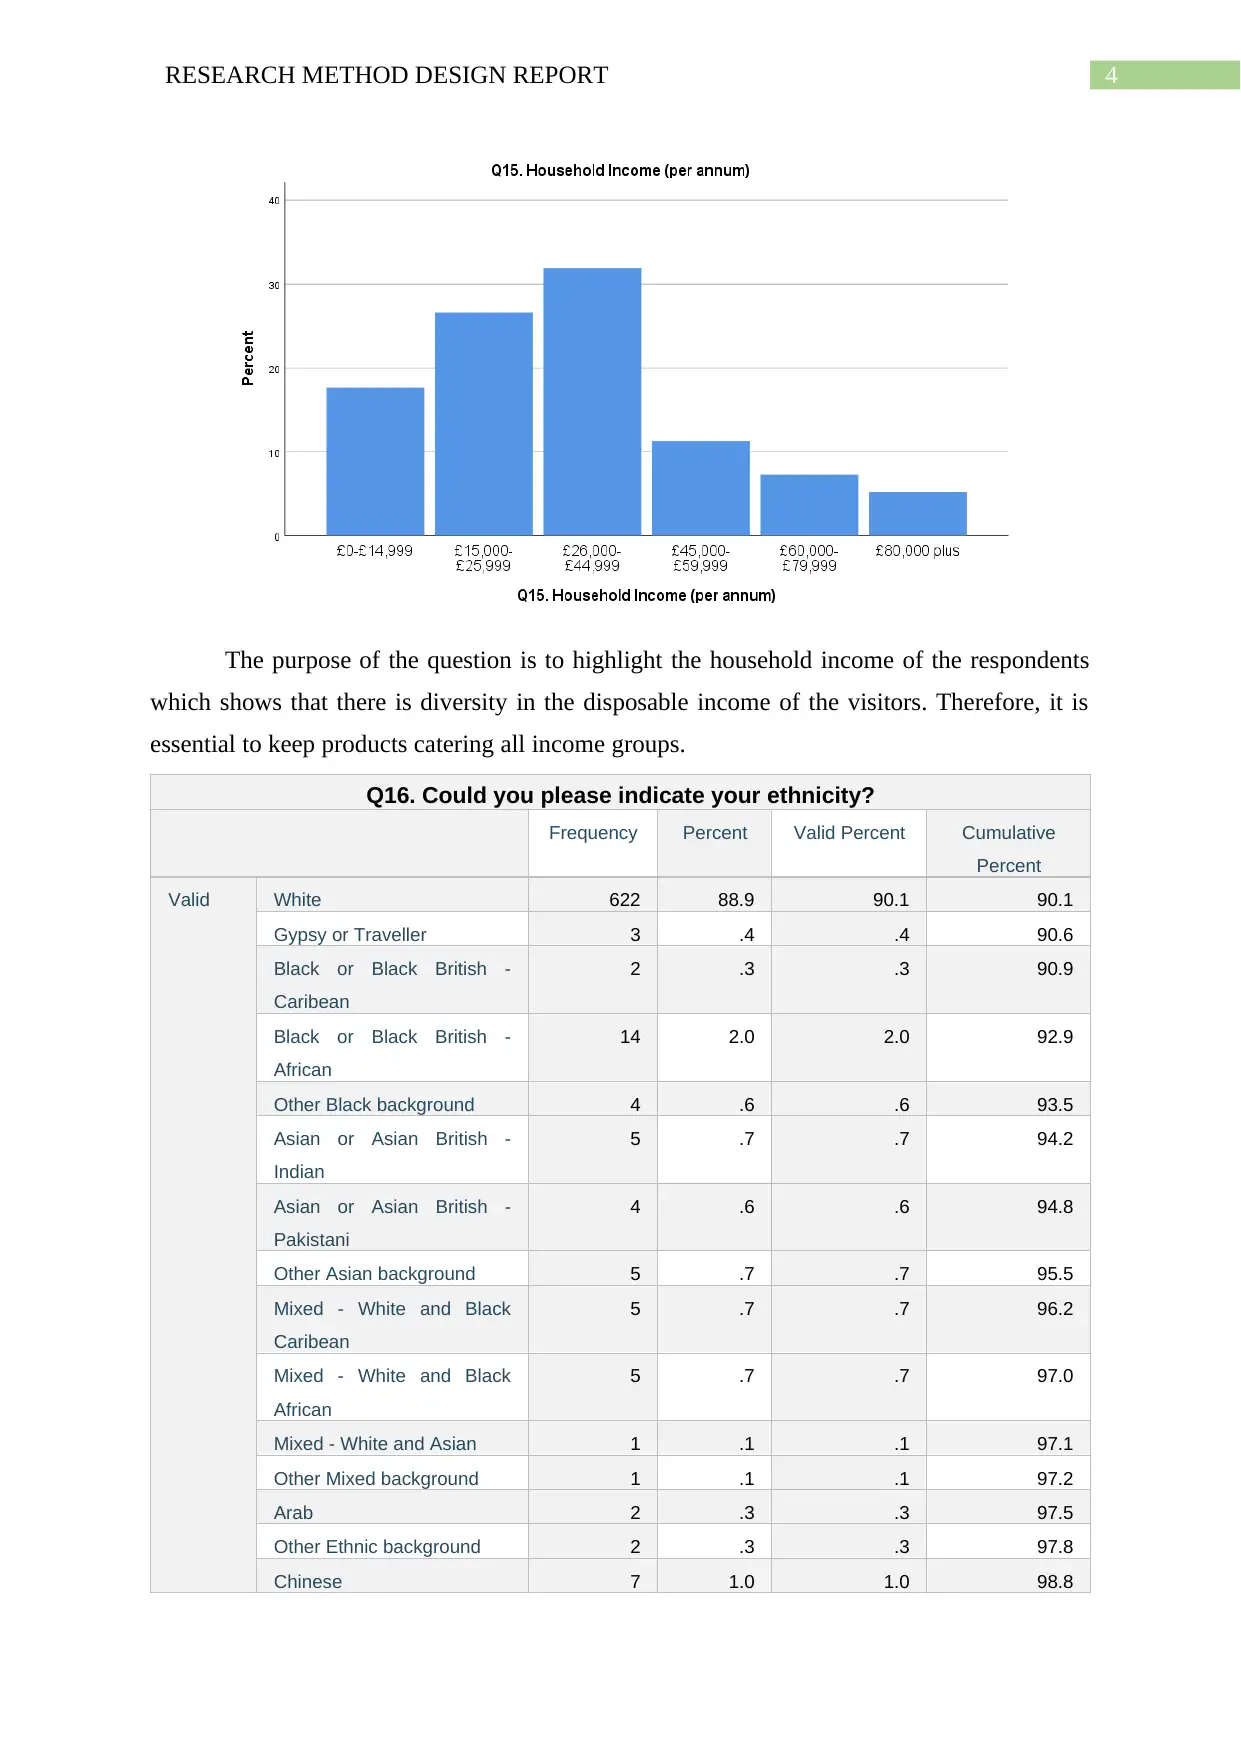
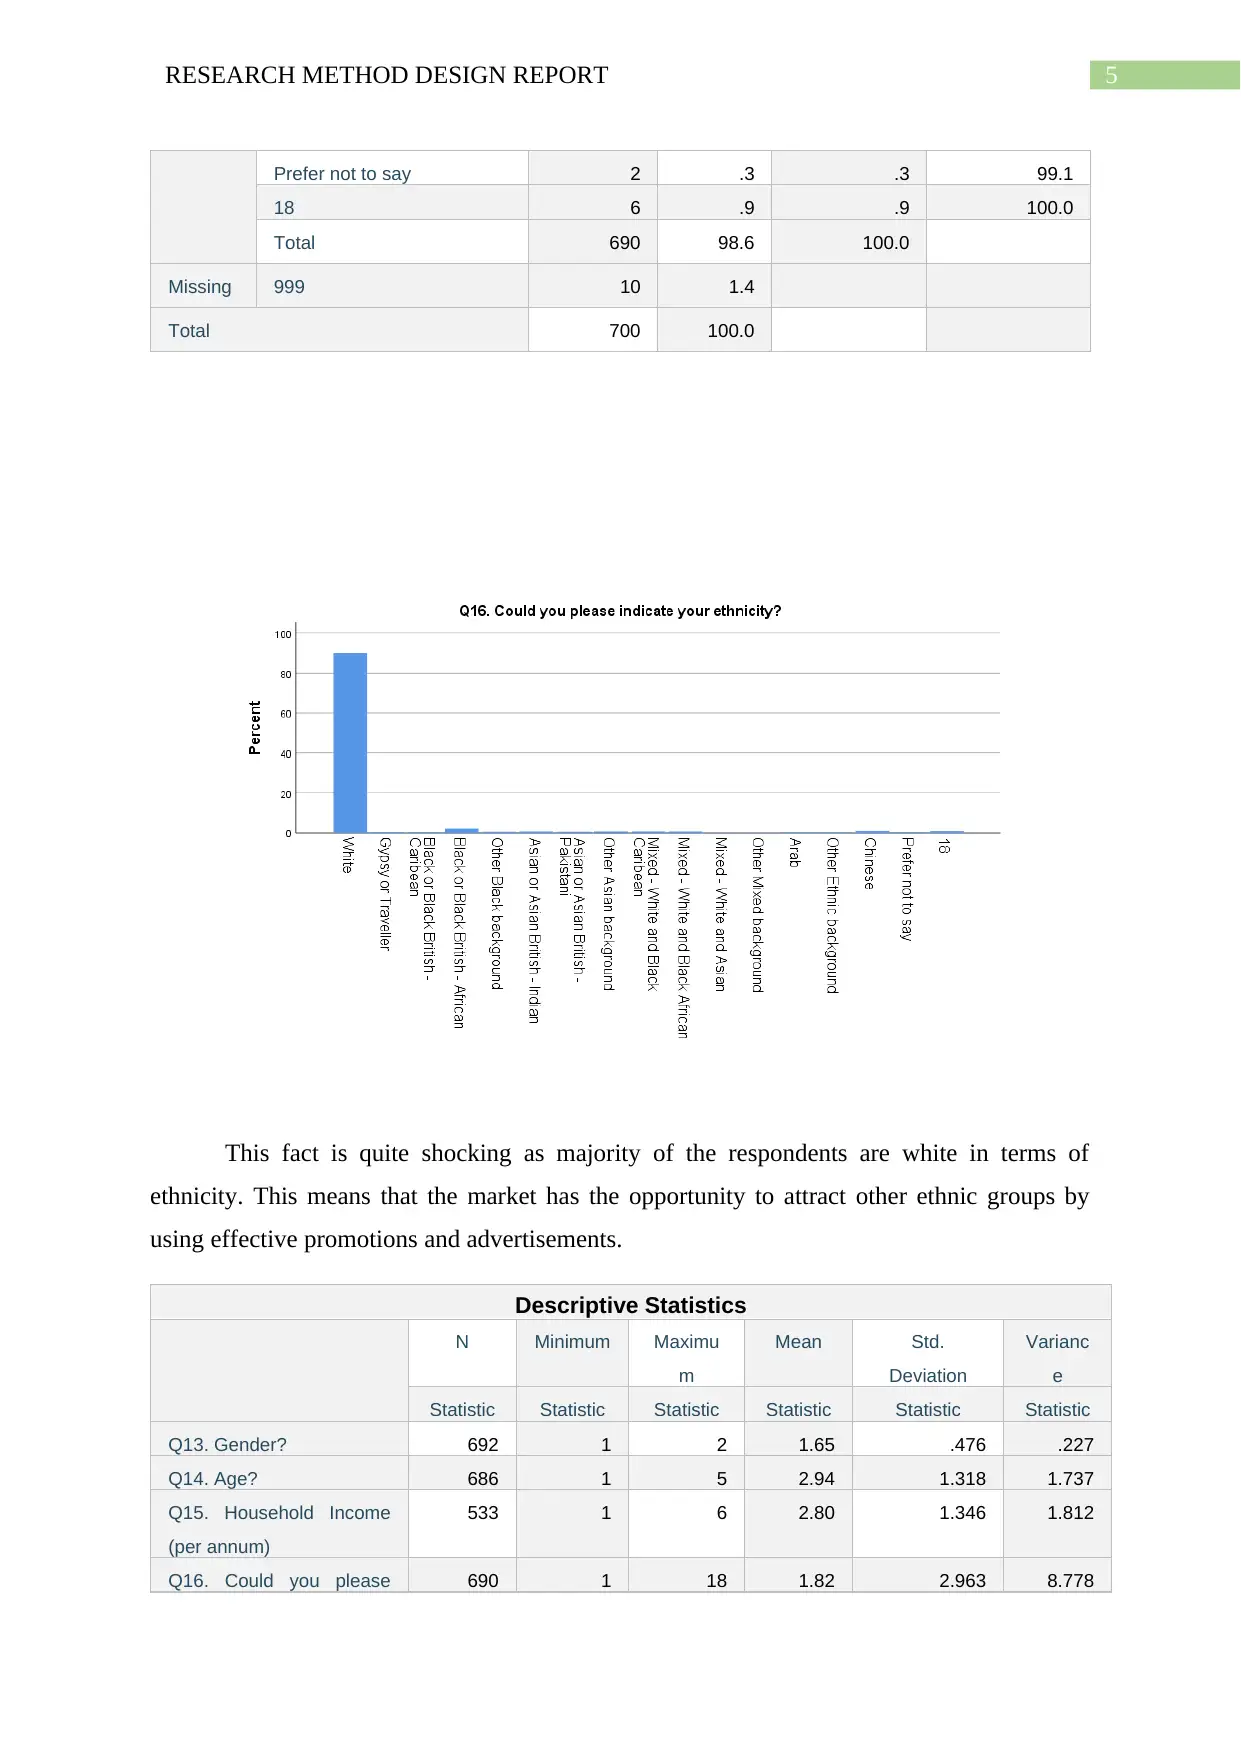
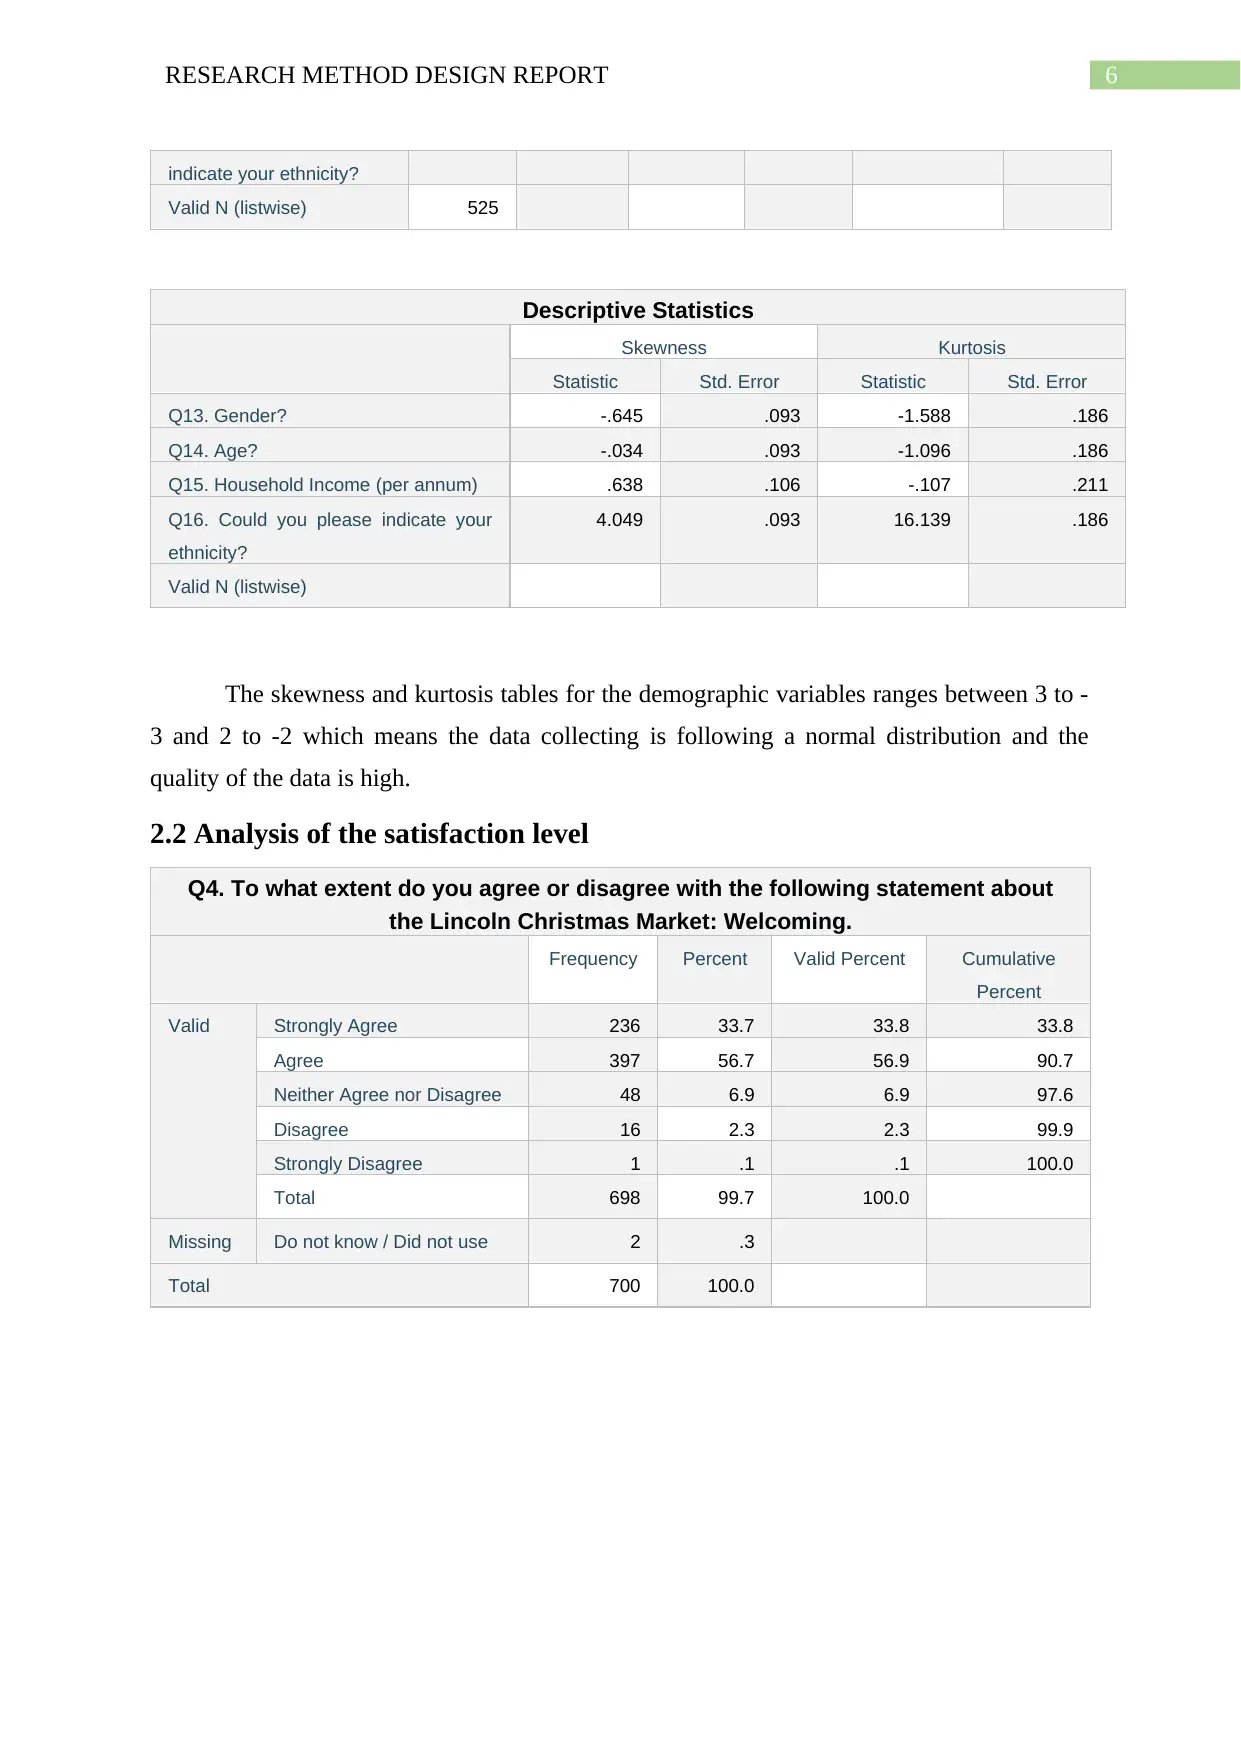
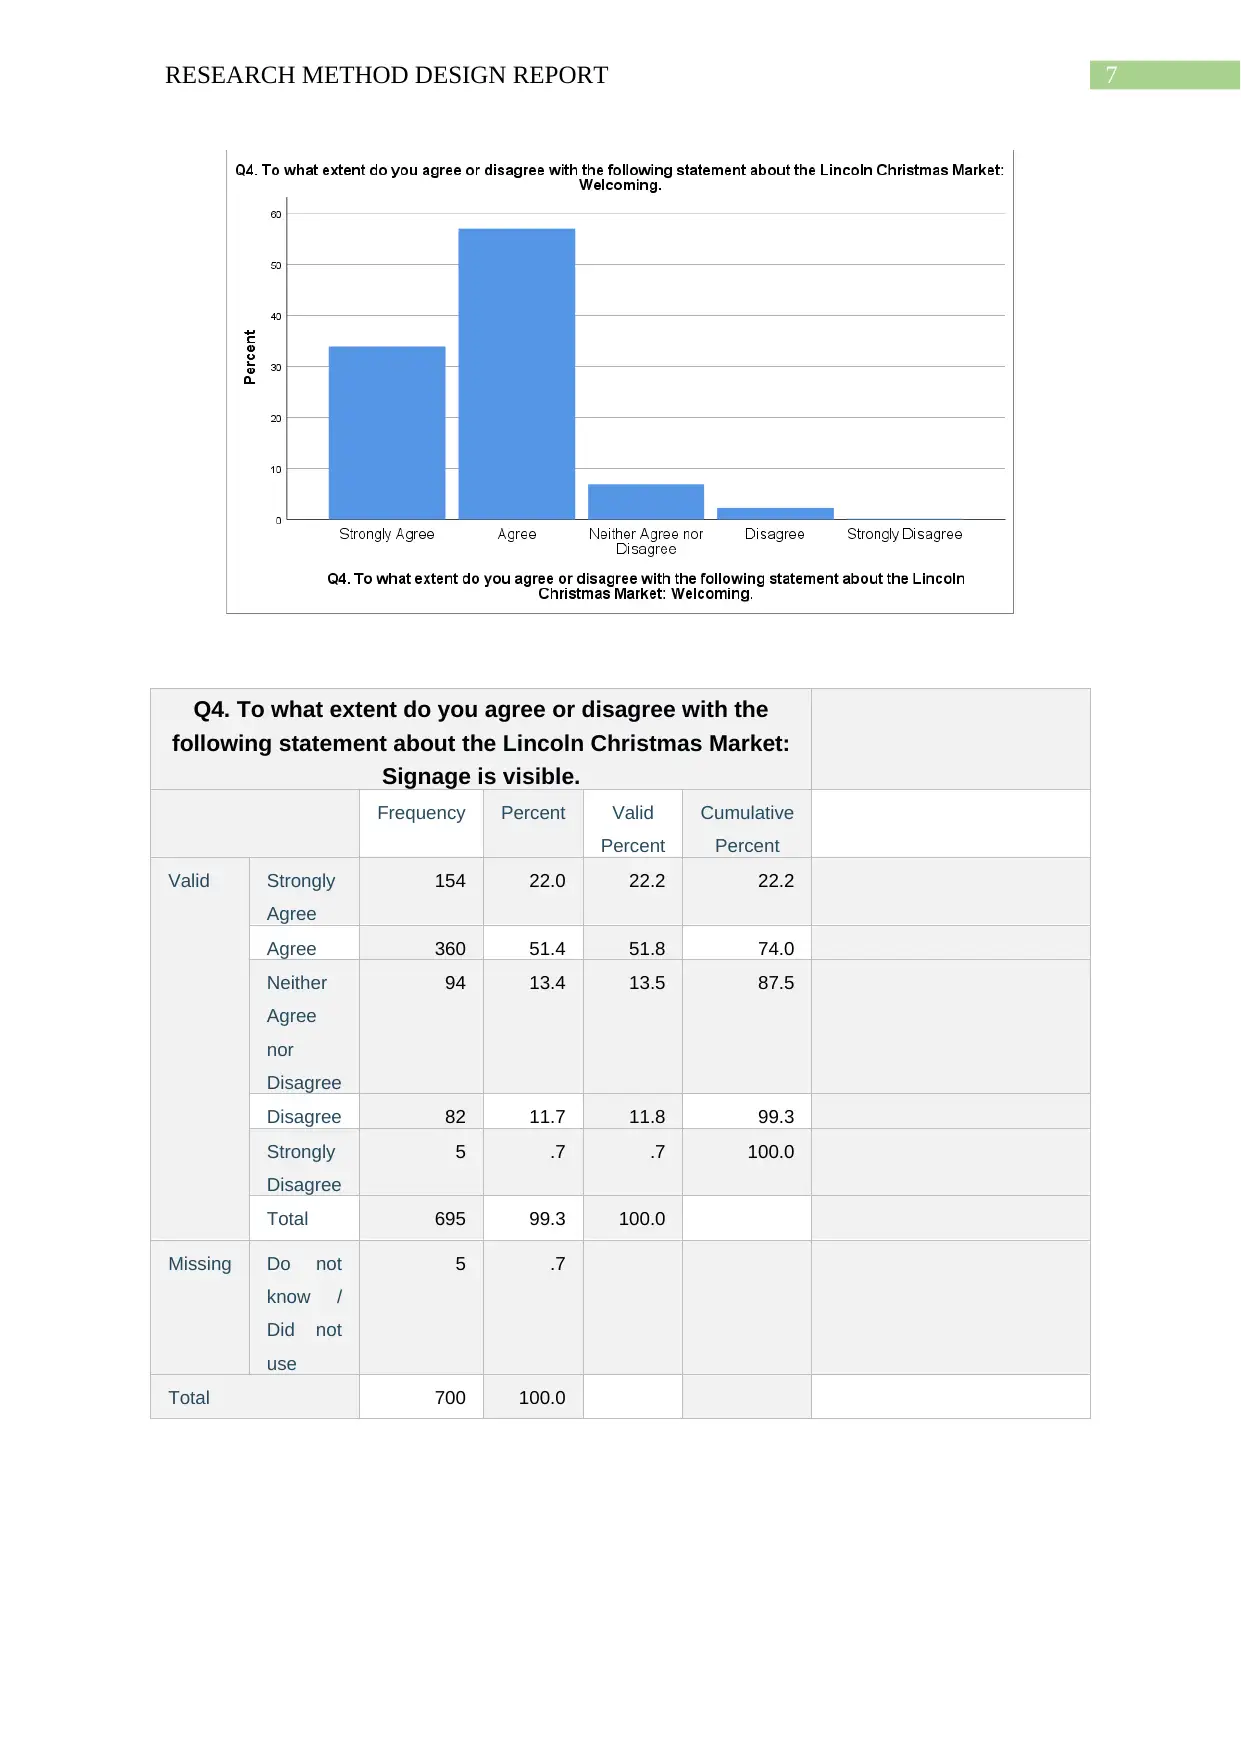
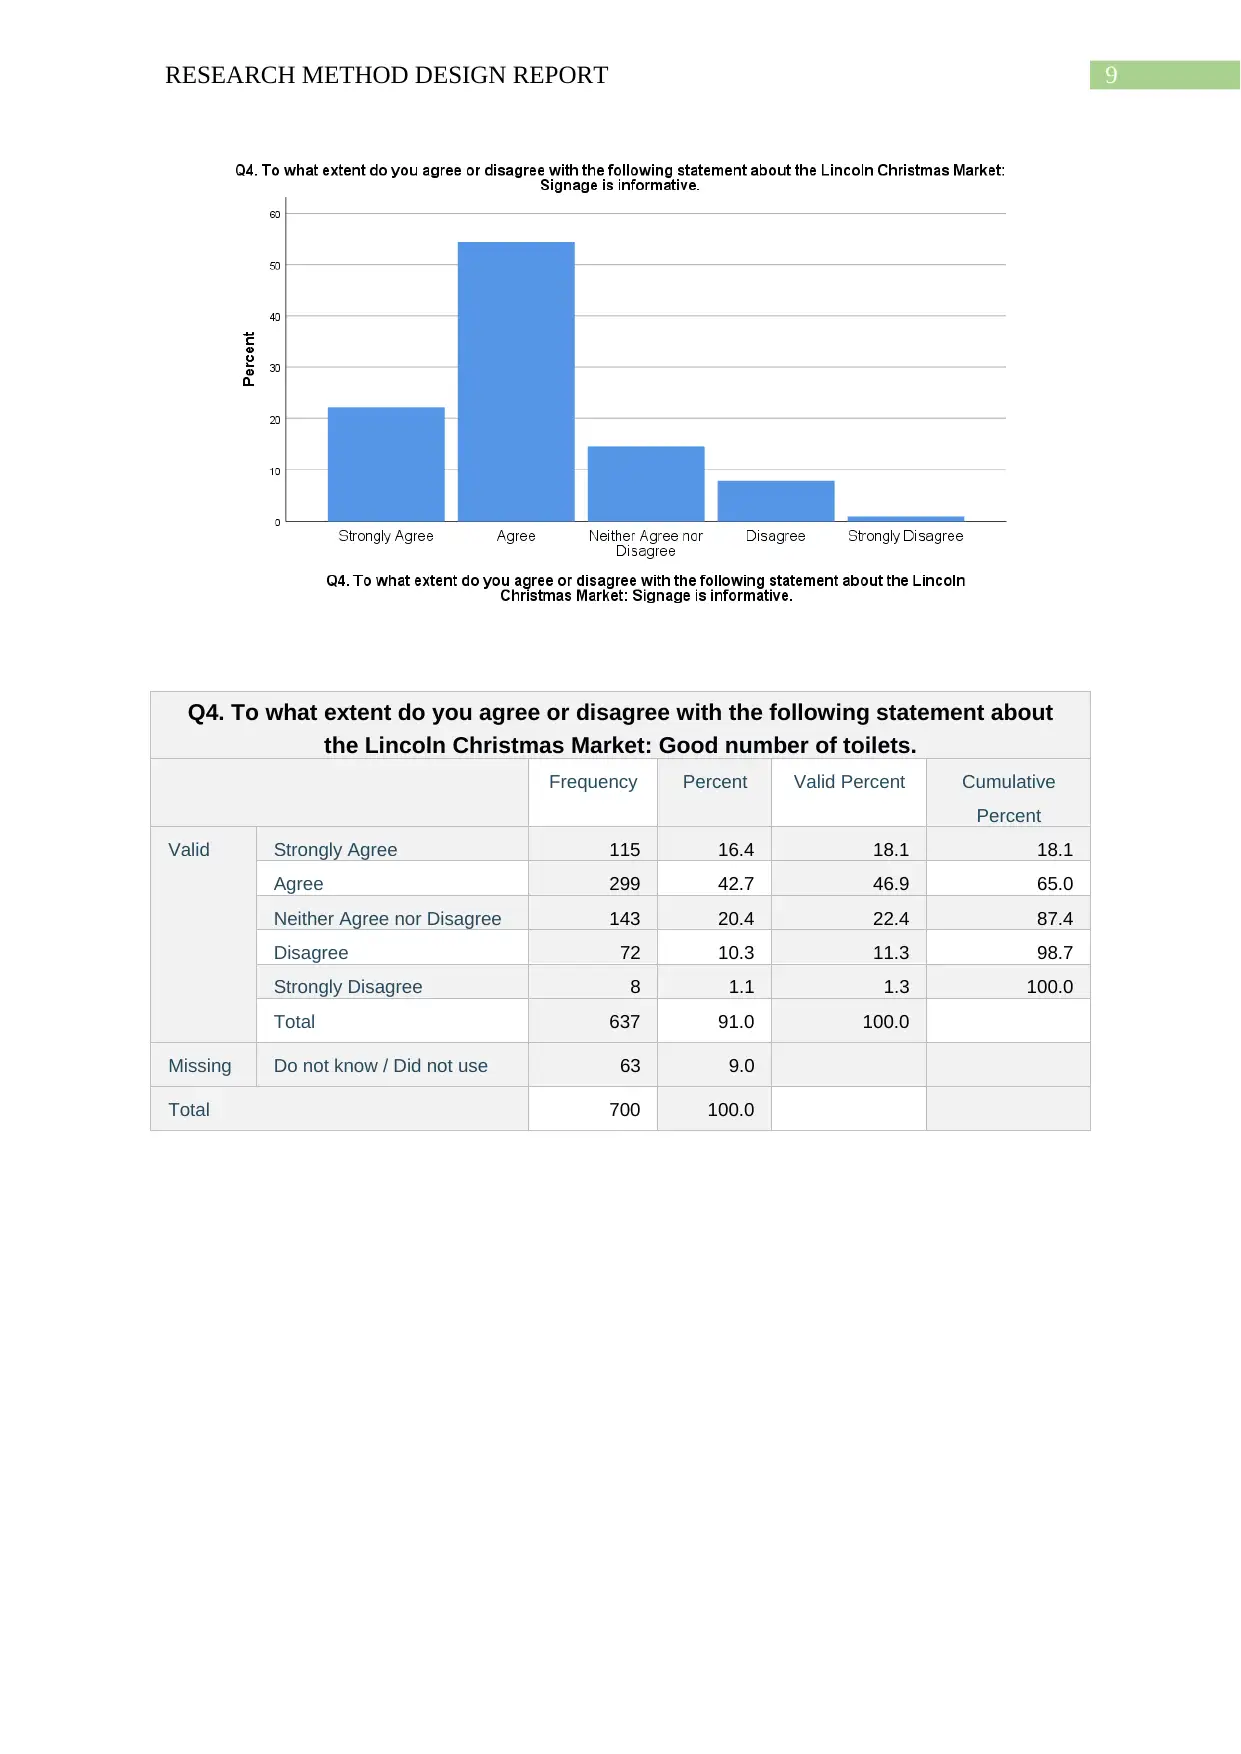
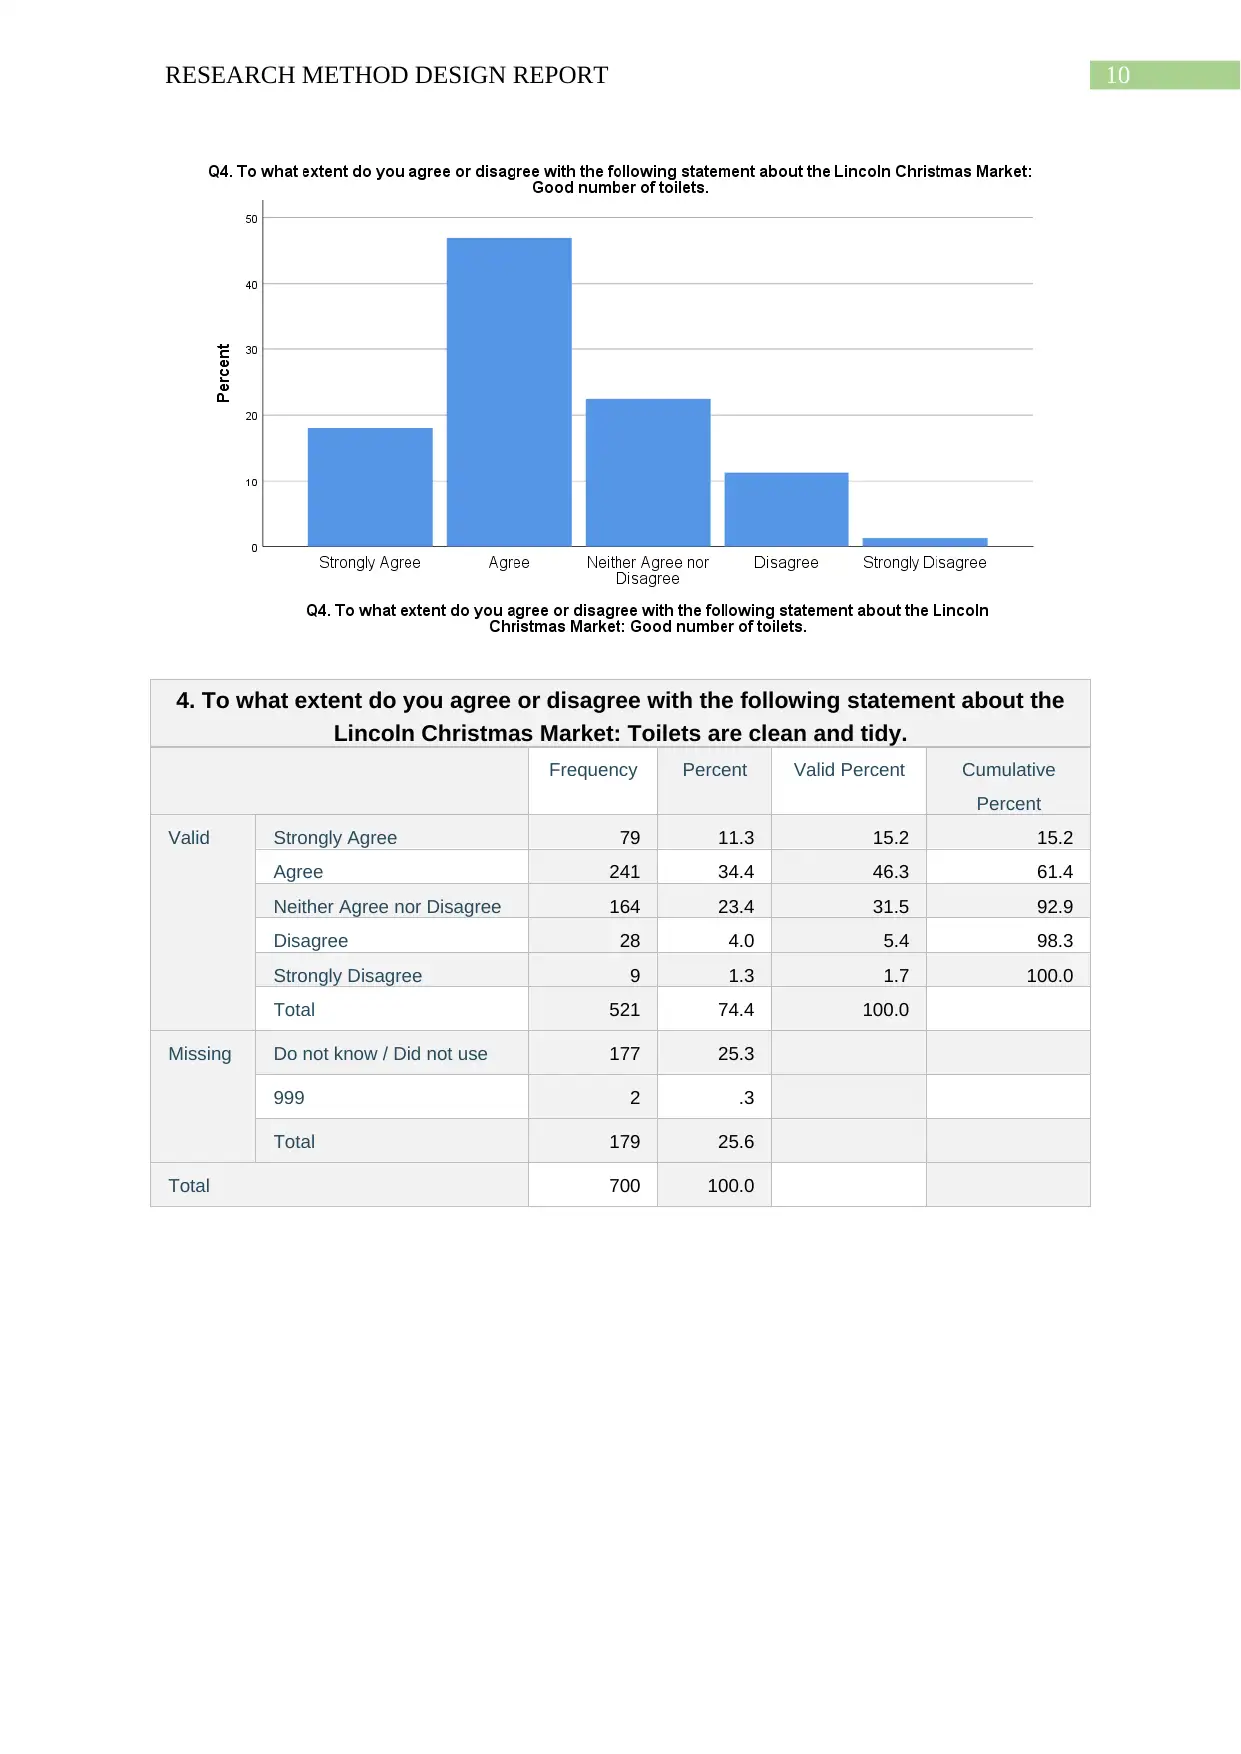
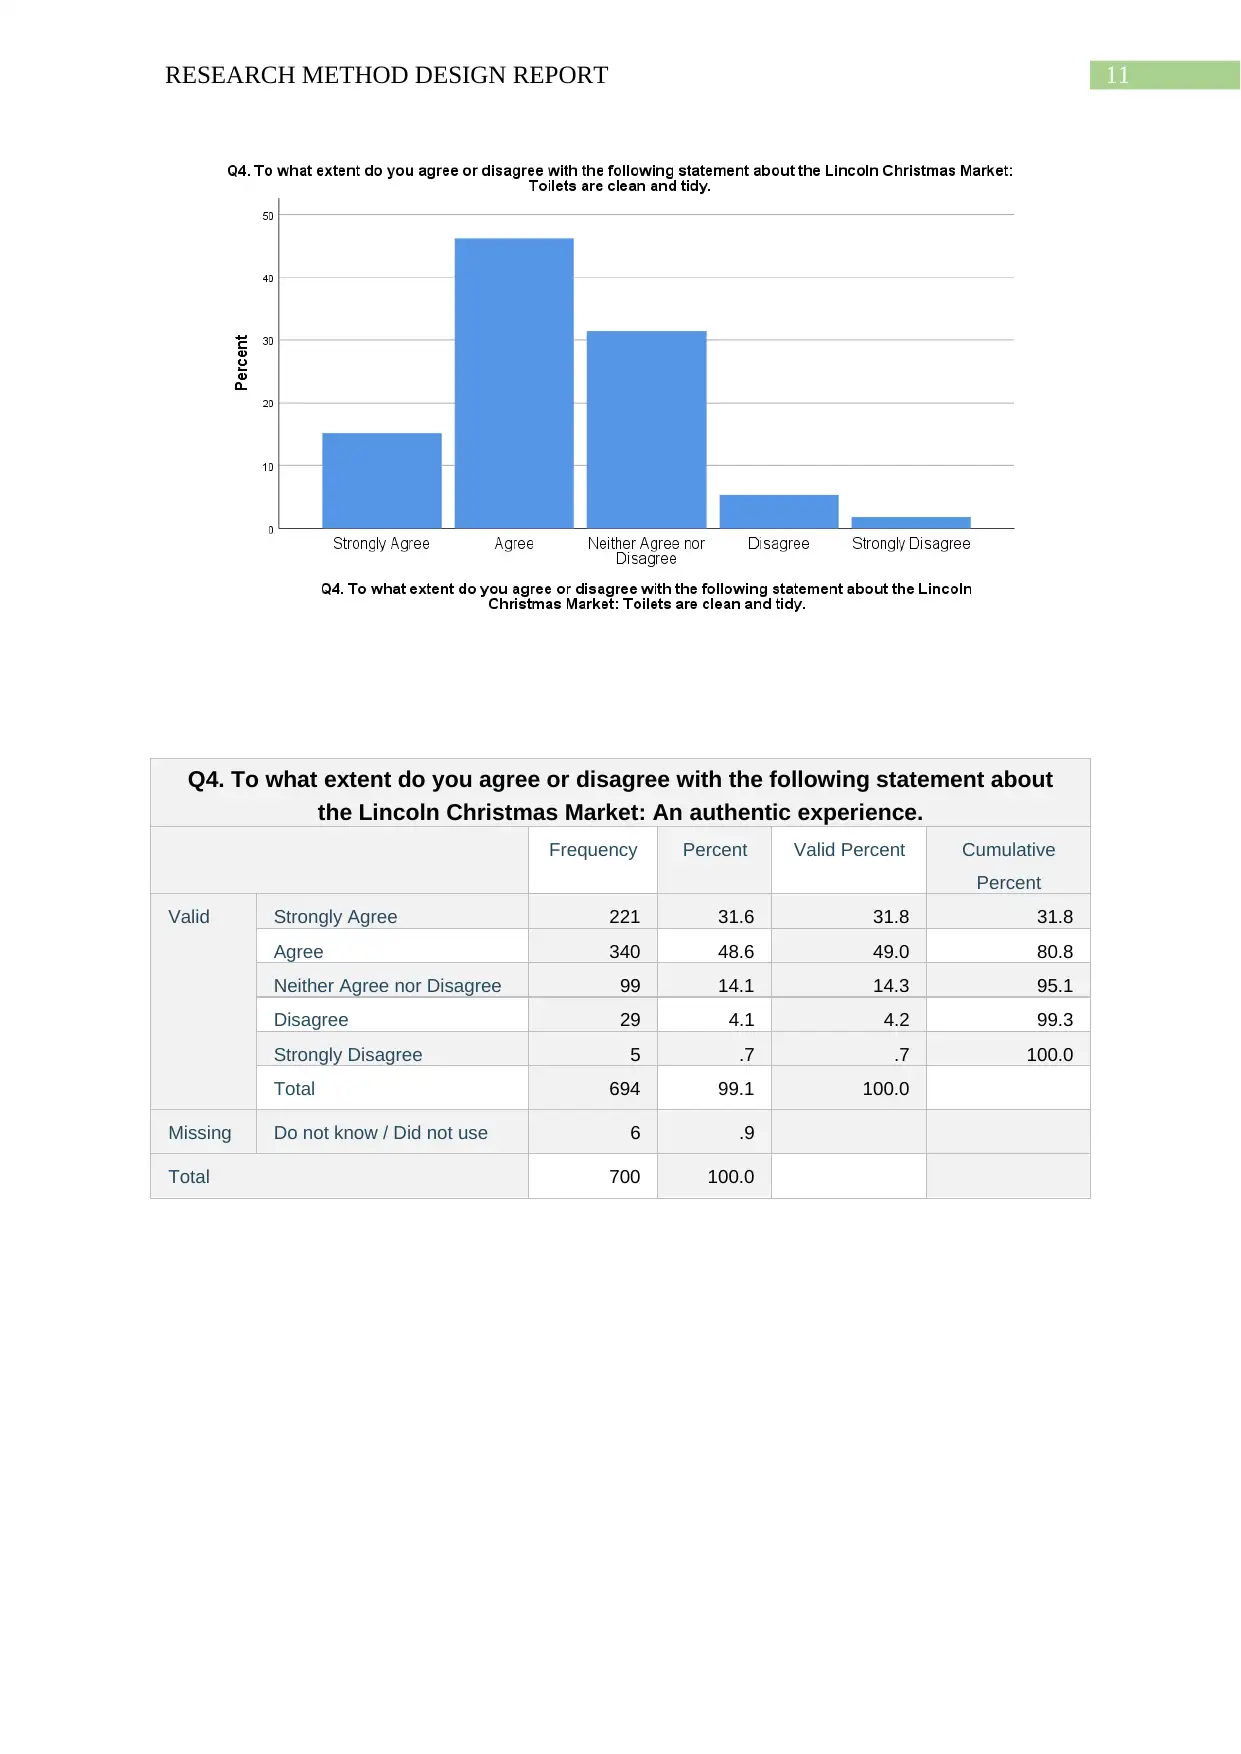
This research method design report provides a detailed analysis of a survey conducted on the Lincoln Christmas Market. The report begins with an evaluation of the questionnaire design, highlighting the use of both quantitative and qualitative questions, with a focus on the quantitative aspects analyzed using SPSS. The data collected through stratified sampling is then analyzed, focusing on demographic data such as gender, age, and household income, revealing key insights into the market's visitor profile. The analysis further explores the satisfaction levels of the visitors through a series of questions on a five-point Likert scale, covering aspects like the welcoming atmosphere, signage, cleanliness, authenticity, and overall experience of the market. The report includes frequency distributions, percentages, and descriptive statistics to illustrate the findings, concluding with an overview of the data's normal distribution and providing valuable insights for understanding consumer behavior and market dynamics.

Running head: RESEARCH METHOD DESIGN REPORT
Research method design report
Name of the student
Name of the university
Author note
Research method design report
Name of the student
Name of the university
Author note
Paraphrase This Document
Need a fresh take? Get an instant paraphrase of this document with our AI Paraphraser

1RESEARCH METHOD DESIGN REPORT
1. Evaluation of questionnaire design
The questionnaire consists of both quantitative and qualitative questions but this
research has focused on only the quantitative questions. The data collected has been analysed
using SPSS (statistical tool for social sciences). This tool has been used to evaluate the
demographic data and conduct chi square on the data collected on five point Likert scale.
The questionnaire consists of questions that are based on ratio scale where 1 equals to
strongly agree and 5 equals to strongly disagree. The other questions are based on multiple
choice and some use open spaces to gather in depth data on the past experiences of the
consumers. The research has conducted an independent study where the data has been
collected using stratified sampling. The population has been developed into strata and
elements have been chosen randomly. The questionnaire is good but further improvement
can be made by including more questions on Five point Likert scale. This will facilitate in
understanding the satisfaction level of the consumers more effectively.
2. Analysis of the survey data
2.1 Analysis of the sample composition
Q13. Gender?
Frequency Percent Valid Percent Cumulative Percent
Valid Male 240 34.3 34.7 34.7
Female 452 64.6 65.3 100.0
Total 692 98.9 100.0
Missing 999 8 1.1
Total 700 100.0

2RESEARCH METHOD DESIGN REPORT
The purpose of the question is to highlight the age of the respondents in the research
and it can be seen that majority of the visitors are female. The number of female visitors in
Lincoln is 64.3% which clearly indicate that women are more interested in attending the
festival than men.
Q14. Age?
Frequency Percent Valid Percent Cumulative
Percent
Valid 22 years or less 134 19.1 19.5 19.5
23-35 years 117 16.7 17.1 36.6
36-50 years 187 26.7 27.3 63.8
51-64 years 151 21.6 22.0 85.9
65 years and over 97 13.9 14.1 100.0
Total 686 98.0 100.0
Missing 999 14 2.0
Total 700 100.0
⊘ This is a preview!⊘
Do you want full access?
Subscribe today to unlock all pages.

Trusted by 1+ million students worldwide

3RESEARCH METHOD DESIGN REPORT
The purpose of the question is to highlight the age of the respondents which shows
that majority of the respondents belong to the age group of 36-50 years closely followed by
the respondents between the age group of 51-64 years with 27% and 22% respondents. On
the other hand, out of the remaining participants, 19% belong to the age group of less than
22years and minimum respondents are above the age group of 65. This shows that the
Lincoln Christmas market attracts a wide range and diversity of visitors.
Q15. Household Income (per annum)
Frequency Percent Valid Percent Cumulative
Percent
Valid £0-£14,999 94 13.4 17.6 17.6
£15,000-£25,999 142 20.3 26.6 44.3
£26,000-£44,999 170 24.3 31.9 76.2
£45,000-£59,999 60 8.6 11.3 87.4
£60,000-£79,999 39 5.6 7.3 94.7
£80,000 plus 28 4.0 5.3 100.0
Total 533 76.1 100.0
Missing 999 167 23.9
Total 700 100.0
Paraphrase This Document
Need a fresh take? Get an instant paraphrase of this document with our AI Paraphraser

4RESEARCH METHOD DESIGN REPORT
The purpose of the question is to highlight the household income of the respondents
which shows that there is diversity in the disposable income of the visitors. Therefore, it is
essential to keep products catering all income groups.
Q16. Could you please indicate your ethnicity?
Frequency Percent Valid Percent Cumulative
Percent
Valid White 622 88.9 90.1 90.1
Gypsy or Traveller 3 .4 .4 90.6
Black or Black British -
Caribean
2 .3 .3 90.9
Black or Black British -
African
14 2.0 2.0 92.9
Other Black background 4 .6 .6 93.5
Asian or Asian British -
Indian
5 .7 .7 94.2
Asian or Asian British -
Pakistani
4 .6 .6 94.8
Other Asian background 5 .7 .7 95.5
Mixed - White and Black
Caribean
5 .7 .7 96.2
Mixed - White and Black
African
5 .7 .7 97.0
Mixed - White and Asian 1 .1 .1 97.1
Other Mixed background 1 .1 .1 97.2
Arab 2 .3 .3 97.5
Other Ethnic background 2 .3 .3 97.8
Chinese 7 1.0 1.0 98.8

5RESEARCH METHOD DESIGN REPORT
Prefer not to say 2 .3 .3 99.1
18 6 .9 .9 100.0
Total 690 98.6 100.0
Missing 999 10 1.4
Total 700 100.0
This fact is quite shocking as majority of the respondents are white in terms of
ethnicity. This means that the market has the opportunity to attract other ethnic groups by
using effective promotions and advertisements.
Descriptive Statistics
N Minimum Maximu
m
Mean Std.
Deviation
Varianc
e
Statistic Statistic Statistic Statistic Statistic Statistic
Q13. Gender? 692 1 2 1.65 .476 .227
Q14. Age? 686 1 5 2.94 1.318 1.737
Q15. Household Income
(per annum)
533 1 6 2.80 1.346 1.812
Q16. Could you please 690 1 18 1.82 2.963 8.778
⊘ This is a preview!⊘
Do you want full access?
Subscribe today to unlock all pages.

Trusted by 1+ million students worldwide

6RESEARCH METHOD DESIGN REPORT
indicate your ethnicity?
Valid N (listwise) 525
Descriptive Statistics
Skewness Kurtosis
Statistic Std. Error Statistic Std. Error
Q13. Gender? -.645 .093 -1.588 .186
Q14. Age? -.034 .093 -1.096 .186
Q15. Household Income (per annum) .638 .106 -.107 .211
Q16. Could you please indicate your
ethnicity?
4.049 .093 16.139 .186
Valid N (listwise)
The skewness and kurtosis tables for the demographic variables ranges between 3 to -
3 and 2 to -2 which means the data collecting is following a normal distribution and the
quality of the data is high.
2.2 Analysis of the satisfaction level
Q4. To what extent do you agree or disagree with the following statement about
the Lincoln Christmas Market: Welcoming.
Frequency Percent Valid Percent Cumulative
Percent
Valid Strongly Agree 236 33.7 33.8 33.8
Agree 397 56.7 56.9 90.7
Neither Agree nor Disagree 48 6.9 6.9 97.6
Disagree 16 2.3 2.3 99.9
Strongly Disagree 1 .1 .1 100.0
Total 698 99.7 100.0
Missing Do not know / Did not use 2 .3
Total 700 100.0
Paraphrase This Document
Need a fresh take? Get an instant paraphrase of this document with our AI Paraphraser

7RESEARCH METHOD DESIGN REPORT
Q4. To what extent do you agree or disagree with the
following statement about the Lincoln Christmas Market:
Signage is visible.
Frequency Percent Valid
Percent
Cumulative
Percent
Valid Strongly
Agree
154 22.0 22.2 22.2
Agree 360 51.4 51.8 74.0
Neither
Agree
nor
Disagree
94 13.4 13.5 87.5
Disagree 82 11.7 11.8 99.3
Strongly
Disagree
5 .7 .7 100.0
Total 695 99.3 100.0
Missing Do not
know /
Did not
use
5 .7
Total 700 100.0

8RESEARCH METHOD DESIGN REPORT
Q4. To what extent do you agree or disagree with the following statement about
the Lincoln Christmas Market: Signage is informative.
Frequency Percent Valid Percent Cumulative
Percent
Valid Strongly Agree 148 21.1 22.2 22.2
Agree 364 52.0 54.5 76.6
Neither Agree nor Disagree 97 13.9 14.5 91.2
Disagree 53 7.6 7.9 99.1
Strongly Disagree 6 .9 .9 100.0
Total 668 95.4 100.0
Missing Do not know / Did not use 32 4.6
Total 700 100.0
⊘ This is a preview!⊘
Do you want full access?
Subscribe today to unlock all pages.

Trusted by 1+ million students worldwide

9RESEARCH METHOD DESIGN REPORT
Q4. To what extent do you agree or disagree with the following statement about
the Lincoln Christmas Market: Good number of toilets.
Frequency Percent Valid Percent Cumulative
Percent
Valid Strongly Agree 115 16.4 18.1 18.1
Agree 299 42.7 46.9 65.0
Neither Agree nor Disagree 143 20.4 22.4 87.4
Disagree 72 10.3 11.3 98.7
Strongly Disagree 8 1.1 1.3 100.0
Total 637 91.0 100.0
Missing Do not know / Did not use 63 9.0
Total 700 100.0
Paraphrase This Document
Need a fresh take? Get an instant paraphrase of this document with our AI Paraphraser

10RESEARCH METHOD DESIGN REPORT
4. To what extent do you agree or disagree with the following statement about the
Lincoln Christmas Market: Toilets are clean and tidy.
Frequency Percent Valid Percent Cumulative
Percent
Valid Strongly Agree 79 11.3 15.2 15.2
Agree 241 34.4 46.3 61.4
Neither Agree nor Disagree 164 23.4 31.5 92.9
Disagree 28 4.0 5.4 98.3
Strongly Disagree 9 1.3 1.7 100.0
Total 521 74.4 100.0
Missing Do not know / Did not use 177 25.3
999 2 .3
Total 179 25.6
Total 700 100.0

11RESEARCH METHOD DESIGN REPORT
Q4. To what extent do you agree or disagree with the following statement about
the Lincoln Christmas Market: An authentic experience.
Frequency Percent Valid Percent Cumulative
Percent
Valid Strongly Agree 221 31.6 31.8 31.8
Agree 340 48.6 49.0 80.8
Neither Agree nor Disagree 99 14.1 14.3 95.1
Disagree 29 4.1 4.2 99.3
Strongly Disagree 5 .7 .7 100.0
Total 694 99.1 100.0
Missing Do not know / Did not use 6 .9
Total 700 100.0
⊘ This is a preview!⊘
Do you want full access?
Subscribe today to unlock all pages.

Trusted by 1+ million students worldwide
1 out of 33