Business Decision Making: Data Analysis and Report - London Restaurant
VerifiedAdded on 2020/01/28
|22
|4215
|491
Report
AI Summary
This report provides a comprehensive analysis of business decision-making using statistical tools and data analysis techniques. It begins with an introduction to the importance of statistical tools in the business world, followed by a detailed plan for collecting primary and secondary data, including sampling methods and questionnaire design. The report then delves into the analysis of the collected data, including the calculation and interpretation of mean, median, mode, standard deviation, quartile, percentile, and correlation. Charts and trend analysis are used to present the data visually. Furthermore, the report includes the application of information processing tools, network diagrams, and project evaluation methods like NPV and IRR to determine the best viable project for the firm. The report concludes with a discussion of the findings and their implications for decision-making, providing a practical application of statistical tools in a business context.

BUSINESS DECISION
MAKING
MAKING
Paraphrase This Document
Need a fresh take? Get an instant paraphrase of this document with our AI Paraphraser
TABLE OF CONTENTS
INTRODUCTION...........................................................................................................................3
TASK 1............................................................................................................................................3
1.1 Plan for collection of primary and secondary data................................................................3
1.2 Sampling method..................................................................................................................3
1.3 Questionnaire for research ..................................................................................................4
TASK 2............................................................................................................................................7
2.1 Information for decision making..........................................................................................7
2.2 Analysis of results to draw conclusion..................................................................................7
2.3 Calculation of standard deviation .........................................................................................8
2.4 Calculation of quartile, percentile and correlation................................................................8
TASK 3............................................................................................................................................9
3.1 Charts on collected data........................................................................................................9
3.2 Trend analysis.....................................................................................................................12
3.3 Covered in PPT...................................................................................................................12
3.4 Formal business report........................................................................................................12
TASK 4..........................................................................................................................................13
4.1 Information processing tools for the business ....................................................................13
4.2 Network diagram.................................................................................................................14
4.3 Project evaluation methods.................................................................................................15
CONCLCUSION ..........................................................................................................................17
REFERENCES..............................................................................................................................18
INDEX OF TABLES
Table 1: Calculation of mean, median and mode............................................................................8
Table 2: Calculation of standard deviation......................................................................................9
Table 3: Calculation of percentile....................................................................................................9
Table 4: Calculation of correlation................................................................................................10
Table 5: Calculation payback period ............................................................................................17
Table 6: Calculation of ARR.........................................................................................................17
Table 7: Calculation of NPV..........................................................................................................18
Table 8: Calculation of IRR...........................................................................................................18
ILLUSTRATION INDEX
Illustration 1: People preferences on dishes...................................................................................11
Illustration 2: People response on factors they often consider while making pricing decisions.. .12
Illustration 3: Trend analysis chart................................................................................................13
Illustration 4: GANTT chart..........................................................................................................15
Illustration 5: Network diagram.....................................................................................................16
⊘ This is a preview!⊘
Do you want full access?
Subscribe today to unlock all pages.
Trusted by 1+ million students worldwide
INTRODUCTION
In today business world managers are giving great importance to the use of statistical tool
as it help in analyzing business conditions in legitimate way. They usually apply statistical tools
like correlation, standard deviation and percentile on available data and make business decisions.
In this report these mentioned tools are applied practically on the data. Apart from this, methods
like NPV and IRR are used to identify best viable project for the firm which is taken in the report
understanding broad application of the mentioned tools. At end CPM diagram is also enclosed
and sequence for performance of activities is determined.
TASK 1
1.1 Plan for collection of primary and secondary data
It is inevitable to collect both sort of data because both help in understanding research
topic in much better way. Primary data refers to data that is gathered by one at his own level. On
other hand, secondary data indicate the facts and figures that are already collected by some one
and are printed in books and journals. There is significance of both type of data in relation to
performance of research. It has been find out that researchers often collect secondary data before
conducting a research because be evaluating various literature's they comes to know about
various things that happened in past related to research topic (Blake and Isard, 2012). Such kind
of knowledge of research topic help an individual in determining a direction in which research
must be conducted. Hence, it can be said that understanding of secondary data help an individual
in drafting a questionnaire for the research. Hence, it can be said that there is great significance
of primary and secondary data in research. As per plan prepared from sources like books and
magazines relevant facts and figures will be collected by the researcher. On other hand, for
collecting new facts and figures questionnaire will be circulated between 50 people that live in
the London. These ways will be followed to collect data for the research.
1.2 Sampling method
There are many sampling methods and some of them are described below. Simple random sampling- This is widely used methods of sampling and under this all
sampling units are taken on random basis from population. This method can be easily
used by any person. Simple random sampling method is used in any research when for
data collection specific type of respondents are not required.
Paraphrase This Document
Need a fresh take? Get an instant paraphrase of this document with our AI Paraphraser
Stratified random sampling- Under this method all sampling units are taken by dividing
population in several parts. From these sub divisions of population sample units are taken
by the researcher. Hence, this method is appropriate for research because by using same
data can be collected from different type of people in relation to present study. Convenience sampling- This is a method in which one according to his comfort take
sample units from sample (Ackermann, 2012). This method is used by many researchers
instead of simple random sampling.
Cluster sampling- In this technique specific area is separated in various parts. All
sample units are picked up from these divided areas. The mentioned technique can not be
employed in the research because for research specific type of respondents are required
that vary from each other in terms of demographic features.
1.3 Questionnaire for research
Name : ___________________
Age : ____________________
Marital status
Married
Unmarried
Transgender
Gender
Male
Female
Transgender
1. In which of following category of income below given you fall.
2000 - 3000
3100 - 4000
4100- 5000
More than 5000
2. How many times you visit to Murano restaurant in a month?
1- 2
3 - 4
5 - 6
Greater than 6 times
3. When you go to the Murano restaurant for lunch or dinner how many times you place order
for food items?
1
2
3
More than 3 time
4. Which type of dishes given below you prefers for lunch or dinner?
European
Italian
Mexican
Chinese
5. Which of these factors you highly consider for taking lunch or dinner at restaurant?
Price
Taste
Staff service
Waiting time
6. Do you think that Murano restaurant is providing products at high price.
Yes
⊘ This is a preview!⊘
Do you want full access?
Subscribe today to unlock all pages.
Trusted by 1+ million students worldwide
No
7. In which of below given categories services offered by Murano comes?
Exceptional
Very good
Good
Average
Poor
8. On which of special occasions you like to visit Murano restaurant?
Birthday
Wedding anniversary
New year
Valentine day
Working holidays
9. Your feedback on our services.
___________________________________________________________________________
TASK 2
2.1 Information for decision making
Table 1: Calculation of average, median and mode
1 30000
2 35000
Paraphrase This Document
Need a fresh take? Get an instant paraphrase of this document with our AI Paraphraser
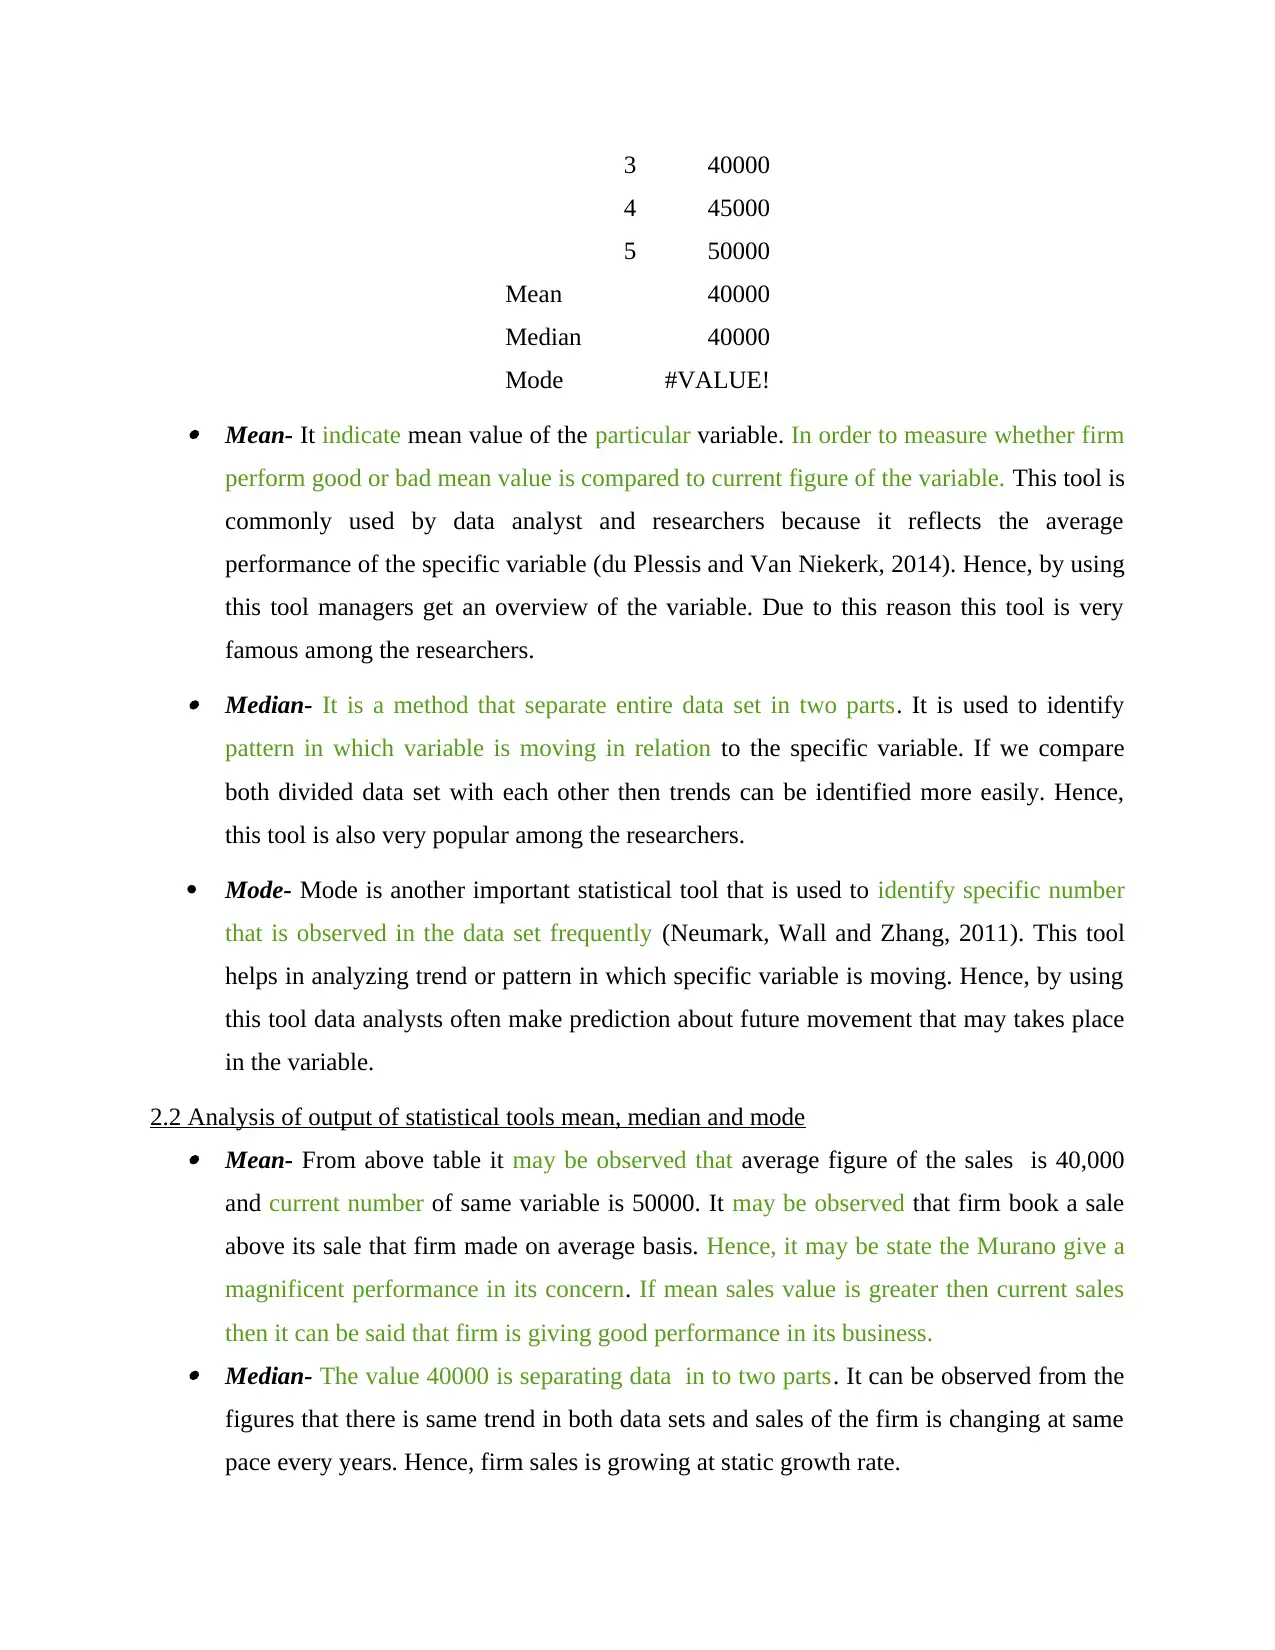
3 40000
4 45000
5 50000
Mean 40000
Median 40000
Mode #VALUE! Mean- It indicate mean value of the particular variable. In order to measure whether firm
perform good or bad mean value is compared to current figure of the variable. This tool is
commonly used by data analyst and researchers because it reflects the average
performance of the specific variable (du Plessis and Van Niekerk, 2014). Hence, by using
this tool managers get an overview of the variable. Due to this reason this tool is very
famous among the researchers. Median- It is a method that separate entire data set in two parts. It is used to identify
pattern in which variable is moving in relation to the specific variable. If we compare
both divided data set with each other then trends can be identified more easily. Hence,
this tool is also very popular among the researchers.
Mode- Mode is another important statistical tool that is used to identify specific number
that is observed in the data set frequently (Neumark, Wall and Zhang, 2011). This tool
helps in analyzing trend or pattern in which specific variable is moving. Hence, by using
this tool data analysts often make prediction about future movement that may takes place
in the variable.
2.2 Analysis of output of statistical tools mean, median and mode Mean- From above table it may be observed that average figure of the sales is 40,000
and current number of same variable is 50000. It may be observed that firm book a sale
above its sale that firm made on average basis. Hence, it may be state the Murano give a
magnificent performance in its concern. If mean sales value is greater then current sales
then it can be said that firm is giving good performance in its business. Median- The value 40000 is separating data in to two parts. It can be observed from the
figures that there is same trend in both data sets and sales of the firm is changing at same
pace every years. Hence, firm sales is growing at static growth rate.
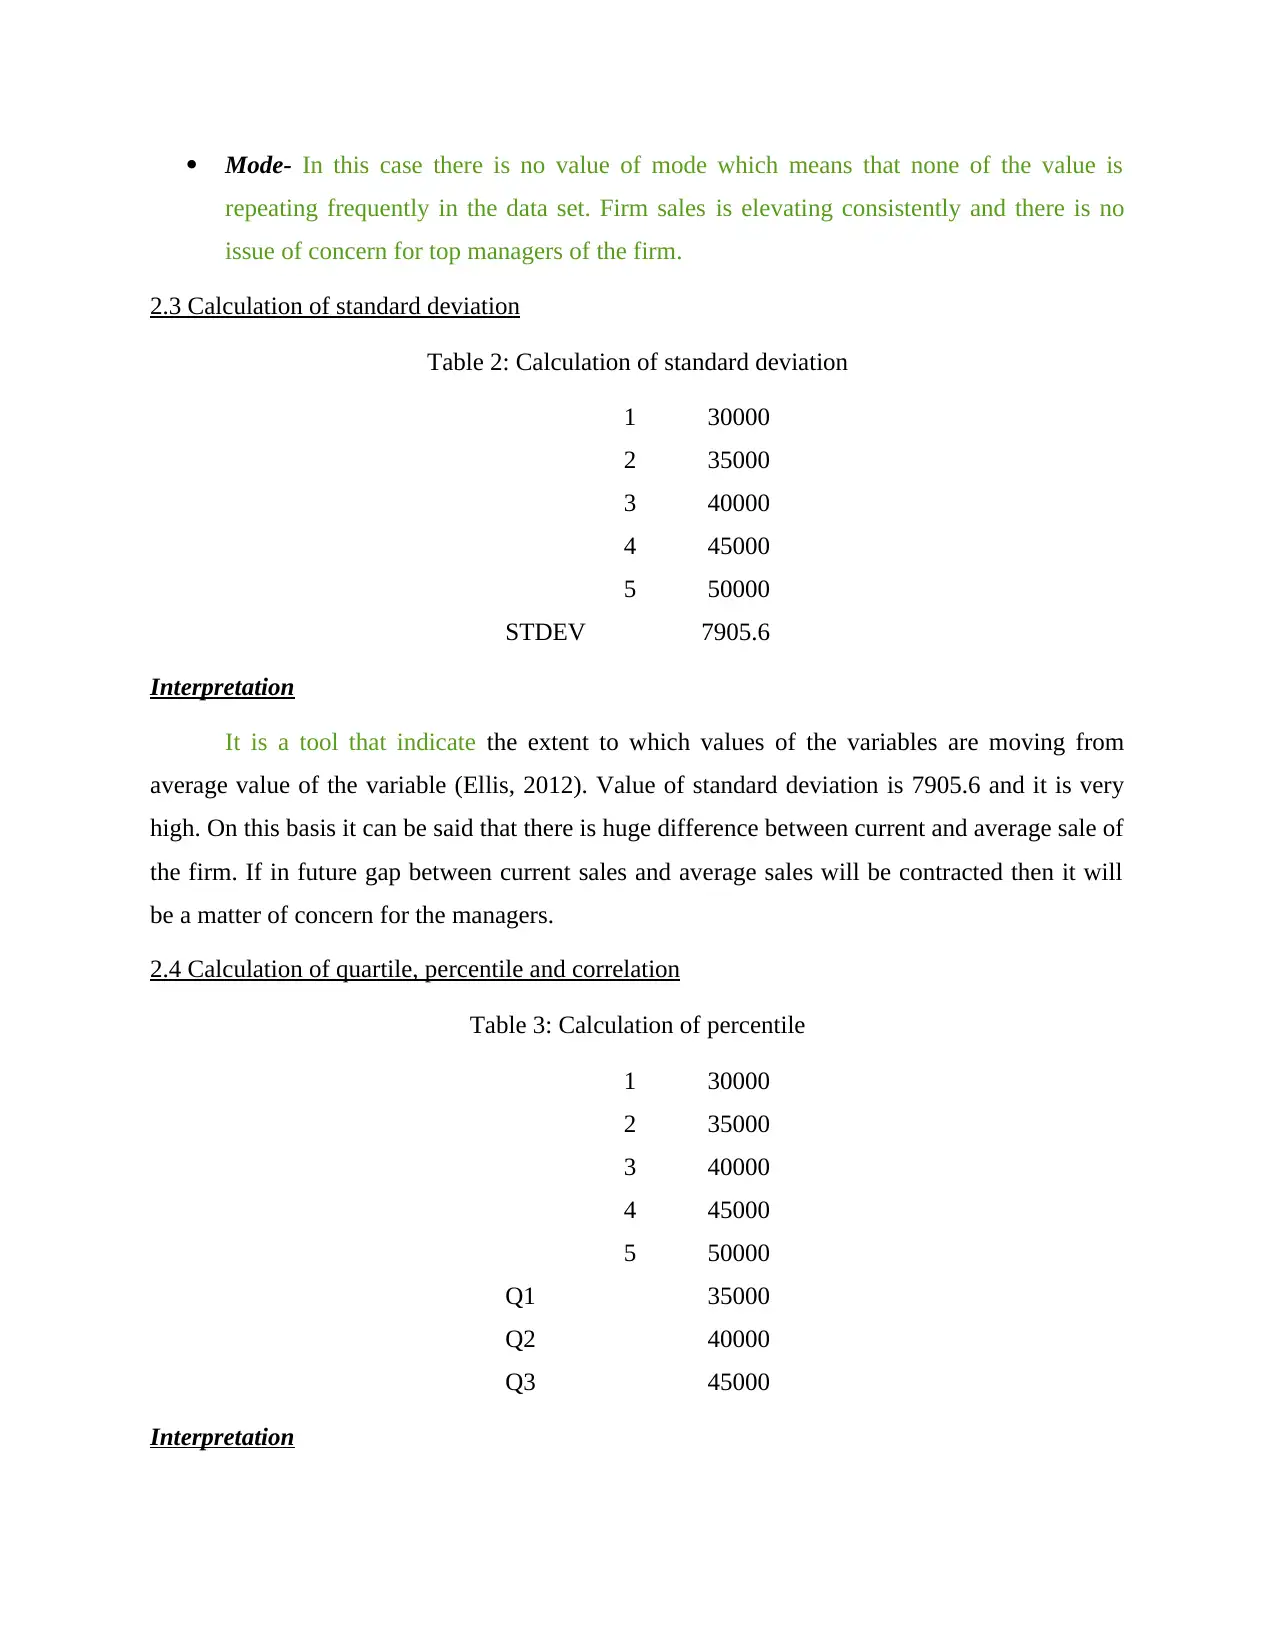
Mode- In this case there is no value of mode which means that none of the value is
repeating frequently in the data set. Firm sales is elevating consistently and there is no
issue of concern for top managers of the firm.
2.3 Calculation of standard deviation
Table 2: Calculation of standard deviation
1 30000
2 35000
3 40000
4 45000
5 50000
STDEV 7905.6
Interpretation
It is a tool that indicate the extent to which values of the variables are moving from
average value of the variable (Ellis, 2012). Value of standard deviation is 7905.6 and it is very
high. On this basis it can be said that there is huge difference between current and average sale of
the firm. If in future gap between current sales and average sales will be contracted then it will
be a matter of concern for the managers.
2.4 Calculation of quartile, percentile and correlation
Table 3: Calculation of percentile
1 30000
2 35000
3 40000
4 45000
5 50000
Q1 35000
Q2 40000
Q3 45000
Interpretation
⊘ This is a preview!⊘
Do you want full access?
Subscribe today to unlock all pages.
Trusted by 1+ million students worldwide
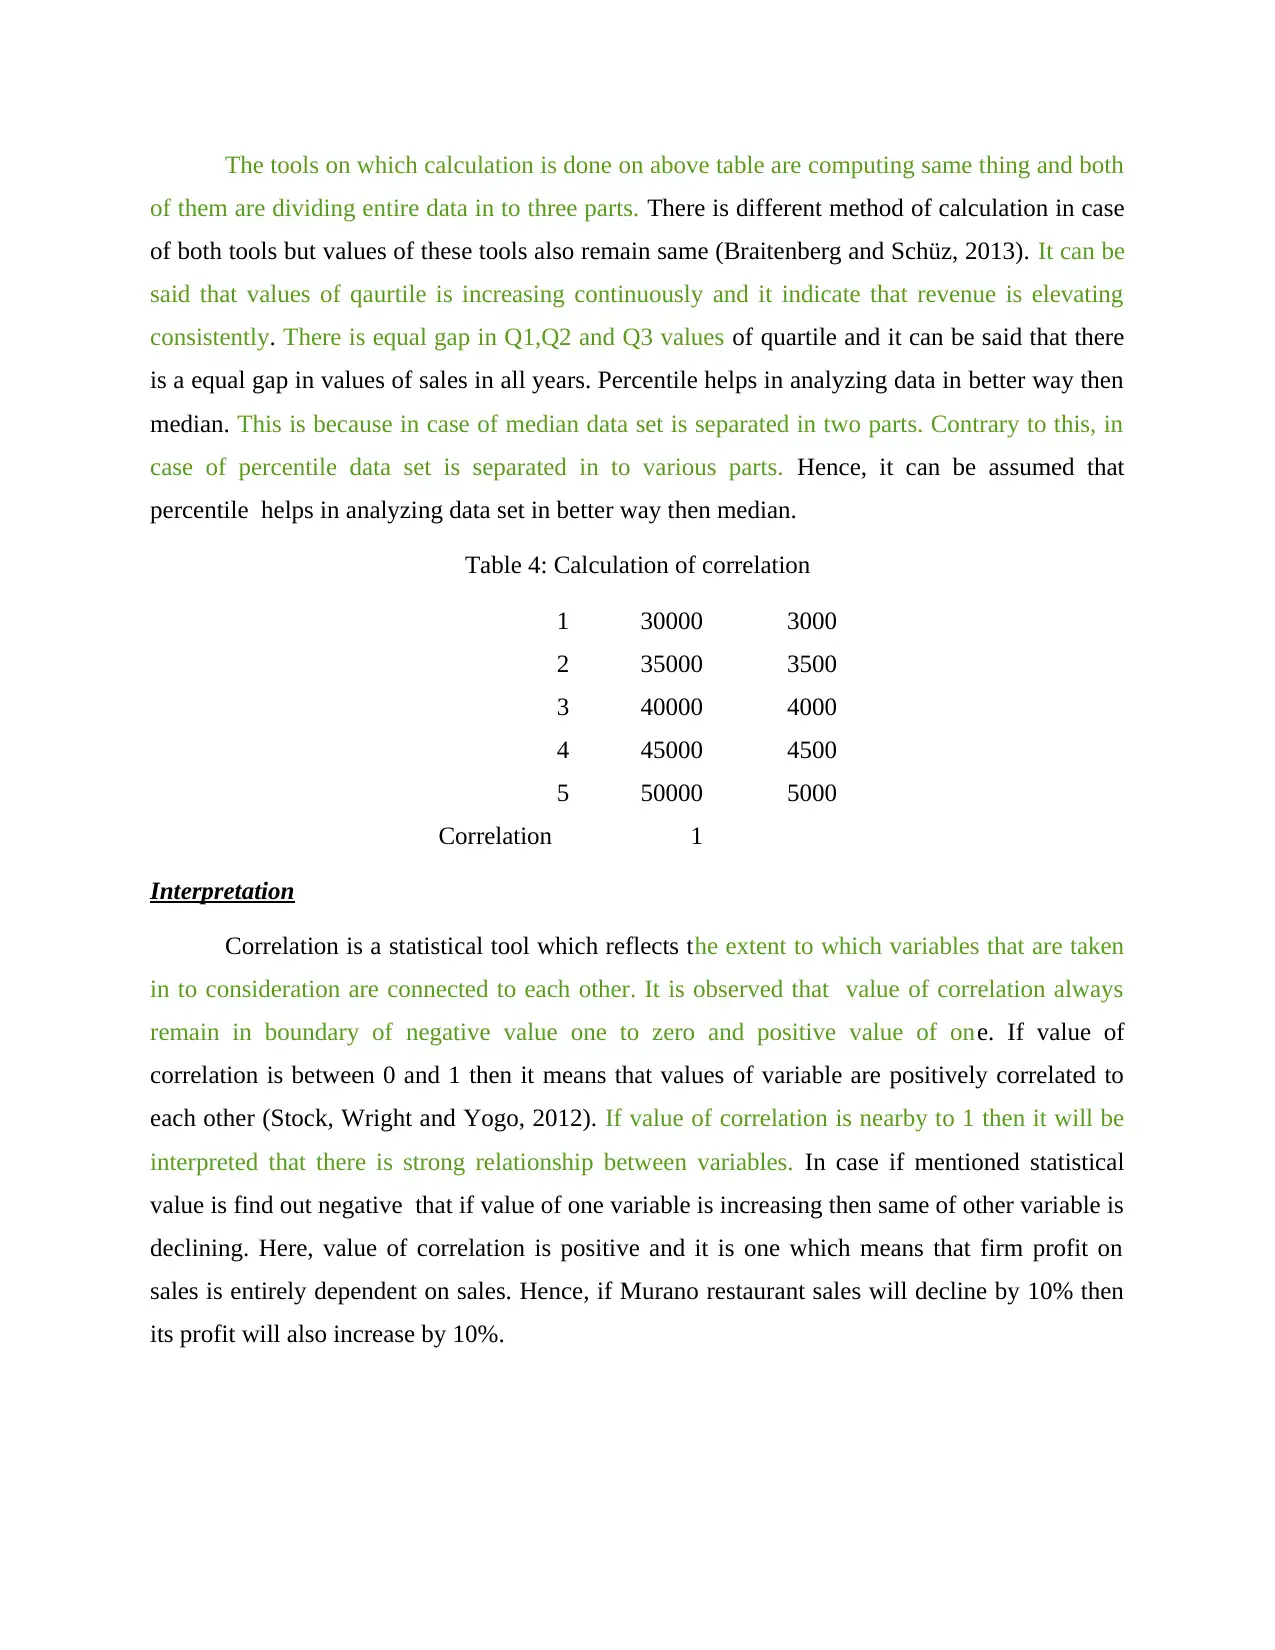
The tools on which calculation is done on above table are computing same thing and both
of them are dividing entire data in to three parts. There is different method of calculation in case
of both tools but values of these tools also remain same (Braitenberg and Schüz, 2013). It can be
said that values of qaurtile is increasing continuously and it indicate that revenue is elevating
consistently. There is equal gap in Q1,Q2 and Q3 values of quartile and it can be said that there
is a equal gap in values of sales in all years. Percentile helps in analyzing data in better way then
median. This is because in case of median data set is separated in two parts. Contrary to this, in
case of percentile data set is separated in to various parts. Hence, it can be assumed that
percentile helps in analyzing data set in better way then median.
Table 4: Calculation of correlation
1 30000 3000
2 35000 3500
3 40000 4000
4 45000 4500
5 50000 5000
Correlation 1
Interpretation
Correlation is a statistical tool which reflects the extent to which variables that are taken
in to consideration are connected to each other. It is observed that value of correlation always
remain in boundary of negative value one to zero and positive value of one. If value of
correlation is between 0 and 1 then it means that values of variable are positively correlated to
each other (Stock, Wright and Yogo, 2012). If value of correlation is nearby to 1 then it will be
interpreted that there is strong relationship between variables. In case if mentioned statistical
value is find out negative that if value of one variable is increasing then same of other variable is
declining. Here, value of correlation is positive and it is one which means that firm profit on
sales is entirely dependent on sales. Hence, if Murano restaurant sales will decline by 10% then
its profit will also increase by 10%.
Paraphrase This Document
Need a fresh take? Get an instant paraphrase of this document with our AI Paraphraser
TASK 3
3.1 Charts on collected data
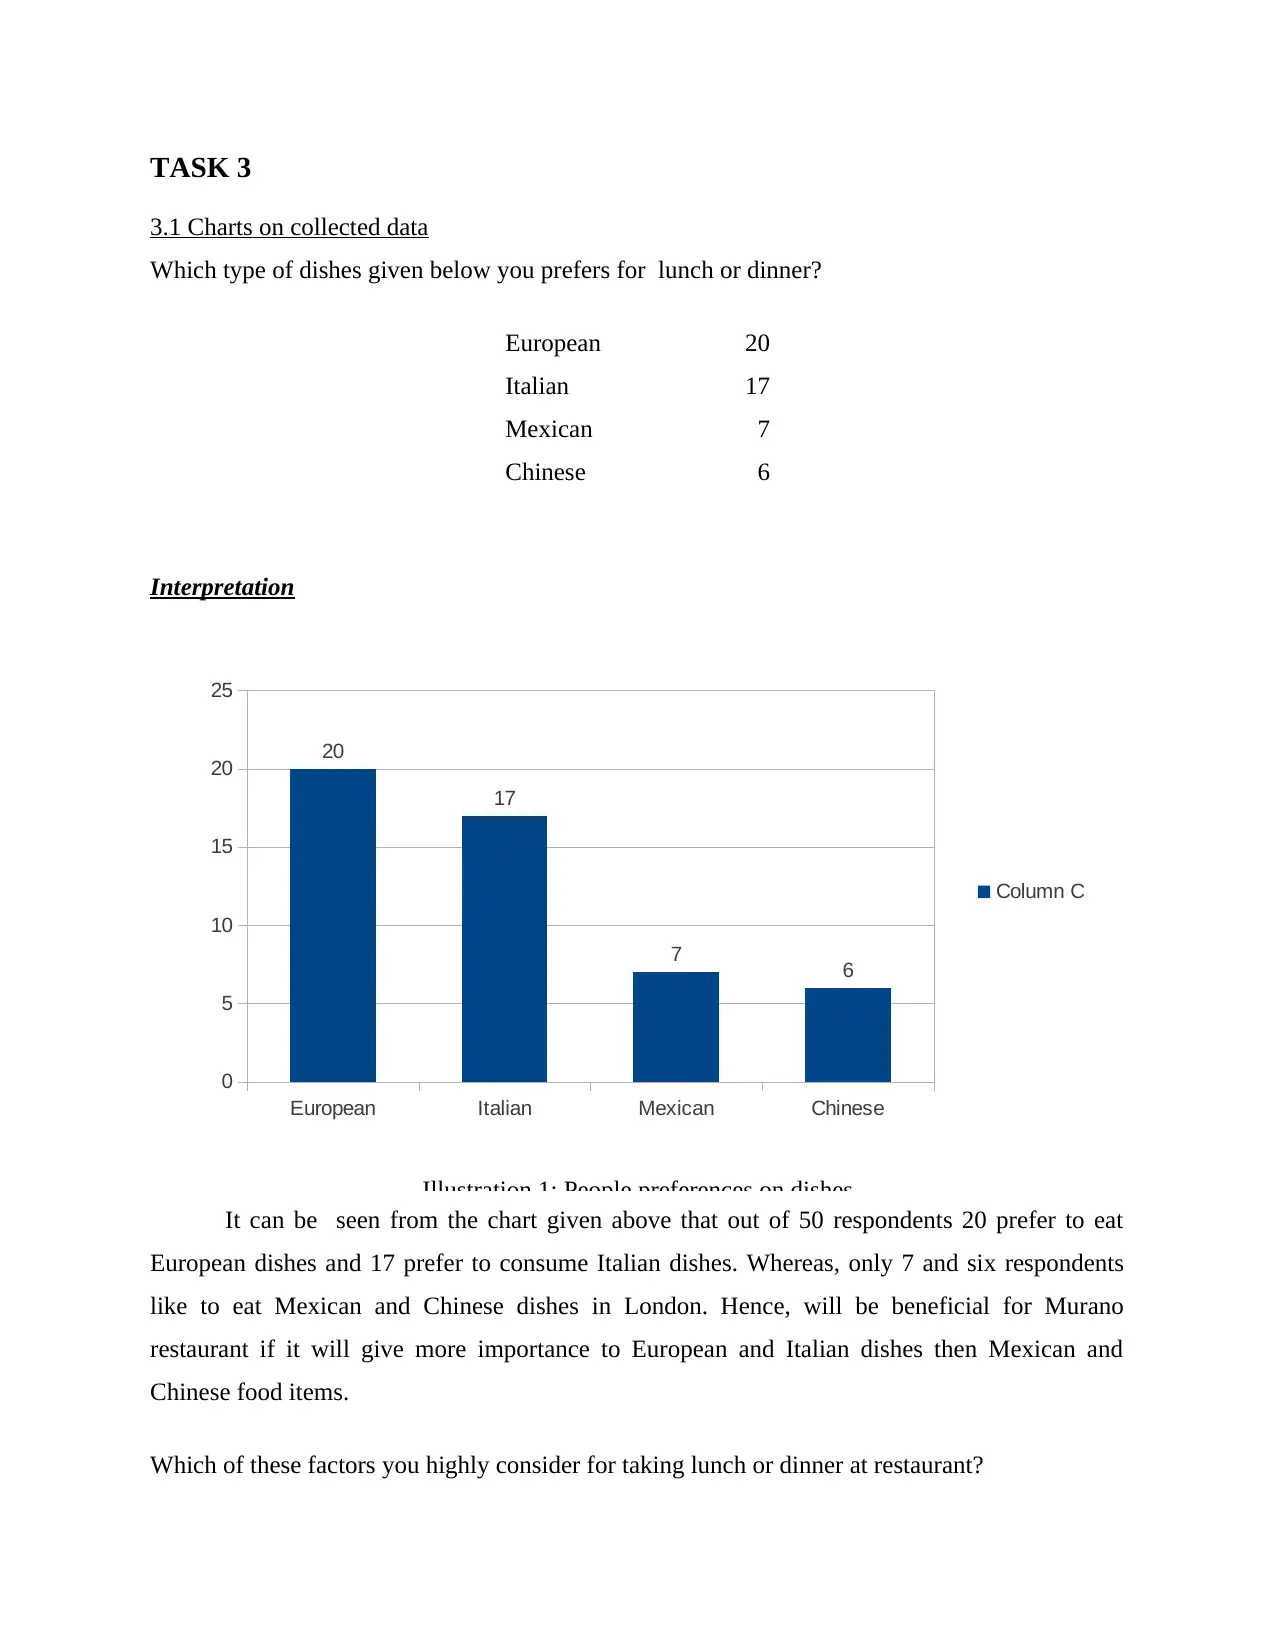
Which type of dishes given below you prefers for lunch or dinner?
European 20
Italian 17
Mexican 7
Chinese 6
Interpretation
It can be seen from the chart given above that out of 50 respondents 20 prefer to eat
European dishes and 17 prefer to consume Italian dishes. Whereas, only 7 and six respondents
like to eat Mexican and Chinese dishes in London. Hence, will be beneficial for Murano
restaurant if it will give more importance to European and Italian dishes then Mexican and
Chinese food items.
Which of these factors you highly consider for taking lunch or dinner at restaurant?
European Italian Mexican Chinese
0
5
10
15
20
25
20
17
7 6
Column C
Illustration 1: People preferences on dishes
3.1 Charts on collected data
Which type of dishes given below you prefers for lunch or dinner?
European 20
Italian 17
Mexican 7
Chinese 6
Interpretation
It can be seen from the chart given above that out of 50 respondents 20 prefer to eat
European dishes and 17 prefer to consume Italian dishes. Whereas, only 7 and six respondents
like to eat Mexican and Chinese dishes in London. Hence, will be beneficial for Murano
restaurant if it will give more importance to European and Italian dishes then Mexican and
Chinese food items.
Which of these factors you highly consider for taking lunch or dinner at restaurant?
European Italian Mexican Chinese
0
5
10
15
20
25
20
17
7 6
Column C
Illustration 1: People preferences on dishes
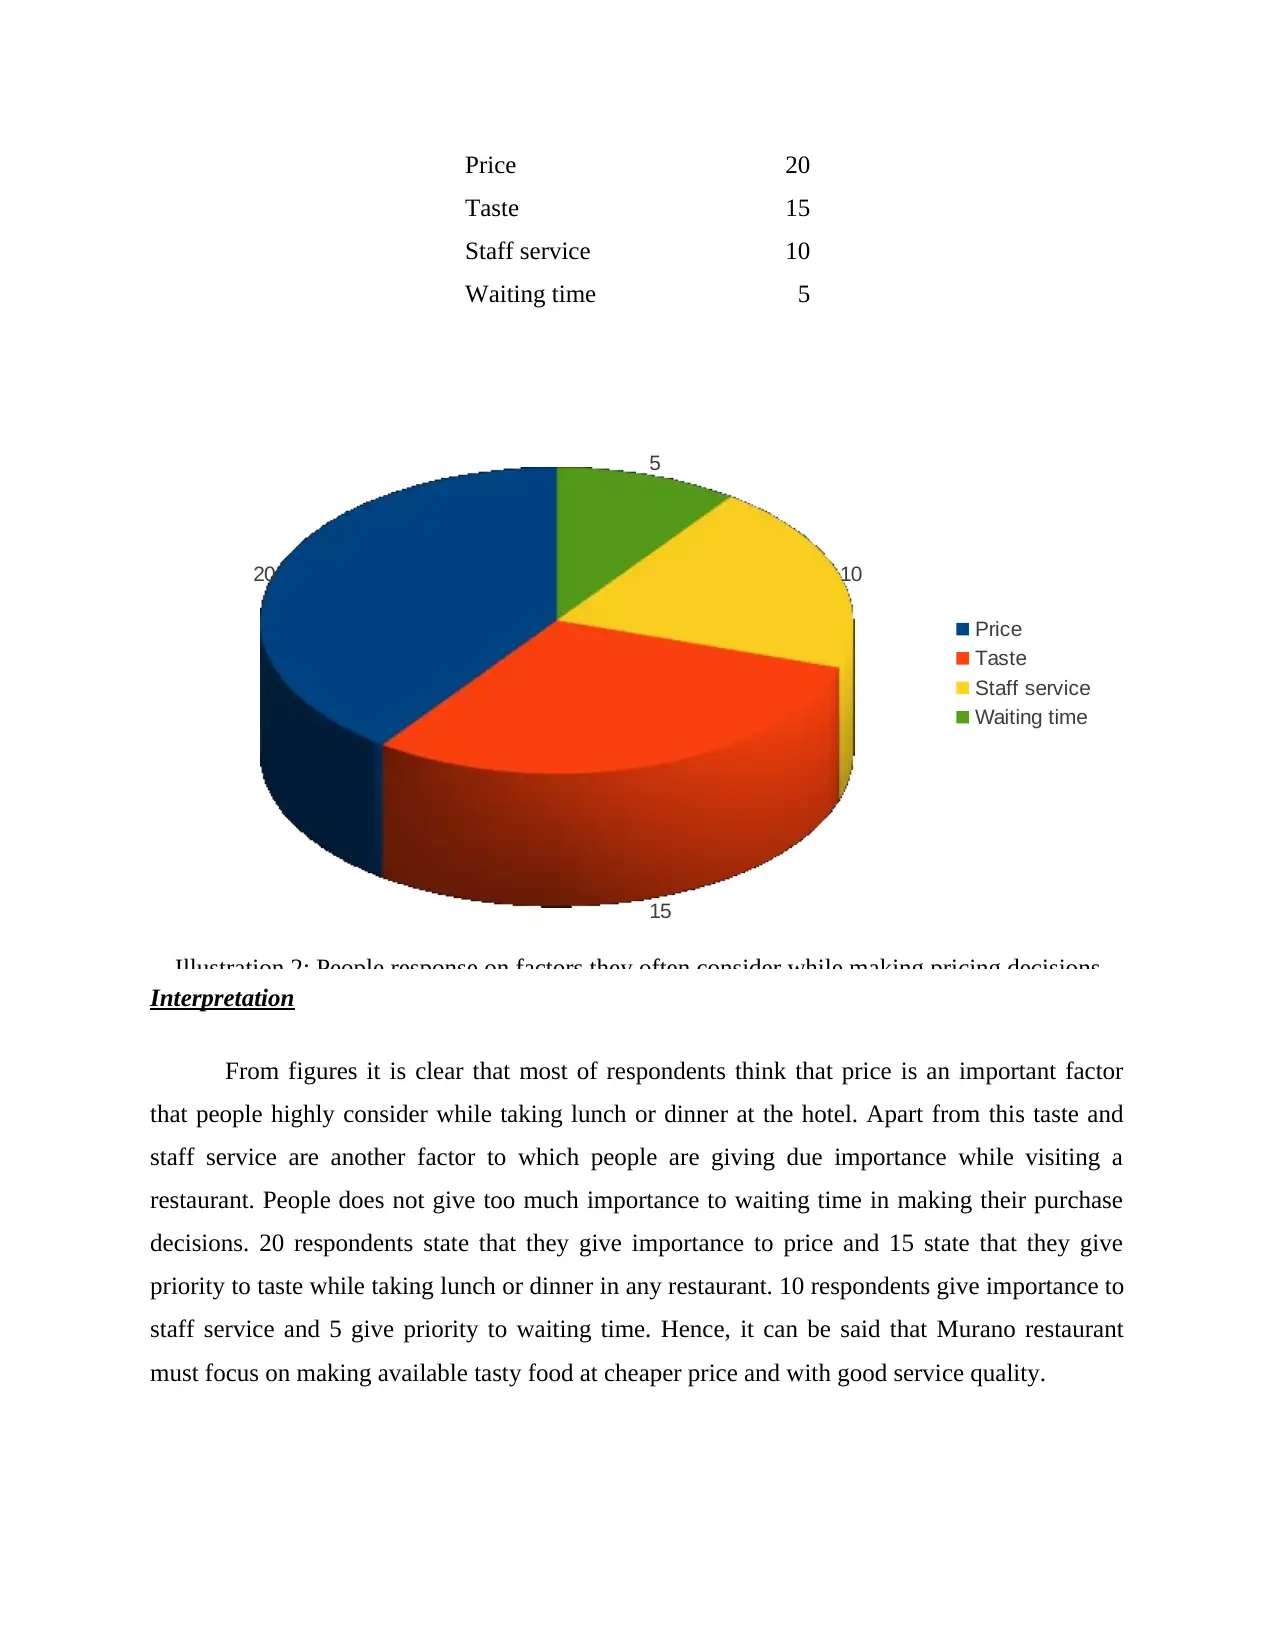
Price 20
Taste 15
Staff service 10
Waiting time 5
Interpretation
From figures it is clear that most of respondents think that price is an important factor
that people highly consider while taking lunch or dinner at the hotel. Apart from this taste and
staff service are another factor to which people are giving due importance while visiting a
restaurant. People does not give too much importance to waiting time in making their purchase
decisions. 20 respondents state that they give importance to price and 15 state that they give
priority to taste while taking lunch or dinner in any restaurant. 10 respondents give importance to
staff service and 5 give priority to waiting time. Hence, it can be said that Murano restaurant
must focus on making available tasty food at cheaper price and with good service quality.
20
15
10
5
Price
Taste
Staff service
Waiting time
Illustration 2: People response on factors they often consider while making pricing decisions
⊘ This is a preview!⊘
Do you want full access?
Subscribe today to unlock all pages.
Trusted by 1+ million students worldwide
1 out of 22
Related Documents


Your All-in-One AI-Powered Toolkit for Academic Success.
+13062052269
info@desklib.com
Available 24*7 on WhatsApp / Email
![[object Object]](/_next/static/media/star-bottom.7253800d.svg)
Unlock your academic potential
Copyright © 2020–2026 A2Z Services. All Rights Reserved. Developed and managed by ZUCOL.