ECO100 Assignment: Analysis of Luxury Car Market in Australia

Verified

Added on  2022/08/19

|14
|2085
|19
Essay
AI Summary
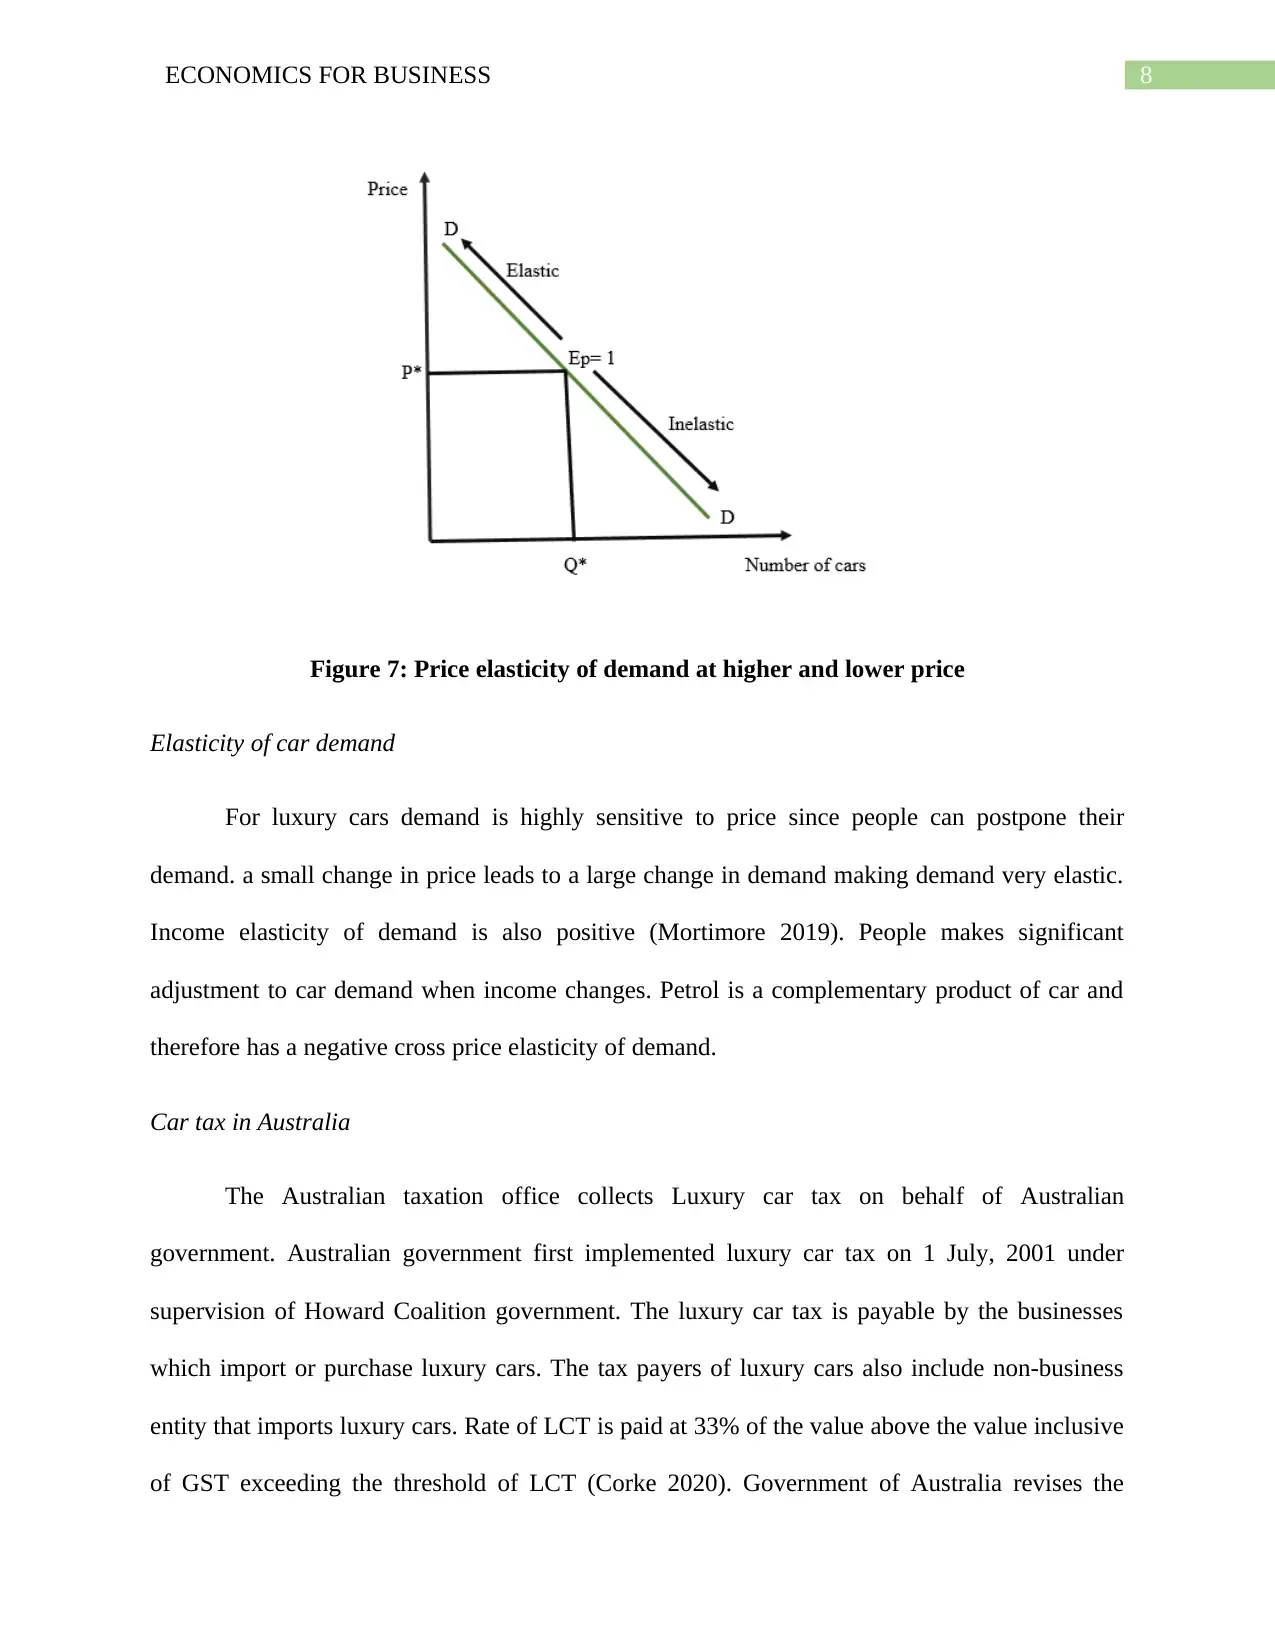
This essay provides an in-depth analysis of the luxury car market in Australia, focusing on economic principles such as demand, supply, and elasticity. The essay begins by defining demand and illustrating how price and other factors, like income, petrol prices, and advertising, influence demand, including shifts along and of the demand curve. It then defines supply and examines how price and other factors, such as input costs, technology, taxes, and the number of car brands, affect supply, again with graphical representations. The concept of price elasticity of demand is then discussed, differentiating between elastic and inelastic demand, and applying this to the luxury car market. The essay then shifts to the impact of the luxury car tax (LCT) in Australia, discussing its effects on price and quantity, and analyzing the consequences of the tax, including government revenue, tax incidence, and economic efficiency, while also considering winners and losers of the LCT policy. The analysis is supported by relevant figures and references.
Document Page
Running head: ECONOMICS FOR BUSINESS
Economics for Business
Name of the Student
Name of the University
Student ID
tabler-icon-diamond-filled.svg

Paraphrase This Document

Need a fresh take? Get an instant paraphrase of this document with our AI Paraphraser
Document Page
1ECONOMICS FOR BUSINESS
Luxury cars are considered as a status symbol for wealthy people. In recent years, sales
of luxury cars in Australia have increased significantly. Government of Australia imposes luxury
car tax applicable to business and non-business entity exceeding certain threshold limit. The
essay discusses demand, supply and elasticity of luxury car market and impact of luxury car tax
in Australia.
Demand
As defined by economists’ demand is the economic principle reflecting ability and
willingness of consumers to purchase a given product at a given time.
Effect of price on demand
By virtue of ‘law of demand’ provided different factors that may influence demand of a
product remain fixed, upward movement in price of one good reduces its demand while a
downward revision in price increases demand (Kreps 2019). The graphical representation of ‘law
of demand’ is shown by demand curve of the good which slopes down. Any change in the price
thus causes a movement along the demand curve.
Therefore, associated with an increase in price of car there is a fall in demand for car.
Correspond to this, point on the demand curve moves up along the demand curve. In contrast
when price of car falls car demand increases. Accordingly points on the demand curve moves
downward along the demand curve.
Document Page
2ECONOMICS FOR BUSINESS
Figure 1: Movement along the demand curve
Effect on demand of factors other than price
Except price there are various factors that can influence demand of car. Important factors
which can affect demand of cars are income, price of petrol and advertising. Changes in this
factors causes a shift in the demand curve at any given price. When positive changes in this
factors increases demand for cars, demand curve shifts right (Fine 2016). On the other hand,
when demand for car contracts because of changes in these factor demand curve shifts left.
Income
Car is a luxury good. Therefore, income is an important determinant of car demand. As
income increases affordability of people increases boosting car demand (Shen, Chen and Pan
2016). This makes outward shift of the car demand curve. In case of decline in income car
demand falls shifting the demand curve inward.
Petrol price
Document Page
3ECONOMICS FOR BUSINESS
Petrol is a complementary good of car. When petrol price falls, there is a decline in cost
of travelling by car. This encourages more people to buy cars. As a result, car demand increases
shifting the demand curve of cars outward (McKenzie and Lee 2016). When petrol price
increases car demand contracts and demand curve shifts left.
Advertising
Advertising has a positive influence on demand. Attractive advertisement helps to boost
car demand.
Figure 2: Rightward shift of the demand curve
tabler-icon-diamond-filled.svg

Paraphrase This Document

Need a fresh take? Get an instant paraphrase of this document with our AI Paraphraser
Document Page
4ECONOMICS FOR BUSINESS
Figure 3: Inward shift of the demand curve
Supply
Supply in economic is defined as quantity that producers’ group is willing to sell at
different market price at a given period.
Effect of a change in price
The effect of a change in car price on supply of car can be understood from law of supply
which describes association between price and quantity supplied. The law stresses that provided
other factors affecting supply remain fixed an increase in price on any commodity increases
quantity supplied and vice versa (Cowell 2018). This gives an upward sloping supply curve.
Impact of a change in price of car on the relevant supply can be captured by a movement along
the supply curve.
In case of increase in price of car sellers are encouraged to supply more because of
increased profitability. This increases car supply moving any point on the supply curve up. On
Document Page
5ECONOMICS FOR BUSINESS
the other hand, if price fall supply of cars fall as well causing point on the supply curve to move
down.
Figure 4: Movement along the supply curve
Factors affecting supply of cars
Similar to demand there are factors other than price which affects supply of car. Change
in supply following a change in factors except prices causes a shift in the supply curve. When
supply increases then supply curve shifts to the right. When supply decreases then supply curve
shifts to the left. Factors causing a change in supply of cars include cost of inputs, technology,
tax and number of car brands.
Cost of inputs
Input costs determine the supply of a product. In case of cars, important inputs affecting
car supply are rubber, labor, machinery, steel and others. When cost of these input rises, cost of
production of cars increases. This reduces car supply and shifts the supply curve inward. When
input cost falls production cost falls as well shifting the supply curve to the right.
Document Page
6ECONOMICS FOR BUSINESS
Technology
Automobile industry is highly technology oriented industry. An advancement of
technology increases profitability of car manufacturers and increases supply of cars (Murry
2017).
Tax
When government imposes a tax on cars production becomes less attractive. This lowers
supply of cars and shifts the supply curve in leftward direction.
Number of car brands
The top car brands in Australia are BMW, Mercedes, Suzuki, Kia, Audi, Jeep, Lexus,
Volvo and others (Canstar.com.au 2020). Introduction of new car brands increases supply of cars
in the market and shifts the supply curve to right.
Figure 5: Outward shift of supply curve
tabler-icon-diamond-filled.svg

Paraphrase This Document

Need a fresh take? Get an instant paraphrase of this document with our AI Paraphraser
Document Page
7ECONOMICS FOR BUSINESS
Figure 6: Inward shift of supply curve
Elasticity of demand for the product
In the demand theory in economics, the concept of “price elasticity of demand” is an
important concept which indicates magnitude of changes in proportion of demand because of a
proportionate change in price.
Elastic and inelastic demand
Demand for all products is not equally sensitive to price. Products that have a highly
sensitive demand to price fall in the category of elastic demand. Change in demand proportion
here is greater than change in price proportion. Goods having a less sensitive demand to price
fall in the category of inelastic demand. Demand has unit elasticity of magnitude of demand
changes is same as magnitude of price changes (Mochrie 2015). Elasticity of demand also differs
at various prices. Elasticity at a lower price tends to be relatively lower compared to elasticity at
a higher price.
Document Page
8ECONOMICS FOR BUSINESS
Figure 7: Price elasticity of demand at higher and lower price
Elasticity of car demand
For luxury cars demand is highly sensitive to price since people can postpone their
demand. a small change in price leads to a large change in demand making demand very elastic.
Income elasticity of demand is also positive (Mortimore 2019). People makes significant
adjustment to car demand when income changes. Petrol is a complementary product of car and
therefore has a negative cross price elasticity of demand.
Car tax in Australia
The Australian taxation office collects Luxury car tax on behalf of Australian
government. Australian government first implemented luxury car tax on 1 July, 2001 under
supervision of Howard Coalition government. The luxury car tax is payable by the businesses
which import or purchase luxury cars. The tax payers of luxury cars also include non-business
entity that imports luxury cars. Rate of LCT is paid at 33% of the value above the value inclusive
of GST exceeding the threshold of LCT (Corke 2020). Government of Australia revises the
Document Page
9ECONOMICS FOR BUSINESS
threshold limit of LCT if needed. Apart from threshold limit, there are other conditions based on
which government determines whether a car is qualified under LCT or not.
Table 1: Threshold for LCT
(Source: Ato.gov.au. 2020)
tabler-icon-diamond-filled.svg

Paraphrase This Document

Need a fresh take? Get an instant paraphrase of this document with our AI Paraphraser
Document Page
10ECONOMICS FOR BUSINESS
Effect of luxury car tax on price and quantity
Figure 8: Impact of a luxury car tax
When a tax is imposed on cars purchase exceeding certain threshold the immediate
impact of the tax is to make a leftward shift of the car demand curve by the size of tax. As tax
discourages purchase of luxury cars, there is decline in number of cars sold after tax. Number of
cars sold decreases to CT. Imposed tax creates a wedge between price buyers pay and price
sellers receive. PB in the above figure shows price to consumer and PS indicates price that sellers
receive.
Consequences of luxury car tax
Imposed tax on any good yields government revenue. Government revenue from the
proposed luxury car tax is shown by the rectangular area PBABPS. Part of the revenue comes from
seller and part of its comes from buyers. Elasticity of demand and supply determines the share of
tax burden that buyers and sellers bear known as incidence of tax. Since demand for luxury cars
Document Page
11ECONOMICS FOR BUSINESS
is highly inelastic in nature buyers make a relatively larger adjustment to demand. Buyers thus
bear a smaller tax burden relative to sellers.
From point of view of economic efficiency imposition of tax luxury car tax is
economically inefficient. Imposed tax leads to a deadweight loss to the society shown by the
triangular area AE1B. When government intervenes in the car market through luxury car tax,
there is a distortion of consumer choices. This includes decision to buy cheaper car model to
avoid tax leading to a loss in consumer surplus. Because of tax when price of luxury cars
increases consumers may shift their demand to high specification car models hurting sales of
luxury cars and lowers producers’ surplus. Government policy of LCT may involve possible
lobbies which hurt certain group of producers (Baimagambetov et al. 2019). There are some
winners group of LCT as well. The winners group are producers and consumers of non-luxury
cars. LCT by increasing demand for fuel efficient cars contributes to a low level pollution by
reducing emission from burning of fossils fuels.
chevron_up_icon
1 out of 14
circle_padding
hide_on_mobile
zoom_out_icon
[object Object]