Research & Insight: Macleay Smartphone Survey Report, Assessment 2
VerifiedAdded on 2023/01/18
|15
|3391
|44
Report
AI Summary
This report, prepared for Macleay Smartphone, details a research project aimed at understanding consumer smartphone preferences and usage patterns to identify potential areas for product improvement. The study, conducted using a free online survey, explores brand choices, replacement cycles, and desired features, with a focus on helping Macleay Smartphone gain market share. The report includes background information on the research context and objectives, a review of current knowledge and knowledge gaps, the research methodology, and a detailed analysis of the survey results. The findings reveal key consumer behaviors, preferences, and the impact of age on brand choices. The analysis highlights limitations of the research design, including the use of a convenience sample and the constraints of the survey tool. The results are presented in both narrative and graphical formats, with critical thinking applied to the findings, recognizing alternative interpretations and inferring motives and causes. The report concludes with a summary of the findings, contribution to knowledge, recommendations, and suggestions for further research, offering insights to inform future product development and marketing strategies for Macleay Smartphone.
RESEARCH & INSIGHT
Assessment 2
Research Data Collection
REPORT OUTLINE
This document provides students with the framework for a Research Project
Report that you are required to complete for Assessment 2.
To provide context for the research report, following sections have been
completed for you:
Section 1: Background
1.1 Research Context
1.2 Research Objectives
Section 2: Current Knowledge
2.1 Secondary Research
2.2 Literature Review, Theories and Models
2.3 Research Techniques Available
2.4 Knowledge Gaps
Section 3: Research Method
3.1 Research Question
3.2 Research Design
You are required to complete these sections:
Section 3: Research Method
3.3 Limitations of the Research Methodology
Section 4: Results
4.1 Analysis
4.2 Findings
Section 5: Conclusions
5.1 Summary of Findings
5.2 Contribution to Knowledge
5.3 Recommendations
5.4 Further Research
Appendix
Reference List
Survey Link
You can use this document as your template and save your completed report as
a PDF before you upload it to the Assessment 2 link in Moodle before 11:55 PM
(AEST) on Sunday 7 April 2019.
Paraphrase This Document
Need a fresh take? Get an instant paraphrase of this document with our AI Paraphraser
ASSESSMENT COVER SHEET
Please ensure this form is fully completed prior to submission and included on the front of your
assessment.
Student Number
Student Name
Unit Code
Unit Title
Assignment
Topic/Title
Unit Lecturer Date Submitted
Due Date
Word Count
PLAGIARISM
Plagiarism is the act of representing as one’s own work the creative works of another, without appropriate
acknowledgement of the author or source.
COLLUSION
Collusion is the presentation by a student of an assessment as his or her own which is in fact the result in
whole or in part of unauthorised collaboration with another person or persons. Collusion involves the
cooperation of two or more students in plagiarism or other forms of academic misconduct as such both
parties are subject to disciplinary action. Plagiarism and collusion constitute cheating. Disciplinary action will
be taken against students who engage in plagiarism and collusion as outlined in the College’s policies.
Student Declaration (student to complete)
I hereby certify that:
1. This assessment is my own work based on my personal study/research and not the work of another
student and/or source.
2. I have acknowledged all material and sources used to prepare this assessment.
3. I have not plagiarised or copied any part of this assessment for them work of any other student or source.
4. I have retained a copy of this assessment for my own records in the event I have to reproduce my work.
Student Signature: ___________________________ Date: ______________
RAI102 RESEARCH & INSIGHT
Assessment 2
Research Data Collection
Macleay Smartphone
Survey
Prepared for: John Dingeldei
Conducted by: (Insert you name here)
Date: 7 April 2019
Assessment 2
Research Data Collection
Macleay Smartphone
Survey
Prepared for: John Dingeldei
Conducted by: (Insert you name here)
Date: 7 April 2019
⊘ This is a preview!⊘
Do you want full access?
Subscribe today to unlock all pages.
Trusted by 1+ million students worldwide
Macleay Smartphone Survey Report
SECTION 1: BACKGROUND
1.1 RESEARCH CONTEXT
This research is being conducted for Macleay Smartphone, a small wholesaler of
smartphones that sells a range of Android smartphones to online and bricks-and-
mortar retailers as well as wireless telecommunications carriers. The main
competitors for Macleay Smartphone are mostly local subsidiaries of large global
technology companies.
The main drivers of demand are increased network coverage, improvements to
networks (e.g. the new 5G network development) and new phone features
together with population growth, increases in consumer sentiment and
discretionary income.
According to IBISWorld (2018), industry revenue growth over the past five years
has been driven by new product development and improvements. IBISWorld
expects revenue for the mobile phone and tablet wholesaling industry to grow to
$10.3 billion, a growth of 3.8%, driven by growing demand from wireless
telecommunications carriers that control 35.4% of the market.
The increased demand from telecommunications carriers may constrain future
industry demand since most phones are sold on post-paid contracts that are paid
by smaller installments over a fixed term that can prolong the phone’s
replacement cycle.
Industry revenue growth is expected to slow over the next five years. While
improvements in national 4G network coverage is likely to increase Smartphone
penetration this will only be small due to mobile device saturation and consumers
increasingly consolidating devices. (Youl 2018)
The popularity of phones that use the Android platform (including Samsung,
Huawei and HTC) is increasing, but with Apple and Samsung dominating the
market, small players like Macleay Smartphone are under increasing pressure to
gain a sustainable market share.
In order to survive, Macleay Smartphone needs to take market share form the
premium flagship brands. The organization lacks understanding of the phone
replacement cycle and the preferences of consumers. This knowledge can help
inform future product development and marketing strategies.
1.2 RESEARCH OBJECTIVES
The key objectives for this research project are:
To understand current and future smartphone brand preferences of
consumers.
To gain insight into the replacement cycle of mobile and smartphones.
Paraphrase This Document
Need a fresh take? Get an instant paraphrase of this document with our AI Paraphraser
To explore consumer smartphone usage to help identify potential new
features
1.3 LIST OF INFORMATION REQUIRED
To achieve these objectives it would be useful to collect data on the following:
the mobile and smartphone brands are currently used by consumers,
the mobile and smartphone brands are likely to be considered by
consumers when buying or upgrading in the future,
the relative use of mobile and smartphones for work and personal
reasons,
the main activities are mobile and smartphones used for,
the new features would consumers like to see when upgrading,
the impact of age on consumer preferences.
SECTION 2: CURRENT KNOWLEDGE
2.1 SECONDARY RESEARCH
Macleay Smartphone has a very small market of the Australian smartphone
market. Apple and Samsung dominate with 63.2% and 18.1% share respectively.
Huawei is the next biggest with 3.0-4.0% share and the balance is spread across
31 other businesses. (Youl 2018)
An analysis of consumers’ purchase evaluation factors of smartphones shows
that the purchase factors considered by consumers in order of importance are:
“hardware and software specifications”, “user interface”, “appearance and
design”, “mobile commerce functions” and “entertainment functions”. In addition,
the specifications aspect accounts for 33.18% of the decision with the most
important evaluation criteria the central processing unit, operating system, touch
screen, and battery function in that order. (Yi-Chung 2013)
Although it is not the foremost determinant, price is another important
determinant of product choice. Consumers that are not as tech-savvy are the
most likely to be swayed by price. (Youl 2018)
2.2 KNOWLEDGE GAPS
Based on the secondary research conducted we can use the purchase
evaluation factors hierarchy studied by Yi-Chung Hu and Yu-Lin Liao (2013) as
the basis for enhancements to specifications but since consumers are unable to
articulate hardware and software specification improvements we will not conduct
research on this aspect in this study.
Instead, this research aims to identify potential areas for product improvements
based on understanding the brands that are succeeding, the way people use
their phones and to try and glean some insights from what they can tell us about
what they want.
This will not be an exhaustive study but an introduction to identify further
knowledge gaps that can be investigated through further research.
2.3 RESEARCH TECHNIQUES AVAILABLE
Focus groups, in-depth interviews, surveys or feedback from retailers and
telecommunications customers could be conducted. Current and potential
smartphone consumers could also be surveyed to explore these research
questions. Unfortunately, these approaches are expensive. There is no available
budget so the research that can be undertaken must be at no expense.
SECTION 3: RESEARCH METHOD
3.1 RESEARCH QUESTION
The research question that will be investigated is:
What are some potential areas for product improvements from a
consumers’ that will help Macleay Smartphone take market share from its
competitors?
3.2 RESEARCH DESIGN
Given that there is no budget available to conduct this research, free tools and
easy to obtain sample are essential to use.
This will be exploratory research undertaken using the free version of Survey
Monkey. This will limit the number of questions that can be asked to a total of ten.
A convenience sample of friends and family of Macleay Smartphone will be
surveyed by emailing a link to the Survey Monkey questionnaire or posting the
link to the social media pages of the employees and associates of the
organization.
The limitations of the research design are acknowledged and will be outlined in
the next section.
3.3 LIMITATIONS OF THE RESEARCH METHODOLOGY
Outline the limitations of the Sampling Methodology and any other challenges/constraints
associated with the execution of the Project and/or issues faced during the fieldwork (such as,
budgetary, timing, sampling and non-sampling Errors) and their impact to the following Analysis
and Findings.
The major limitation lies within the free survey conducting tool called
Survey Monkey. The Survey Monkey limits to only 10 questions and this hinders
the conduct of the survey. It is important to mention that this limitation will limit
the number of question to be asked to the respondents. Secondly, the sample
chosen for the conduct of the survey in mainly within the family and the friends of
Macleay Smartphone. This will introduce biasness within the data collection
strategy and it will represent skewed data for later analysis. No budget has been
allocated for the study and for a smartphone company that is willing to overtake
the market share of the other market leader, it is not feasible to work with a zero
budget. The zero budget strategy will definitely unable to unable to highlight
some of the vital aspects of the study. The methodology section highlights that
⊘ This is a preview!⊘
Do you want full access?
Subscribe today to unlock all pages.
Trusted by 1+ million students worldwide
the associates and employees has also been consulted to fill the survey.
However, the survey failed to extract the real needs of the customers and the
preferences of such customers (Moser and Kalton 2017).
However, the survey failed to extract the real needs of the customers and the
preferences of such customers (Moser and Kalton 2017).
Paraphrase This Document
Need a fresh take? Get an instant paraphrase of this document with our AI Paraphraser
SECTION 4: RESULTS
4.1 ANALYSIS
Conduct appropriate descriptive and statistical analysis objectively and accurately on questions
contained in the Questionnaire
The first question actually highlights on what are the smartphone or the
mobile brands that are currently used. This question had 15 options and a
respondent can even select multiple options. majority of the responses have
been seen for the Apple and Samsung. In the second question, it has been
highlighted on the age of the mobile and majority of the responses have been
received for less than one year. The third question emphasized on the mobile
that a consumer will consider if he she is planning to buy another smartphone.
Here, also Apple and Samsung tops the chart. The next question is same while
the respondents are asked to choose a single brand for reconsideration. in this
section also the tops places have been grabbed by Apple and Samsung. The fifth
question is much more use centric and how often the respondent is using their
smartphone in workdays and it is either for work related reasons or personal
reasons. Here, the results have suggested that smartphones are basically used
for personal purposes. The sixth question highlights the how much time in total is
spent on the usage of the smartphone. The results have suggested that the
usage of phone is 1 hour to more than three hours. The seventh question
highlights the activities that are undertaken by the responds. Here, the
respondents can select multiple answers. The highest activity is seen with the
making or receiving phone calls. It is followed by using phone for accessing the
social networking websites and maps are used for availing location based
services. The eight question highlights any one activity of the respondents that
they most often do when they use their phone. Here, the respondents have
chosen the option that they very often check their social networking websites. In
the ninth question, the respondents are asked to be specific on what feature they
are willing to see on their smartphone when they will either upgrade or buy their
next smartphone. The respondents have suggested a ton of features which are
already found in one brand or the other. In the tenth question, the question asked
is what is the age group of the respondents. Here, majority of the respondents
have highlighted that belong from the age group of 18 to 24 years.
4.2 FINDINGS
Report Analysis Findings in narrative form as well as graphical. Apply critical thinking aspects to
the findings with considered answers that recognise alternative interpretations or infer motives
and causes as presented in the Survey Question.
The findings are based on the 10 question that were asked on the free
survey conducting tool. The ten questions provide a highly insightful response
that can be used for the product design.
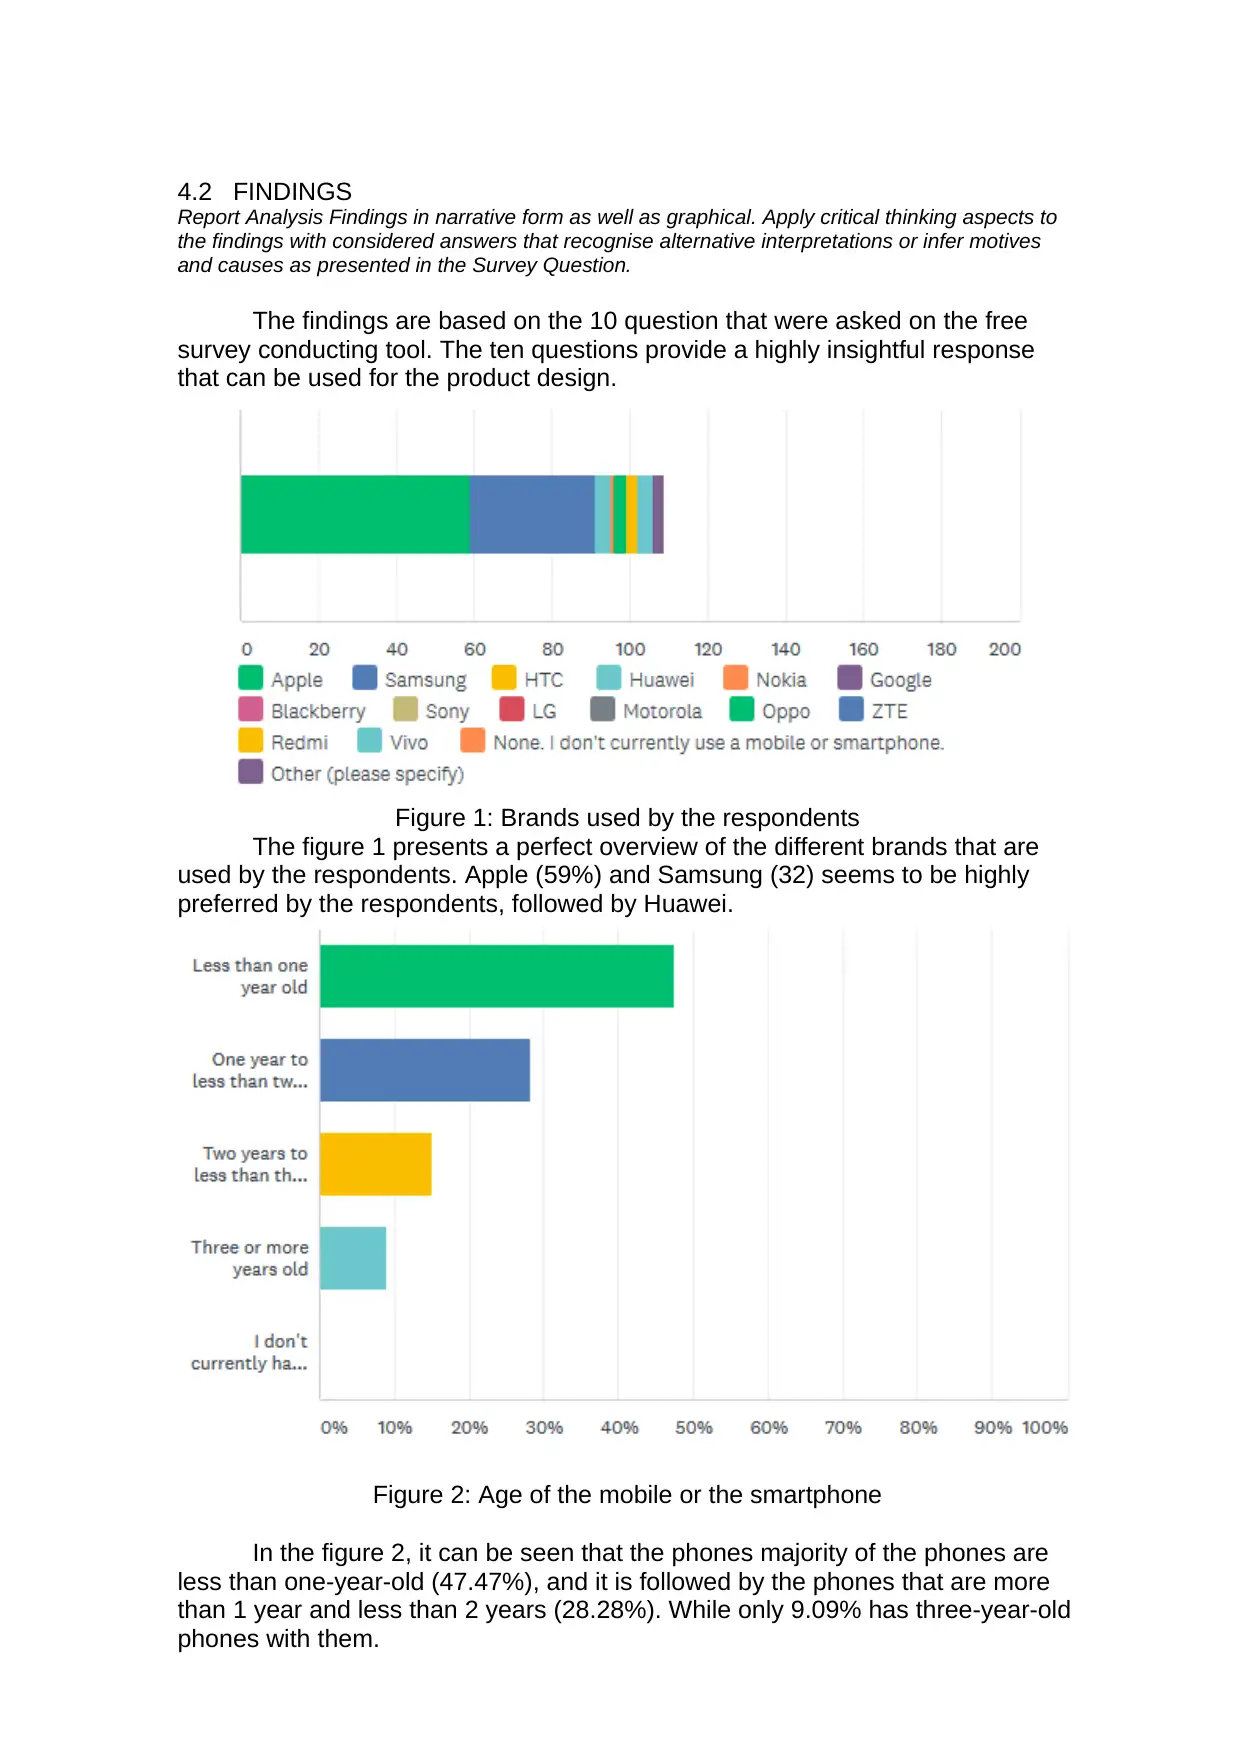
Figure 1: Brands used by the respondents
The figure 1 presents a perfect overview of the different brands that are
used by the respondents. Apple (59%) and Samsung (32) seems to be highly
preferred by the respondents, followed by Huawei.
Figure 2: Age of the mobile or the smartphone
In the figure 2, it can be seen that the phones majority of the phones are
less than one-year-old (47.47%), and it is followed by the phones that are more
than 1 year and less than 2 years (28.28%). While only 9.09% has three-year-old
phones with them.
Report Analysis Findings in narrative form as well as graphical. Apply critical thinking aspects to
the findings with considered answers that recognise alternative interpretations or infer motives
and causes as presented in the Survey Question.
The findings are based on the 10 question that were asked on the free
survey conducting tool. The ten questions provide a highly insightful response
that can be used for the product design.
Figure 1: Brands used by the respondents
The figure 1 presents a perfect overview of the different brands that are
used by the respondents. Apple (59%) and Samsung (32) seems to be highly
preferred by the respondents, followed by Huawei.
Figure 2: Age of the mobile or the smartphone
In the figure 2, it can be seen that the phones majority of the phones are
less than one-year-old (47.47%), and it is followed by the phones that are more
than 1 year and less than 2 years (28.28%). While only 9.09% has three-year-old
phones with them.
⊘ This is a preview!⊘
Do you want full access?
Subscribe today to unlock all pages.
Trusted by 1+ million students worldwide
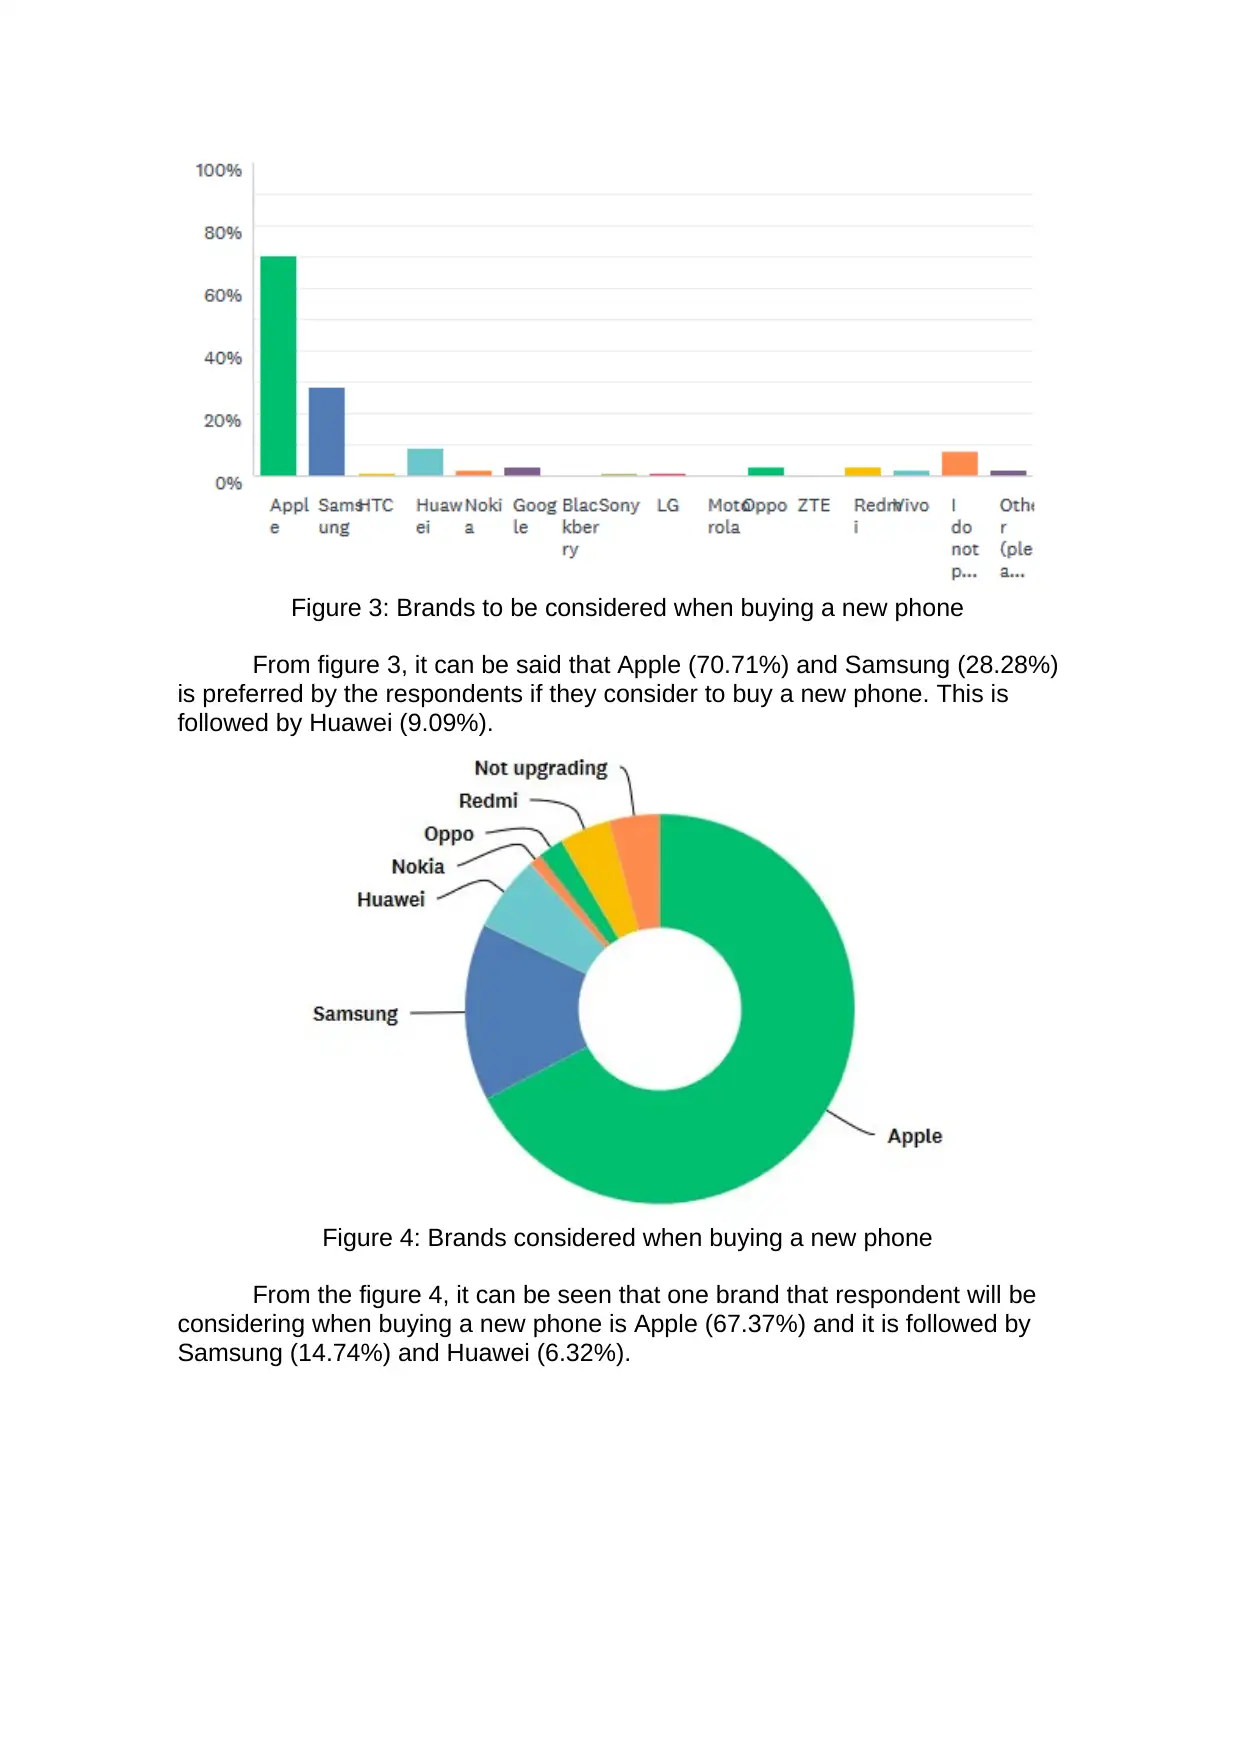
Figure 3: Brands to be considered when buying a new phone
From figure 3, it can be said that Apple (70.71%) and Samsung (28.28%)
is preferred by the respondents if they consider to buy a new phone. This is
followed by Huawei (9.09%).
Figure 4: Brands considered when buying a new phone
From the figure 4, it can be seen that one brand that respondent will be
considering when buying a new phone is Apple (67.37%) and it is followed by
Samsung (14.74%) and Huawei (6.32%).
Paraphrase This Document
Need a fresh take? Get an instant paraphrase of this document with our AI Paraphraser
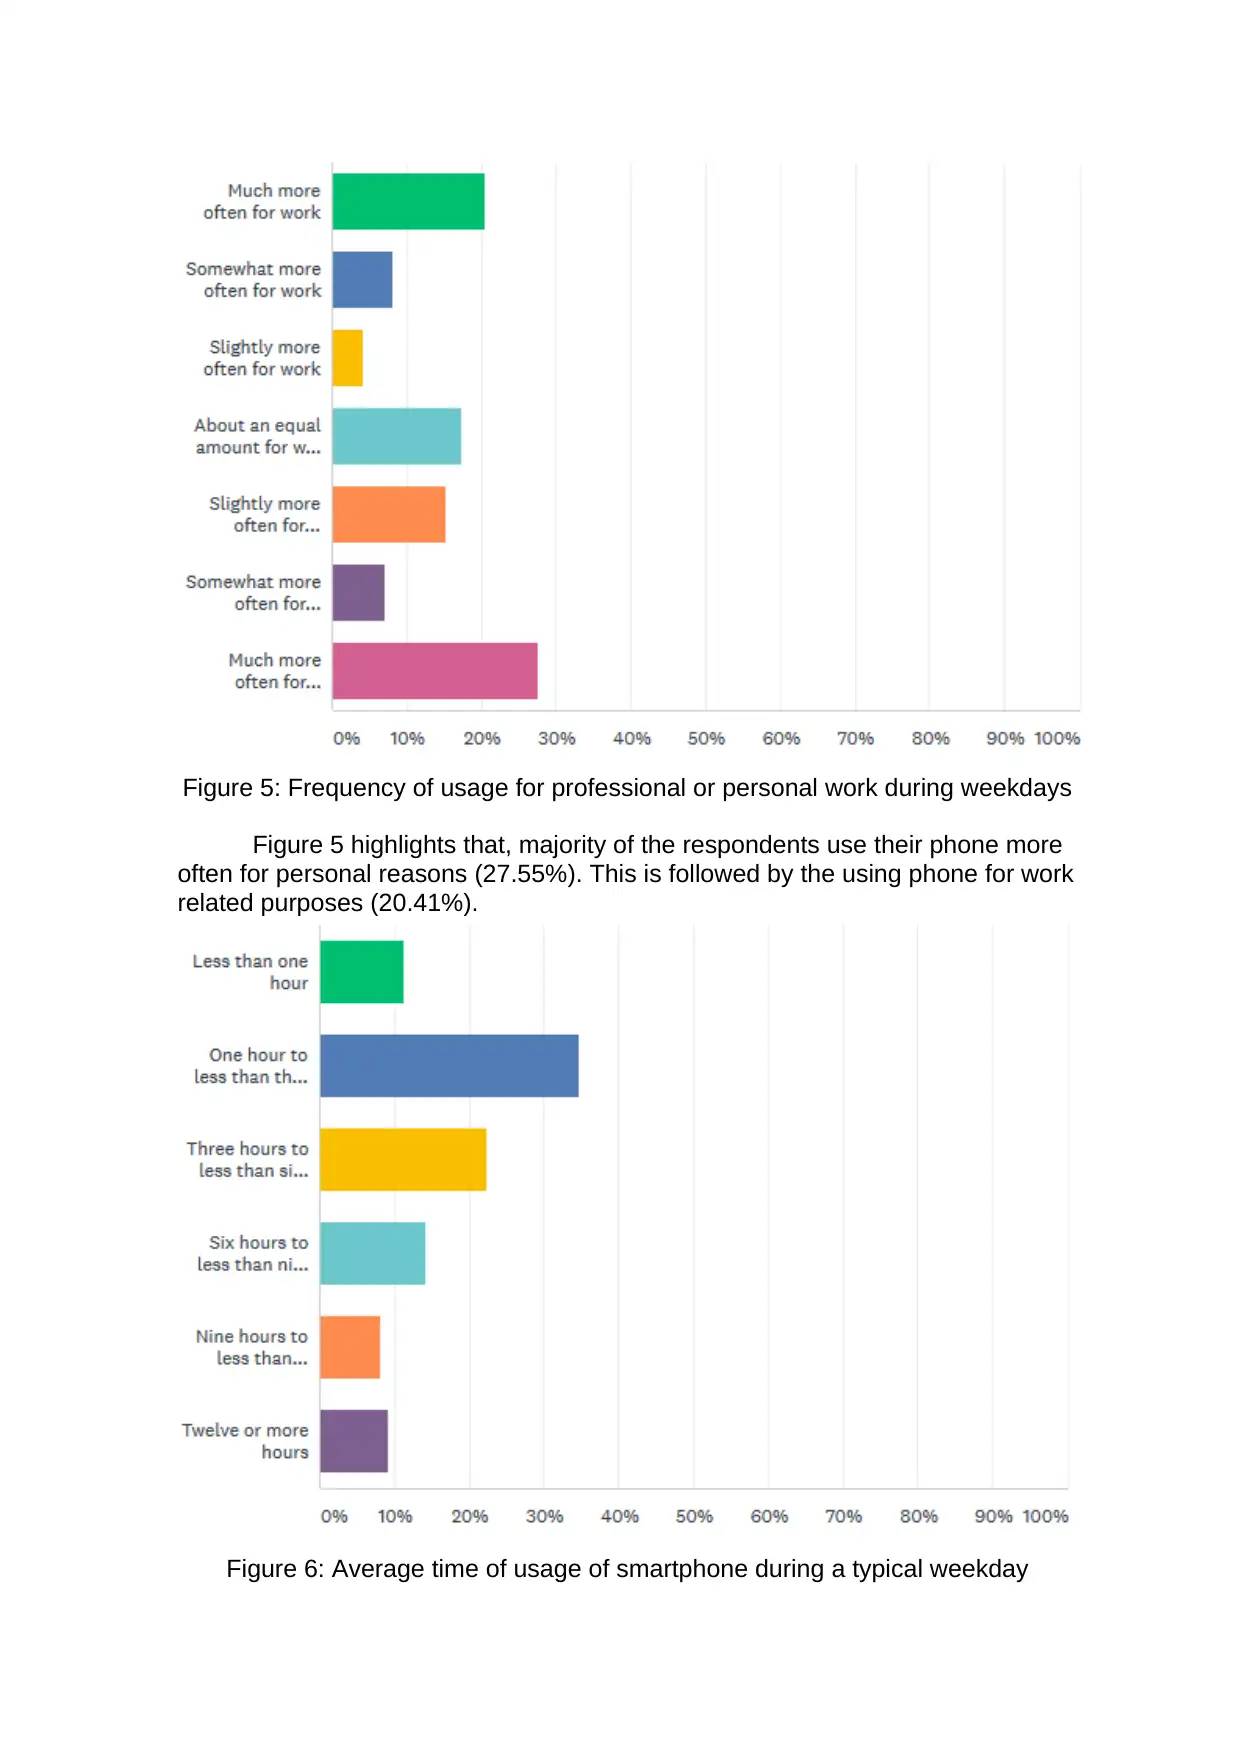
Figure 5: Frequency of usage for professional or personal work during weekdays
Figure 5 highlights that, majority of the respondents use their phone more
often for personal reasons (27.55%). This is followed by the using phone for work
related purposes (20.41%).
Figure 6: Average time of usage of smartphone during a typical weekday
Figure 5 highlights that, majority of the respondents use their phone more
often for personal reasons (27.55%). This is followed by the using phone for work
related purposes (20.41%).
Figure 6: Average time of usage of smartphone during a typical weekday
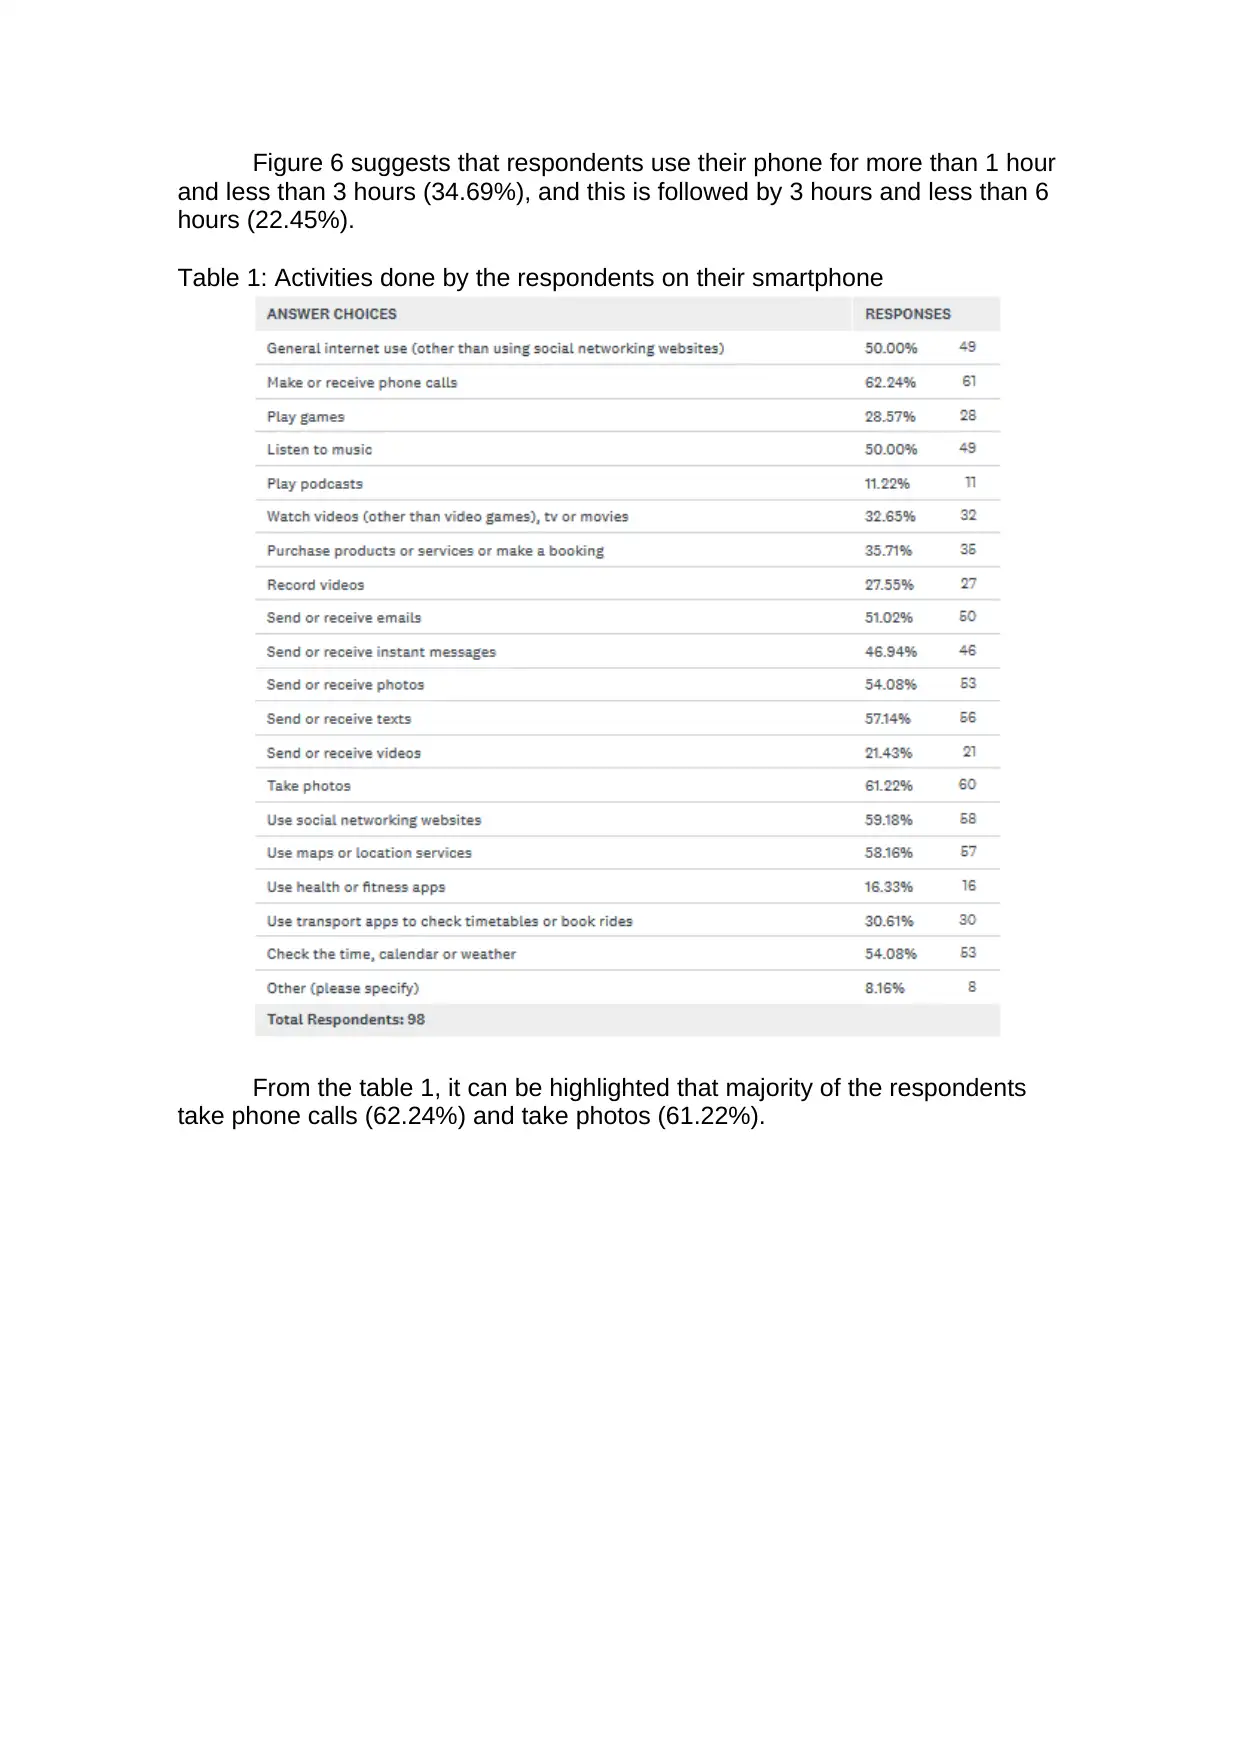
Figure 6 suggests that respondents use their phone for more than 1 hour
and less than 3 hours (34.69%), and this is followed by 3 hours and less than 6
hours (22.45%).
Table 1: Activities done by the respondents on their smartphone
From the table 1, it can be highlighted that majority of the respondents
take phone calls (62.24%) and take photos (61.22%).
and less than 3 hours (34.69%), and this is followed by 3 hours and less than 6
hours (22.45%).
Table 1: Activities done by the respondents on their smartphone
From the table 1, it can be highlighted that majority of the respondents
take phone calls (62.24%) and take photos (61.22%).
⊘ This is a preview!⊘
Do you want full access?
Subscribe today to unlock all pages.
Trusted by 1+ million students worldwide
1 out of 15
Related Documents


Your All-in-One AI-Powered Toolkit for Academic Success.
+13062052269
info@desklib.com
Available 24*7 on WhatsApp / Email
![[object Object]](/_next/static/media/star-bottom.7253800d.svg)
Unlock your academic potential
Copyright © 2020–2026 A2Z Services. All Rights Reserved. Developed and managed by ZUCOL.