Macroeconomics Report: Loanable Funds, Interest Rates, and Forecasts
VerifiedAdded on 2020/03/01
|20
|4236
|78
Report
AI Summary
This report provides a comprehensive analysis of the loanable funds model, examining the factors influencing the supply and demand of loanable funds and their impact on interest rates. It explores the dynamics of variable interest rates on small business loans, highlighting their movements and significance in business decision-making. The report also presents an economic outlook for both the Australian and global economies over the next five years, utilizing macroeconomic indicators such as real GDP, unemployment rate, and inflation rate. Furthermore, it includes a forecast of variable interest rates on small business loans during the same period, offering insights into potential economic trends and their implications for businesses and consumers. The analysis covers the period from 2004 to 2017, providing a historical context for understanding current economic conditions and future projections.
Running head: MACROECONOMICS
MACROECONOMICS
Name of the student
Name of the University
Author’s Note
MACROECONOMICS
Name of the student
Name of the University
Author’s Note
Paraphrase This Document
Need a fresh take? Get an instant paraphrase of this document with our AI Paraphraser
1MACROECONOMICS
Table of Contents
Introduction......................................................................................................................................3
Question 1........................................................................................................................................3
Loanable funds model..................................................................................................................3
Loanable funds demand...............................................................................................................4
Loanable funds supply.................................................................................................................4
Factors that influence both demand and supply of loanable funds..............................................5
Movements in the variable interest rates on small business loans...............................................6
Question 2........................................................................................................................................8
Macroeconomic situation for both the Australian and World economies over the next 5 years.8
Forecasting variable interest rate on small business loans over the next 5 years......................15
Conclusion.....................................................................................................................................17
References......................................................................................................................................18
2MACROECONOMICS
Introduction
The report discusses about the structure of loanable funds model and demand and supply of
loanable funds model. Loanable funds model is a framework that is used to determine the causes
of increase or decrease in interest rates and assess measurement of policy wisdom planned for
influencing interest rates and growth rates. In addition, this framework determines the interest
rate by supply and demand for loanable funds (Yunus, 2012). It is also used to explore the
influence of variation in macroeconomic factors on the real rate of interest rate. This study also
highlights on the variables that impact on the supply and demand for loanable funds. The
variable interest rate and its significance in the business decision making is also explained in this
study. The paper also reflects on the movements of demand and supply in variable interest rate
on small business loans. The economic outlook of Australia and world economies for the next
five years using macroeconomic indicators is also illustrated in this report. The prediction on
variable interest rate on small business loans over the 5 years is also shown in this study.
Question 1
Loanable funds model
The formation of loanable funds model refers to the comparative equilibrium framework that
utilizes both the demand curve as well as the supply curve for tracing equilibrium price of market
clearance. This price is basically the interest rate in this model and is represented by r (Wu and
Xia 2016). The complexity of interest rate is also simplified by using this model. The
equilibrium interest rate is attained by the intersection between the demand and supply curve.
The demand curve in loanable model signifies the credit demand by borrowers whereas the
⊘ This is a preview!⊘
Do you want full access?
Subscribe today to unlock all pages.
Trusted by 1+ million students worldwide
3MACROECONOMICS
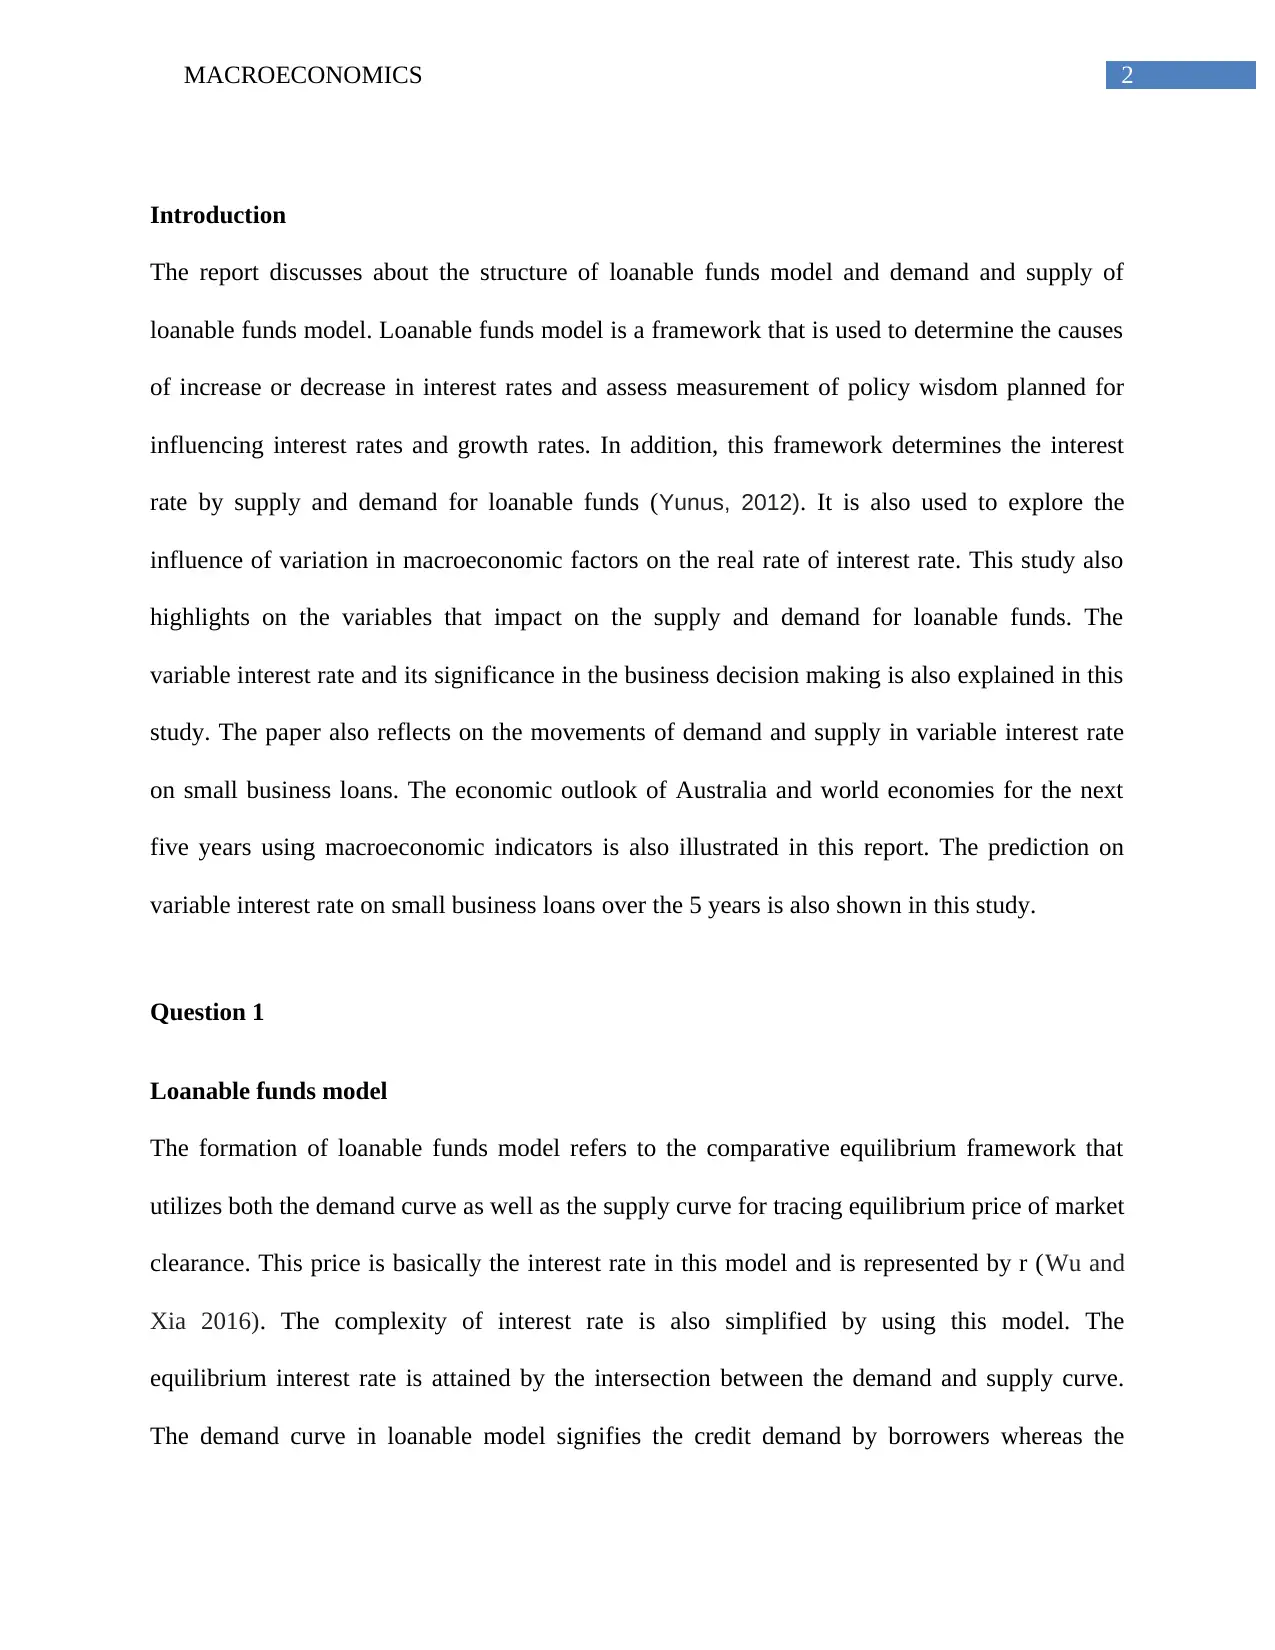
supply curve implies credit supply by lenders. The borrowers involve consumer borrowers and
corporate borrowing while the lenders includes mortgage, credit card and instrument leasing
companies. For example, in U.S the occurrence of borrowing is funded through interest sale
holding financial assets. On the contrary, the US government sells treasury bonds for running its
budget deficit (Petersen and Rajan 2012). However, The Federal Reserve implies the open
market operation policies in order to regulate supply credit system.
Figure 1: Loanable funds framework
Source: (Author’s creation)
Loanable funds demand
Loanable funds demand signifies borrowers desire to borrow and is negatively sloped in respect
of the interest rates. The negatively sloped demand curve occurs due to low interest rates and this
facilitates the consumers to borrow money at much cheaper rate. Therefore, lower loan cost
Paraphrase This Document
Need a fresh take? Get an instant paraphrase of this document with our AI Paraphraser
4MACROECONOMICS
motivates the individuals to borrow larger quantity at higher rate. In addition, crowding-out
effect increases loanable assets demand. Crowding out effect occurs when the rise in government
deficit moves demand curve to the right and this leads to increase in interest rate. This rise in
interest rate adversely influences the investment of business. Moreover, if the expected
advantage received from the scheme remains same while the interest rates rise, then the projects
becomes less viable. As a result, less entities borrows money and quantity demanded for loanable
funds decreases.
Loanable funds supply
Loanable funds supply corresponds to the lenders desire to lend and this involves credit card
entities, U.S purchases, treasury securities and other debt funds. Loanable funds supply curve is
usually positively sloped with respect to interest rate. This is because the rise in interest rate
leads to an excess money supply that moves into loanable funds market. As a result, loanable
funds supply increases owing to rise in interest rate. Likewise, decline in interest rate reduces the
amount supplied of loanable funds that endeavor to build balance in real money. Loanable assets
supply comes from the savings from the household and business, respective government and
bank credit.
Factors that influence both demand and supply of loanable funds
The variables that influences loanable funds demand and shifts the demand curve are:
Domestic and foreign investments return rate- Increase in both the domestic and foreign
investment raises loanable assets demand.
Capital productivity- Higher capital productivity increases investment rate of return.
However, the entities acquires loan for investment if the return becomes larger than rate
5MACROECONOMICS
of interest (Jakab and Kumhof 2014). Thus, growth in capital productivity increases
loanable funds demand.
Consumer and business confidence- If the individuals becomes highly confident about
economy’s future, then they opt for more loans for starting new projects or invests in
other property assets as they becomes sure about making loan repayments. This boosts
the loanable demands and moves the demand curve to right.
Opportunities in perceived business- Augmentation in opportunities of the perceived
business positively influence laonable demand assets.
Incomes of the household- Increase in household income amplify its creditworthiness
and this raises the loanable funds demand.
Real rates of interest- As Foreign rates of interest increases, it attracts the foreigners for
investing in assets and hence this enhances the loanble funds foreign demand.
Foreign and domestic risk- Higher domestic risk or decline in foreign jeopardy raises the
laonable funds demand. The reason behind this is that the investors deem expected risk
while taking any business investment decisions.
The factors that affect loanable funds supply are given below:
Enticement of savings of both household and business- Variation in policies of taxation
with the increase in debt finance leads to augmentation in enticement of business savings.
In addition, changes in policies of government induce the savings of both the household
and entities. This increases the loanable assets supply and hence the supply curve moves
to right (Jakab and Kumhof 2015). Surplus in budget-If there is a surplus in budget, the government saves more and this
positively influences the loanable supply funds.
⊘ This is a preview!⊘
Do you want full access?
Subscribe today to unlock all pages.
Trusted by 1+ million students worldwide
6MACROECONOMICS
Deficit in budget- Decline in budget deficit means that the government borrows less
money and this increases the loanable funds supply. National income-As savings increases with the rise in consumer’s income, rise in
national income enhances overall savings rate. Hence, rightward shift of the supply curve
occurs due to its increase. Time preferences-Individuals with stronger preference in time reduce their saving and
this causes decline in loanable funds supply.
Monetary policy- Monetary policy implemented by central bank directly influences the
interest rate. If the cash target rate is lowered by the central bank, it increases the loanable
assets supply.
Movements in the variable interest rates on small business loans
The erratic interest rate on business loan refers to the interest rate that is charged on the loans
and varies according to the change in market rates of interest. It is basically based on the
benchmark rates of interest and varies over time (Lindner 2013). Variable rates of interest
benefits the business as reduction in this index leads to fall in interest payments of the borrowers.
The interest rate on small business loans by a residence from December 2004 to June 2007
reflects high variation (DellʼAriccia et al. 2014). The graph reflects that the interest rate lowers
during the period of December 2004 to 2007. During the year 2008, interest rate on small
business loan increases as the central bank tries to increases cash rate. During the recession
period (2008-2009), the inflation rate increased to 4.4%, which was above the target level 2%.
However, the central bank implemented monetary policy by raising variable interest rate on
small business loans. As a result, savings of the consumer increased as their purchasing power
decreased. Therefore, rise in savings reduces the disposable income and this lowers the inflation
Paraphrase This Document
Need a fresh take? Get an instant paraphrase of this document with our AI Paraphraser
7MACROECONOMICS
rate of the economy. After the financial crisis period (2010-2013) as the inflation rate declined,
the central bank attempted to lower the variable rate of interest on business loan in order to boost
the economic growth. This implementation of this policy enhances consumer expenditure,
employment rate and business investment. During the period 2014-2017, the bank lowered
variable interest rates on loans for keeping the inflation rate below the target level and meeting
consistent sustainable economic growth.
Reduction in interest rate also provides huge opportunities to the small business firms in terms of
growth by offering access to higher credit. Moreover, the cut in rate of interest free up the small
business assets so that they have the ability to focus on their business growth. This policy also
motivates the people to deem on their savings for supporting the small business. Therefore,
reduction in variable rates of interest on small entities loans benefits the firms by expanding their
business and attains competitive advantage.
Question 2
Macroeconomic situation for both the Australian and World economies over the next 5
years
Some of the macroeconomic factors including real GDP (gross domestic product),
unemployment rate, inflation rate, GDP per capita help in assessing the performance of an
economy. Australia is displayed by their economic resilience, steady economic growth rate and
low risk business environment. Global forecast envisage that this nation will sustain it place in
the globe as the 13th biggest economy. In 2017, Australia has been considered as one of the 20
biggest nations in the globe with nominal GDP estimated to be around US$1.3 trillion and
contributes to about 1.7% of the world economy. In addition, economist forecast that Australia
8MACROECONOMICS
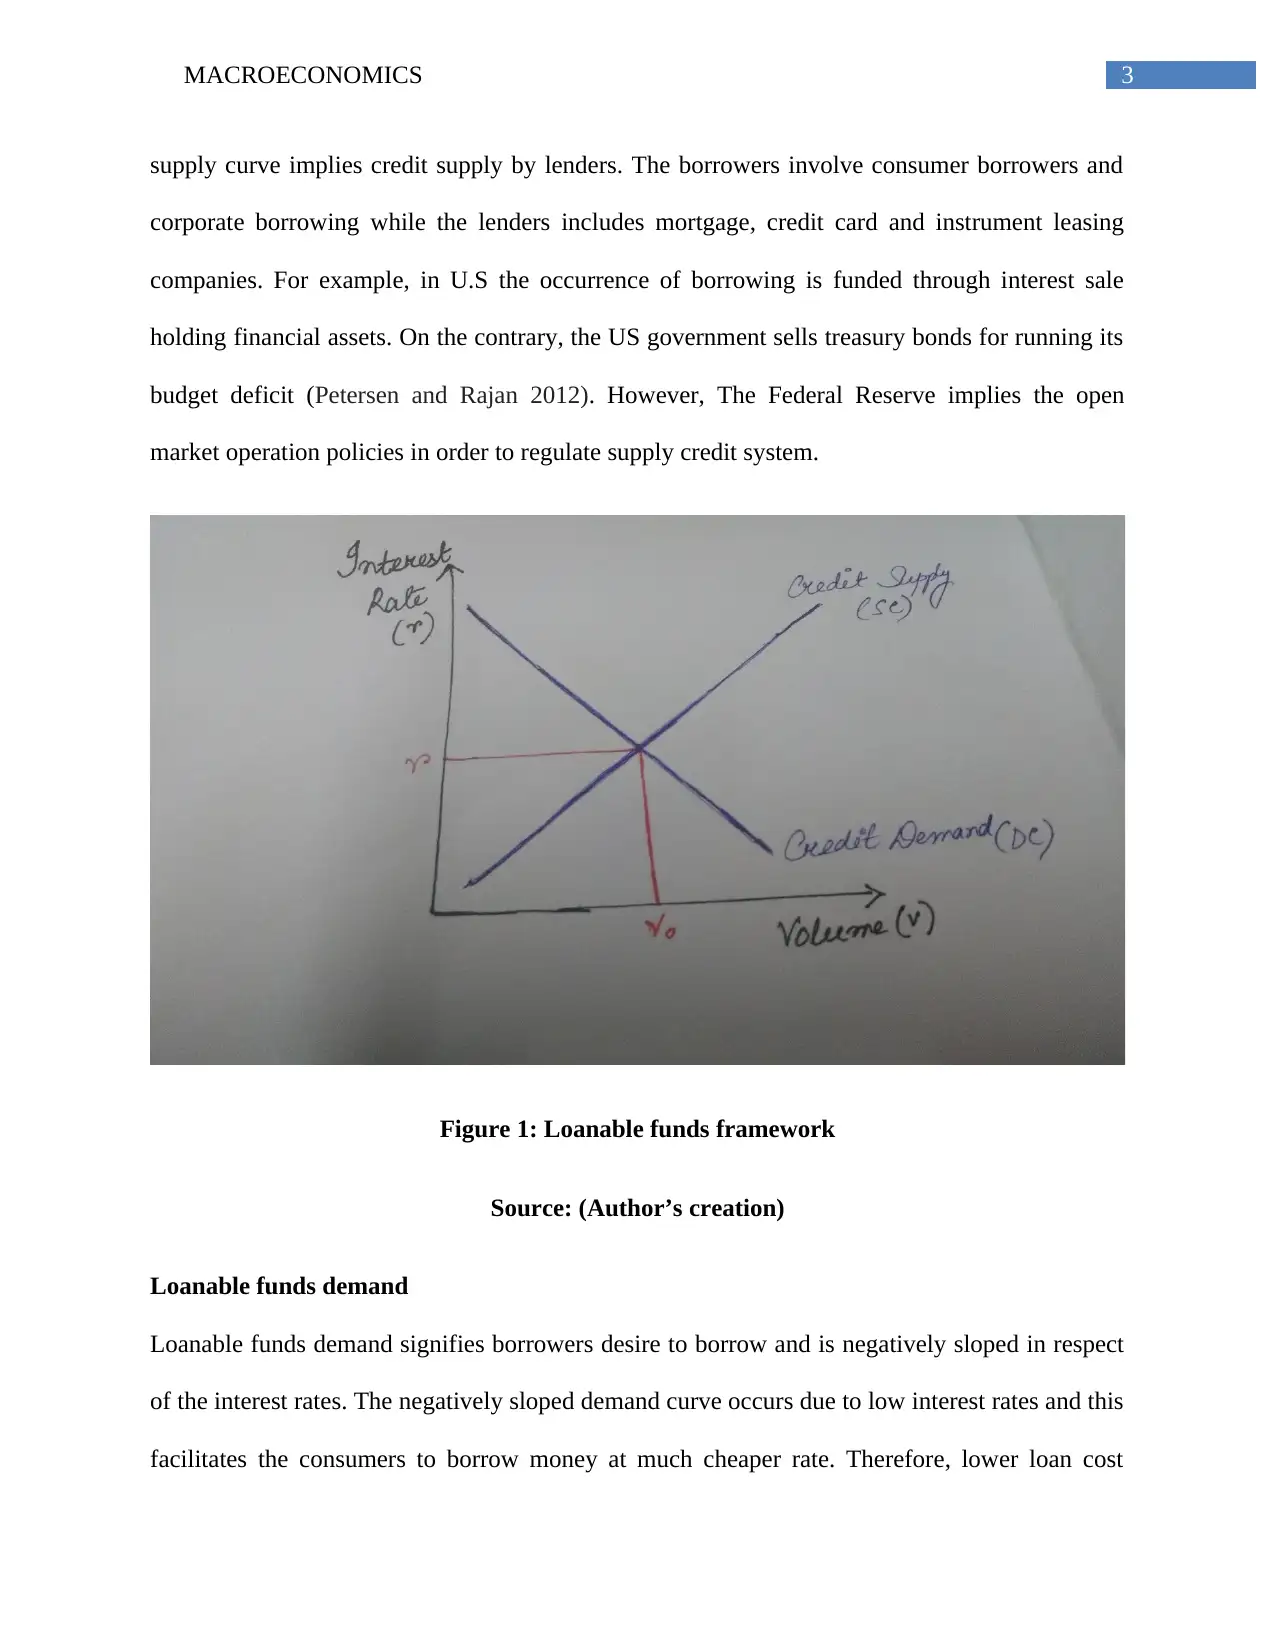
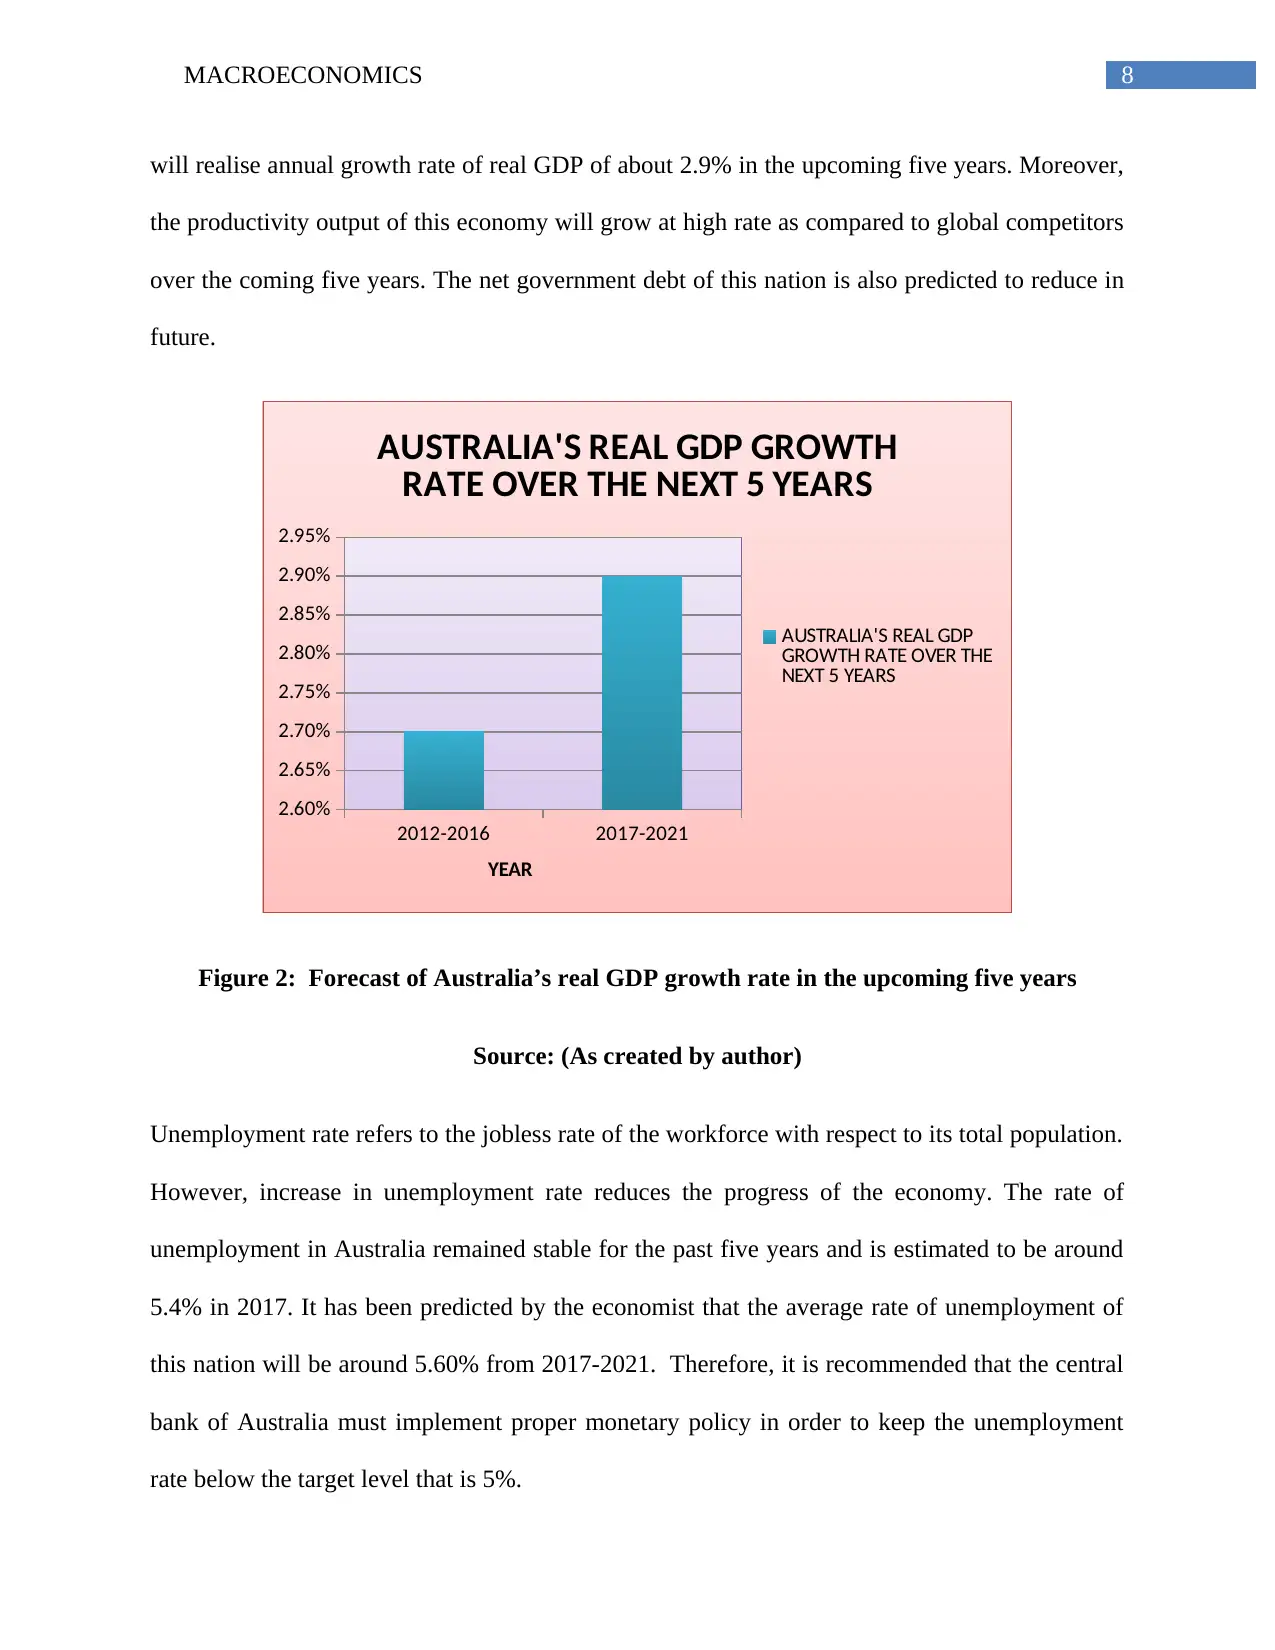
will realise annual growth rate of real GDP of about 2.9% in the upcoming five years. Moreover,
the productivity output of this economy will grow at high rate as compared to global competitors
over the coming five years. The net government debt of this nation is also predicted to reduce in
future.
2012-2016 2017-2021
2.60%
2.65%
2.70%
2.75%
2.80%
2.85%
2.90%
2.95%
AUSTRALIA'S REAL GDP GROWTH
RATE OVER THE NEXT 5 YEARS
AUSTRALIA'S REAL GDP
GROWTH RATE OVER THE
NEXT 5 YEARS
YEAR
Figure 2: Forecast of Australia’s real GDP growth rate in the upcoming five years
Source: (As created by author)
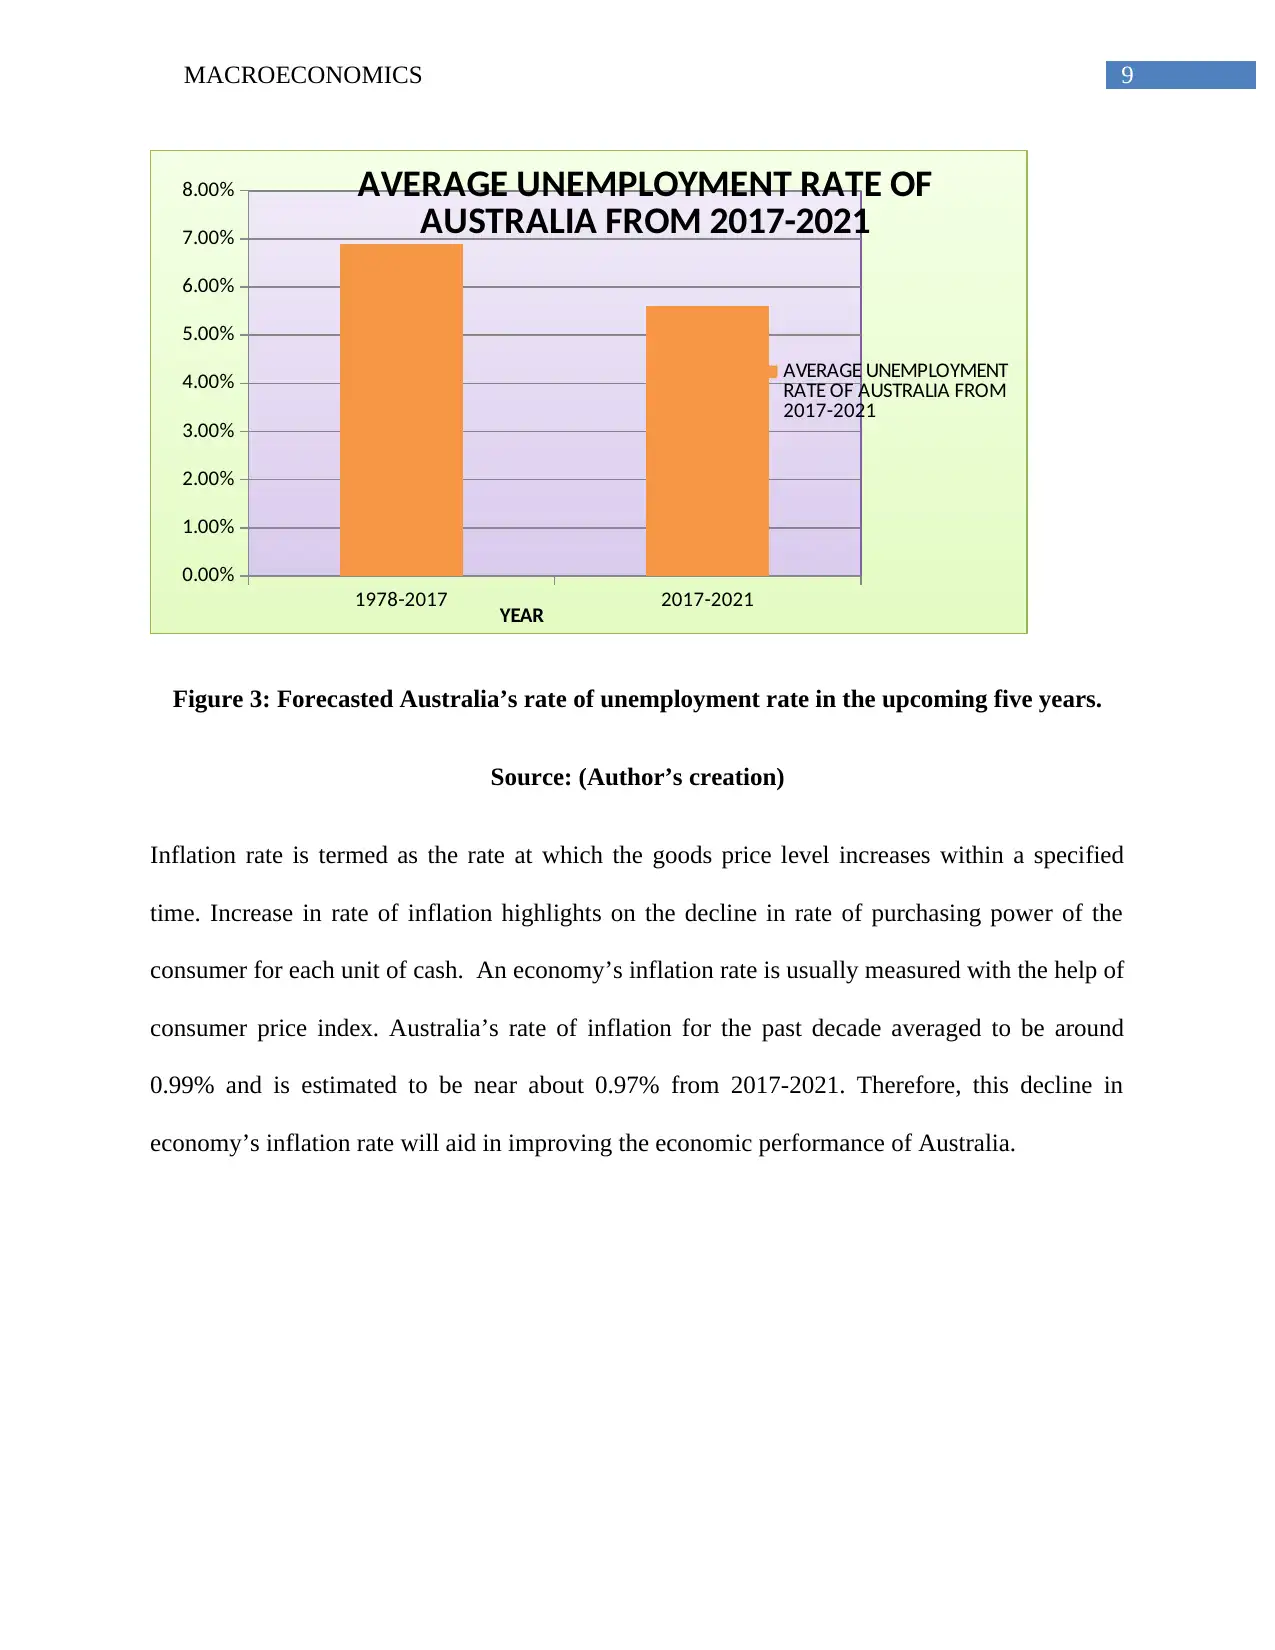
Unemployment rate refers to the jobless rate of the workforce with respect to its total population.
However, increase in unemployment rate reduces the progress of the economy. The rate of
unemployment in Australia remained stable for the past five years and is estimated to be around
5.4% in 2017. It has been predicted by the economist that the average rate of unemployment of
this nation will be around 5.60% from 2017-2021. Therefore, it is recommended that the central
bank of Australia must implement proper monetary policy in order to keep the unemployment
rate below the target level that is 5%.
will realise annual growth rate of real GDP of about 2.9% in the upcoming five years. Moreover,
the productivity output of this economy will grow at high rate as compared to global competitors
over the coming five years. The net government debt of this nation is also predicted to reduce in
future.
2012-2016 2017-2021
2.60%
2.65%
2.70%
2.75%
2.80%
2.85%
2.90%
2.95%
AUSTRALIA'S REAL GDP GROWTH
RATE OVER THE NEXT 5 YEARS
AUSTRALIA'S REAL GDP
GROWTH RATE OVER THE
NEXT 5 YEARS
YEAR
Figure 2: Forecast of Australia’s real GDP growth rate in the upcoming five years
Source: (As created by author)
Unemployment rate refers to the jobless rate of the workforce with respect to its total population.
However, increase in unemployment rate reduces the progress of the economy. The rate of
unemployment in Australia remained stable for the past five years and is estimated to be around
5.4% in 2017. It has been predicted by the economist that the average rate of unemployment of
this nation will be around 5.60% from 2017-2021. Therefore, it is recommended that the central
bank of Australia must implement proper monetary policy in order to keep the unemployment
rate below the target level that is 5%.
⊘ This is a preview!⊘
Do you want full access?
Subscribe today to unlock all pages.
Trusted by 1+ million students worldwide
9MACROECONOMICS
1978-2017 2017-2021
0.00%
1.00%
2.00%
3.00%
4.00%
5.00%
6.00%
7.00%
8.00% AVERAGE UNEMPLOYMENT RATE OF
AUSTRALIA FROM 2017-2021
AVERAGE UNEMPLOYMENT
RATE OF AUSTRALIA FROM
2017-2021
YEAR
Figure 3: Forecasted Australia’s rate of unemployment rate in the upcoming five years.
Source: (Author’s creation)
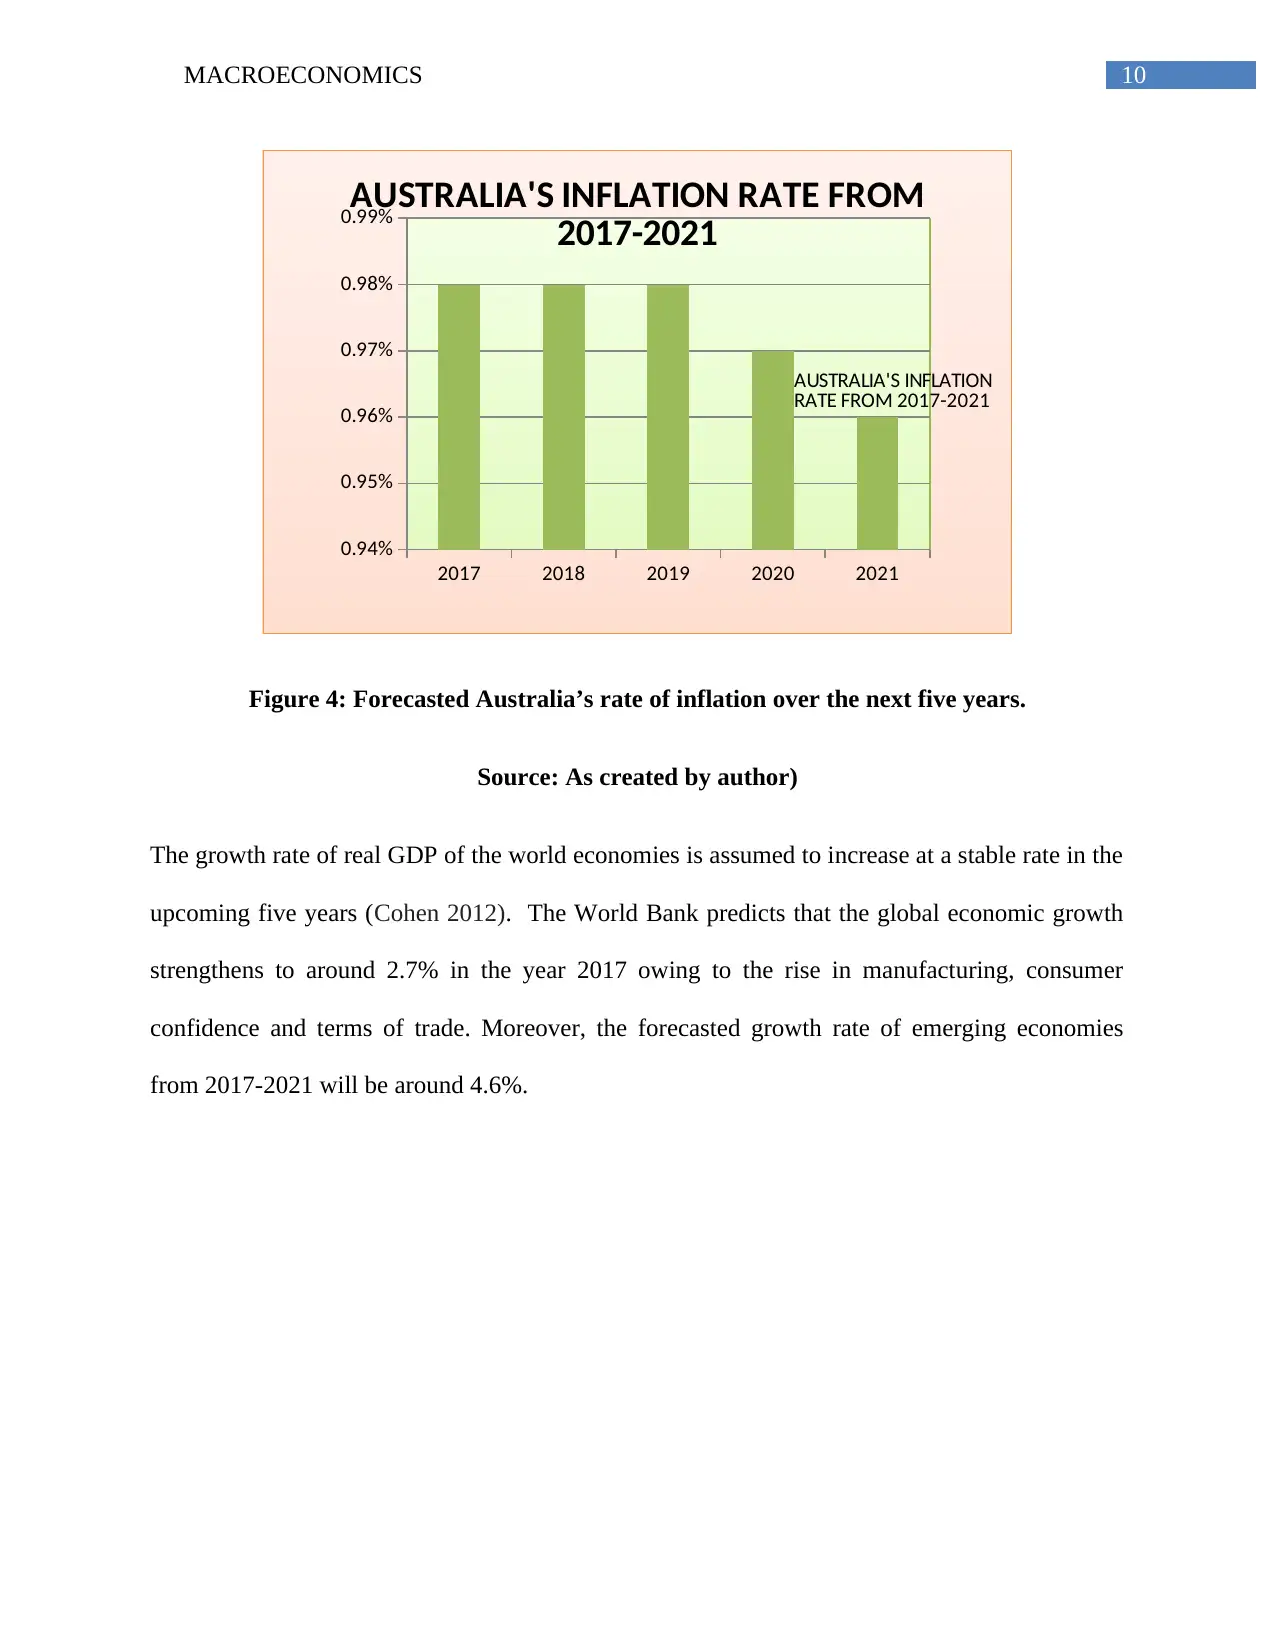
Inflation rate is termed as the rate at which the goods price level increases within a specified
time. Increase in rate of inflation highlights on the decline in rate of purchasing power of the
consumer for each unit of cash. An economy’s inflation rate is usually measured with the help of
consumer price index. Australia’s rate of inflation for the past decade averaged to be around
0.99% and is estimated to be near about 0.97% from 2017-2021. Therefore, this decline in
economy’s inflation rate will aid in improving the economic performance of Australia.
1978-2017 2017-2021
0.00%
1.00%
2.00%
3.00%
4.00%
5.00%
6.00%
7.00%
8.00% AVERAGE UNEMPLOYMENT RATE OF
AUSTRALIA FROM 2017-2021
AVERAGE UNEMPLOYMENT
RATE OF AUSTRALIA FROM
2017-2021
YEAR
Figure 3: Forecasted Australia’s rate of unemployment rate in the upcoming five years.
Source: (Author’s creation)
Inflation rate is termed as the rate at which the goods price level increases within a specified
time. Increase in rate of inflation highlights on the decline in rate of purchasing power of the
consumer for each unit of cash. An economy’s inflation rate is usually measured with the help of
consumer price index. Australia’s rate of inflation for the past decade averaged to be around
0.99% and is estimated to be near about 0.97% from 2017-2021. Therefore, this decline in
economy’s inflation rate will aid in improving the economic performance of Australia.
Paraphrase This Document
Need a fresh take? Get an instant paraphrase of this document with our AI Paraphraser
10MACROECONOMICS
2017 2018 2019 2020 2021
0.94%
0.95%
0.96%
0.97%
0.98%
0.99%
AUSTRALIA'S INFLATION RATE FROM
2017-2021
AUSTRALIA'S INFLATION
RATE FROM 2017-2021
Figure 4: Forecasted Australia’s rate of inflation over the next five years.
Source: As created by author)
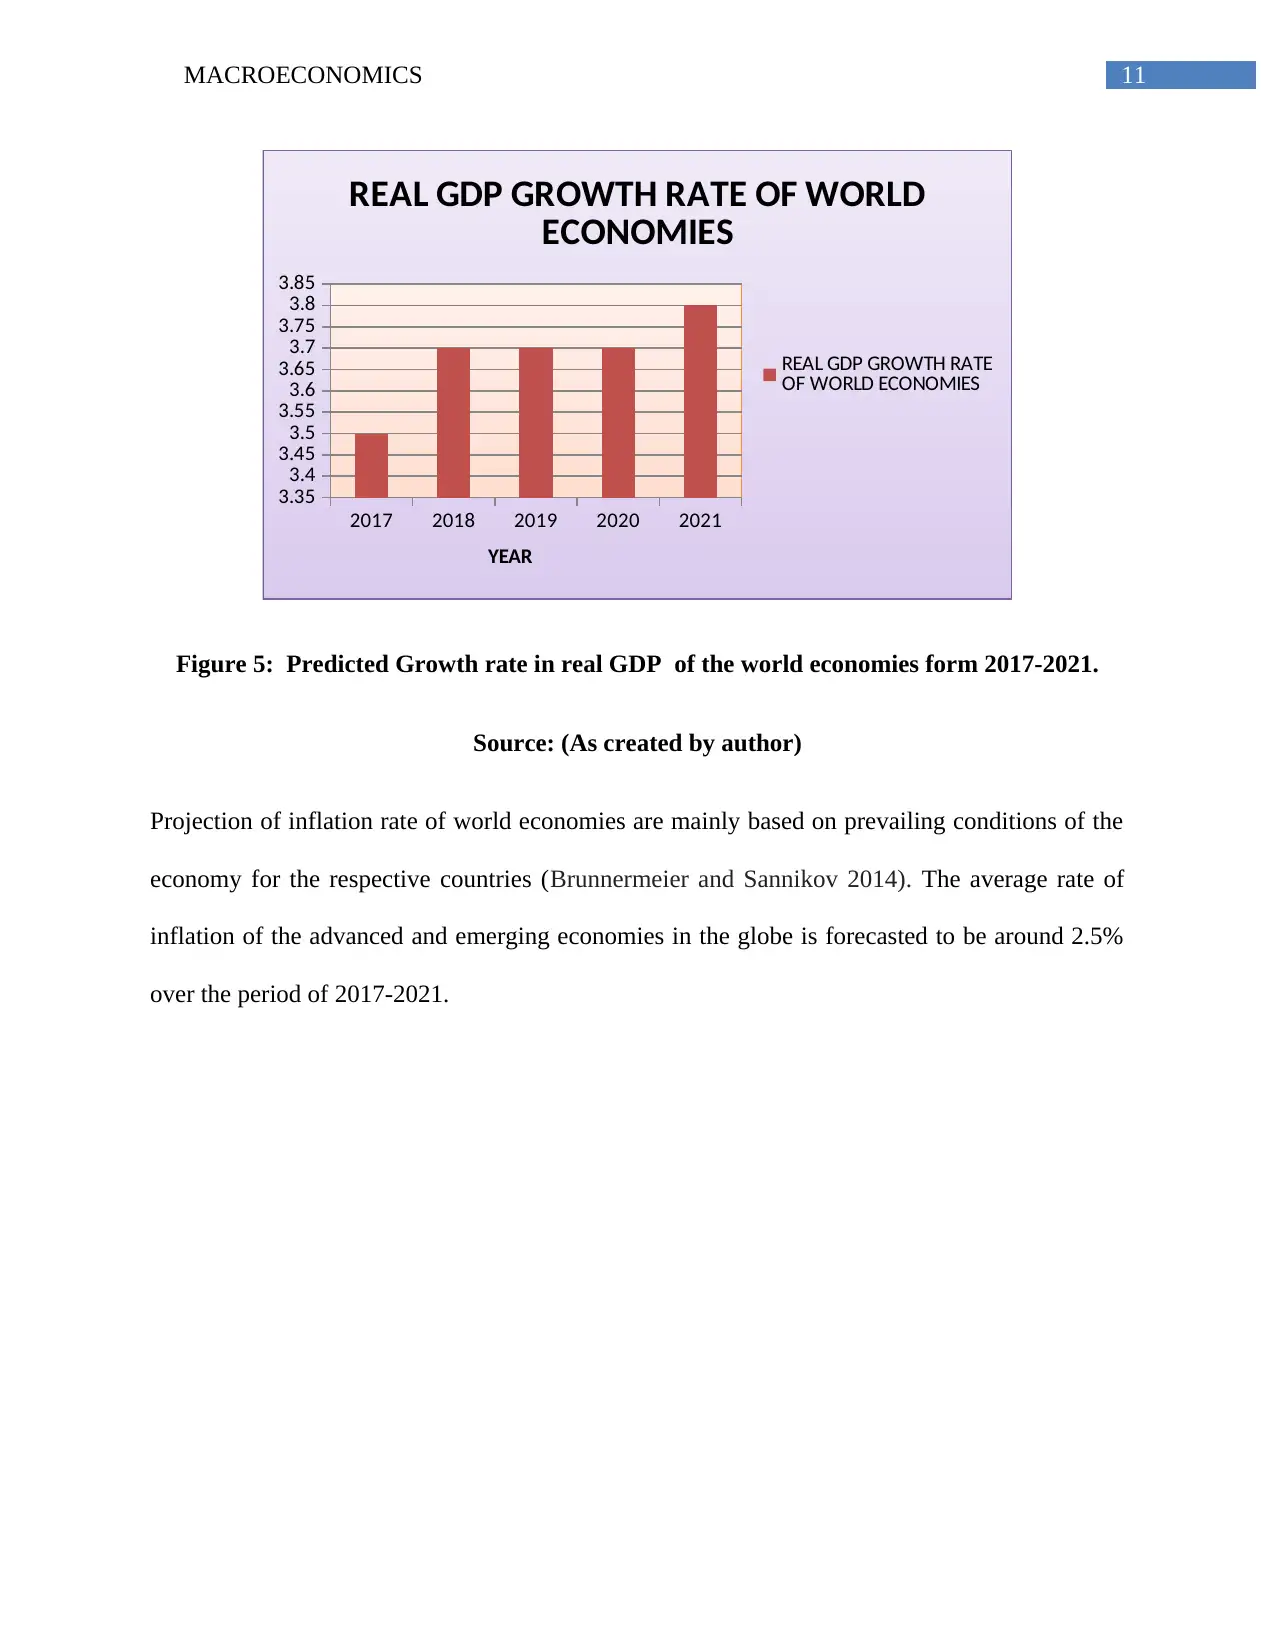
The growth rate of real GDP of the world economies is assumed to increase at a stable rate in the
upcoming five years (Cohen 2012). The World Bank predicts that the global economic growth
strengthens to around 2.7% in the year 2017 owing to the rise in manufacturing, consumer
confidence and terms of trade. Moreover, the forecasted growth rate of emerging economies
from 2017-2021 will be around 4.6%.
2017 2018 2019 2020 2021
0.94%
0.95%
0.96%
0.97%
0.98%
0.99%
AUSTRALIA'S INFLATION RATE FROM
2017-2021
AUSTRALIA'S INFLATION
RATE FROM 2017-2021
Figure 4: Forecasted Australia’s rate of inflation over the next five years.
Source: As created by author)
The growth rate of real GDP of the world economies is assumed to increase at a stable rate in the
upcoming five years (Cohen 2012). The World Bank predicts that the global economic growth
strengthens to around 2.7% in the year 2017 owing to the rise in manufacturing, consumer
confidence and terms of trade. Moreover, the forecasted growth rate of emerging economies
from 2017-2021 will be around 4.6%.
11MACROECONOMICS
2017 2018 2019 2020 2021
3.35
3.4
3.45
3.5
3.55
3.6
3.65
3.7
3.75
3.8
3.85
REAL GDP GROWTH RATE OF WORLD
ECONOMIES
REAL GDP GROWTH RATE
OF WORLD ECONOMIES
YEAR
Figure 5: Predicted Growth rate in real GDP of the world economies form 2017-2021.
Source: (As created by author)
Projection of inflation rate of world economies are mainly based on prevailing conditions of the
economy for the respective countries (Brunnermeier and Sannikov 2014). The average rate of
inflation of the advanced and emerging economies in the globe is forecasted to be around 2.5%
over the period of 2017-2021.
⊘ This is a preview!⊘
Do you want full access?
Subscribe today to unlock all pages.
Trusted by 1+ million students worldwide
1 out of 20
Related Documents


Your All-in-One AI-Powered Toolkit for Academic Success.
+13062052269
info@desklib.com
Available 24*7 on WhatsApp / Email
![[object Object]](/_next/static/media/star-bottom.7253800d.svg)
Unlock your academic potential
Copyright © 2020–2026 A2Z Services. All Rights Reserved. Developed and managed by ZUCOL.