Management Accounting Report: Bittern Ltd, Costing and Budgeting
VerifiedAdded on 2019/12/04
|16
|5042
|305
Report
AI Summary
This report delves into the core principles of management accounting, utilizing Bittern Ltd, a manufacturing company, as a case study. It explores various cost types (material, labor, overheads), costing methods (job, contract, process, service), and costing techniques (marginal, standard, absorption, historical). Task 1 analyzes cost data under different scenarios (stable production/sales/inventory, fluctuating scenarios), calculating profitability using variable and absorption costing. Task 2 presents a cost report and analysis, including performance indicators (turnover, costs, customer/employee satisfaction, profitability) and strategies for cost reduction, value enhancement, and quality improvement. Task 3 examines the budgeting process, methods, and preparation. Task 4 focuses on variance calculation, identifying causes, recommending corrective actions, and preparing an operating statement to deduce budget profit, culminating in a report to management. The report provides tables to illustrate the calculations and findings.
MANAGEMENT
ACCOUNTING
1
ACCOUNTING
1
Paraphrase This Document
Need a fresh take? Get an instant paraphrase of this document with our AI Paraphraser
Table of Contents
INTRODUCTION ...............................................................................................................................3
TASK 1.................................................................................................................................................3
1.1 Different types of costs..............................................................................................................3
1.2 Different types of costing methods............................................................................................3
1.3 Costing techniques.....................................................................................................................4
1.4 Analyse the cost data..................................................................................................................5
1) Stable production, sales and inventory........................................................................................5
2) Stable sales but fluctuating production, sales and inventory.......................................................5
3) Stable production but fluctuating sales and inventory................................................................6
TASK 2 ................................................................................................................................................7
2.1 Cost report and analysis.............................................................................................................7
2.2 Various performance indicators used to identify potential improvements.................................8
2.3 Ways to reduce costs, enhance value and quality......................................................................8
TASK 3 ................................................................................................................................................9
3.1 Purpose and nature of budgeting process..................................................................................9
3.2 Budgeting method and its need................................................................................................10
3.3 Budget preparation...................................................................................................................10
TASK 4...............................................................................................................................................12
1.1 Variance calculation, identify possible causes and recommend corrective actions.................12
1.2 Operating statement to deduce budget profit for May.............................................................13
1.3 Report the findings to management.........................................................................................14
REFERENCES...................................................................................................................................15
Index of Tables
Table 1: Calculation of profitability by variable costing......................................................................5
Table 2: Calculation of profitability by absorption costing..................................................................5
Table 3: Calculation of profitability by variable costing .....................................................................5
Table 4: Calculation of profitability by absorption costing.................................................................6
Table 5: Calculation of profitability by variable costing......................................................................6
Table 6: Calculation of profitability by absorption costing..................................................................7
Table 7: Material purchase budget......................................................................................................10
Table 8: Trade payable budgets..........................................................................................................11
Table 9: Cash budget of Antonio for six months ending on 31st December, 2016............................11
Table 10: Calculation of variances.....................................................................................................12
Table 11: Operating statement to deduce budget profit for May........................................................13
2
INTRODUCTION
Looking at the present competitive business world, management accounting plays an
inevitable role in the success of corporations. It is the process through which managers use
internally and external available information for the forecasting and decision-making process. It
contributes to make planning, reviewing and evaluating the success of the business. Present project
report is based on Bittern Ltd, it is a manufacturing concern who is engaged in production and
selling of the products to meet customer demand timely. The report will demonstrated different
types of costs, costing method, budgeting process and variance analysis that assist business to
achieve their target goals.
TASK 1
1.1 Different types of costs
Elements: There are three types of costs that are material, labour and overheads. Being a
manufacturing organization, expenditures that will be incurred by Bittern Ltd. to buy raw material is
called material cost (Chen and et.al., 2009). However, labour's wages is called labour costs and all
the other expenditures that are directly related to the production functions are called overheads such
as royalty and cost of moulds etc.
Nature: Direct costs are those which Bittern Ltd incurred directly for the goods
manufacturing such as material, labour and production expenses (Smith and et.al., 2009). While, all
the other expenses which are not related to the production are called indirect costs such as office
rent, stationery etc.
Function: Production costs involve indirect expenses on production like factory rent,
lighting etc. Administration costs includes expenses such as salaries, office rent, stationery, postage
etc. However, all the expenses which Bittern Ltd, incurred to sale goods in the market are called
selling and distribution costs such as delivery charges, advertisement, free delivery costs etc. (Cao
and et.al., 2009).
Behaviour: Expenses which are not impacted by different production volume of Bittern Ltd
are called fixed costs like depreciation, insurance etc. While, expenditures which increase or
decrease along with the rising and falling the production volume are called variable costs such as
material (Wait and et.al., 2013). On contrary, expenditures which is remains constant up to a fixed
production volume and thereafter get changes according to the output level are called semi-variable
costs like electricity bill.
3
⊘ This is a preview!⊘
Do you want full access?
Subscribe today to unlock all pages.
Trusted by 1+ million students worldwide

1.2 Different types of costing methods
There are number of costing methods available to businesses to ascertain their product costs,
explained below:
Job costing: It is the method which accumulates all the direct as well as indirect expenditure
associated to a specific job (Garrison and et.al., 2010). This method is suitable for the organizations
who carry out their work after receiving customer order and their requests.
Contract costing: This costing method applies to contract based work such as construction
of building (Zhang and et.al., 2011). This method assist managers to ascertain costs for the work
completed till the period and after finishing the total work, it helps to determine total cost of the
contract.
Process costing: In case, when production is carried out through the different stages or
process involved is known as process costing (Darvas and et.al., 2012). This costing method helps
to ascertain costs of each process and transfer it into the next process and at the end, total
production costs will be identified.
Service costing: This method is uses by service rendering organizations such as water
supply department and electricity department to determine the costs of provided services.
1.3 Costing techniques
Costing techniques refers to the process through which organizations can allocate
expenditures effectively to determine their product costs.
Marginal costing/variable costing: According to CIMA London, marginal costing is the
method that helps to ascertain product costs and determine the impact of changes in costs, prices
and volume on the profitability (Penny and et.al., 2011). This method segregate total production
cost into fixed as well as variable costs. This method is also known as variable costing because it
exclude fixed costs in the cost ascertainment.
Standard costing: This technique evaluate actual production costs with the standard so as to
assess the effectiveness of business operations and aims at taking corrective actions to eliminate
adverse performance.
Absorption costing/Full costing technique: In this technique, all the fixed as well as
variable expenditures are taken into consideration to determine total product costs (Ogunlana and
et.al., 2010). This method is also known as full costing technique because it take into account all the
expenditures whether fixed or variable related to the production.
Historical costing: It is the technique to determine costs after incurred the expenditures so
that costs can be computed for the work done in the past. It helps to compare current costs with the
4
Paraphrase This Document
Need a fresh take? Get an instant paraphrase of this document with our AI Paraphraser
previous costs which may yield good results.
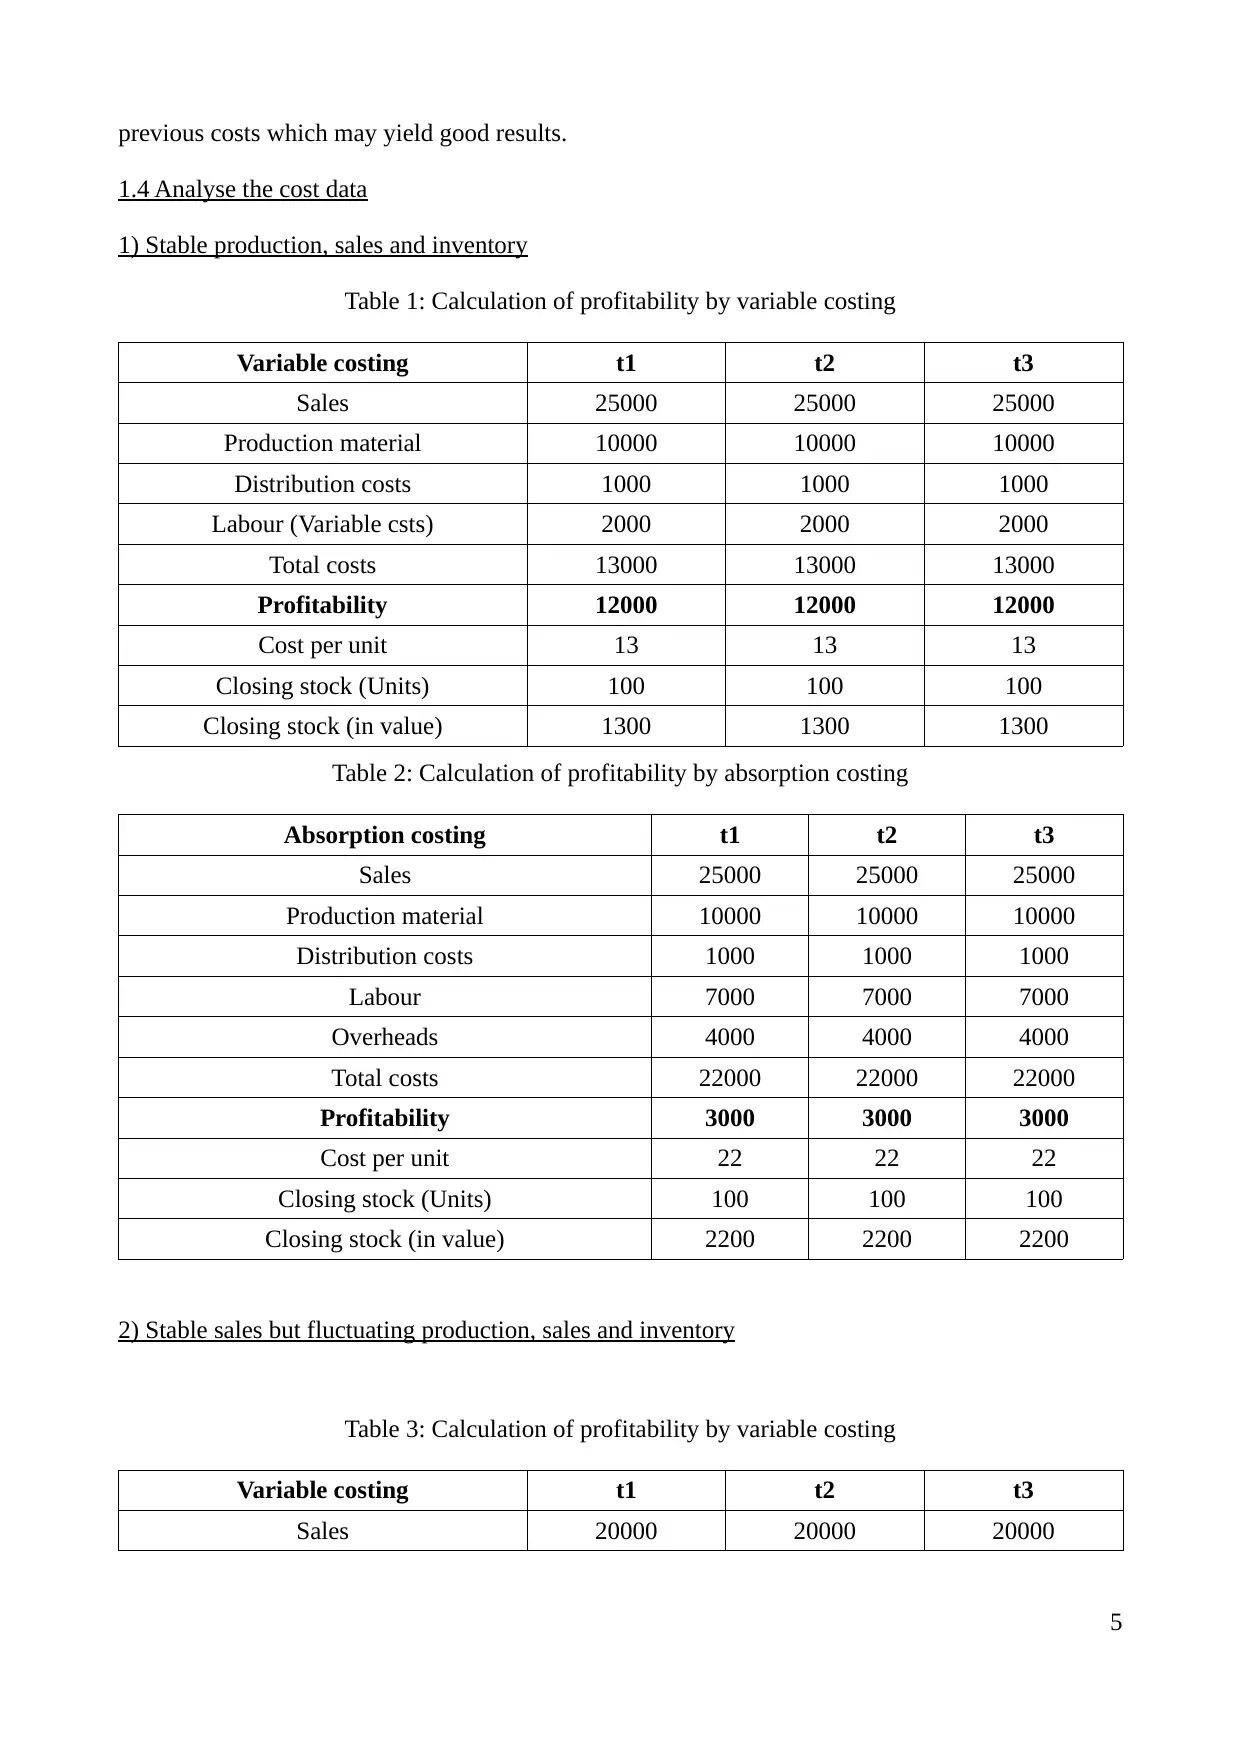
1.4 Analyse the cost data
1) Stable production, sales and inventory
Table 1: Calculation of profitability by variable costing
Variable costing t1 t2 t3
Sales 25000 25000 25000
Production material 10000 10000 10000
Distribution costs 1000 1000 1000
Labour (Variable csts) 2000 2000 2000
Total costs 13000 13000 13000
Profitability 12000 12000 12000
Cost per unit 13 13 13
Closing stock (Units) 100 100 100
Closing stock (in value) 1300 1300 1300
Table 2: Calculation of profitability by absorption costing
Absorption costing t1 t2 t3
Sales 25000 25000 25000
Production material 10000 10000 10000
Distribution costs 1000 1000 1000
Labour 7000 7000 7000
Overheads 4000 4000 4000
Total costs 22000 22000 22000
Profitability 3000 3000 3000
Cost per unit 22 22 22
Closing stock (Units) 100 100 100
Closing stock (in value) 2200 2200 2200
2) Stable sales but fluctuating production, sales and inventory
Table 3: Calculation of profitability by variable costing
Variable costing t1 t2 t3
Sales 20000 20000 20000
5
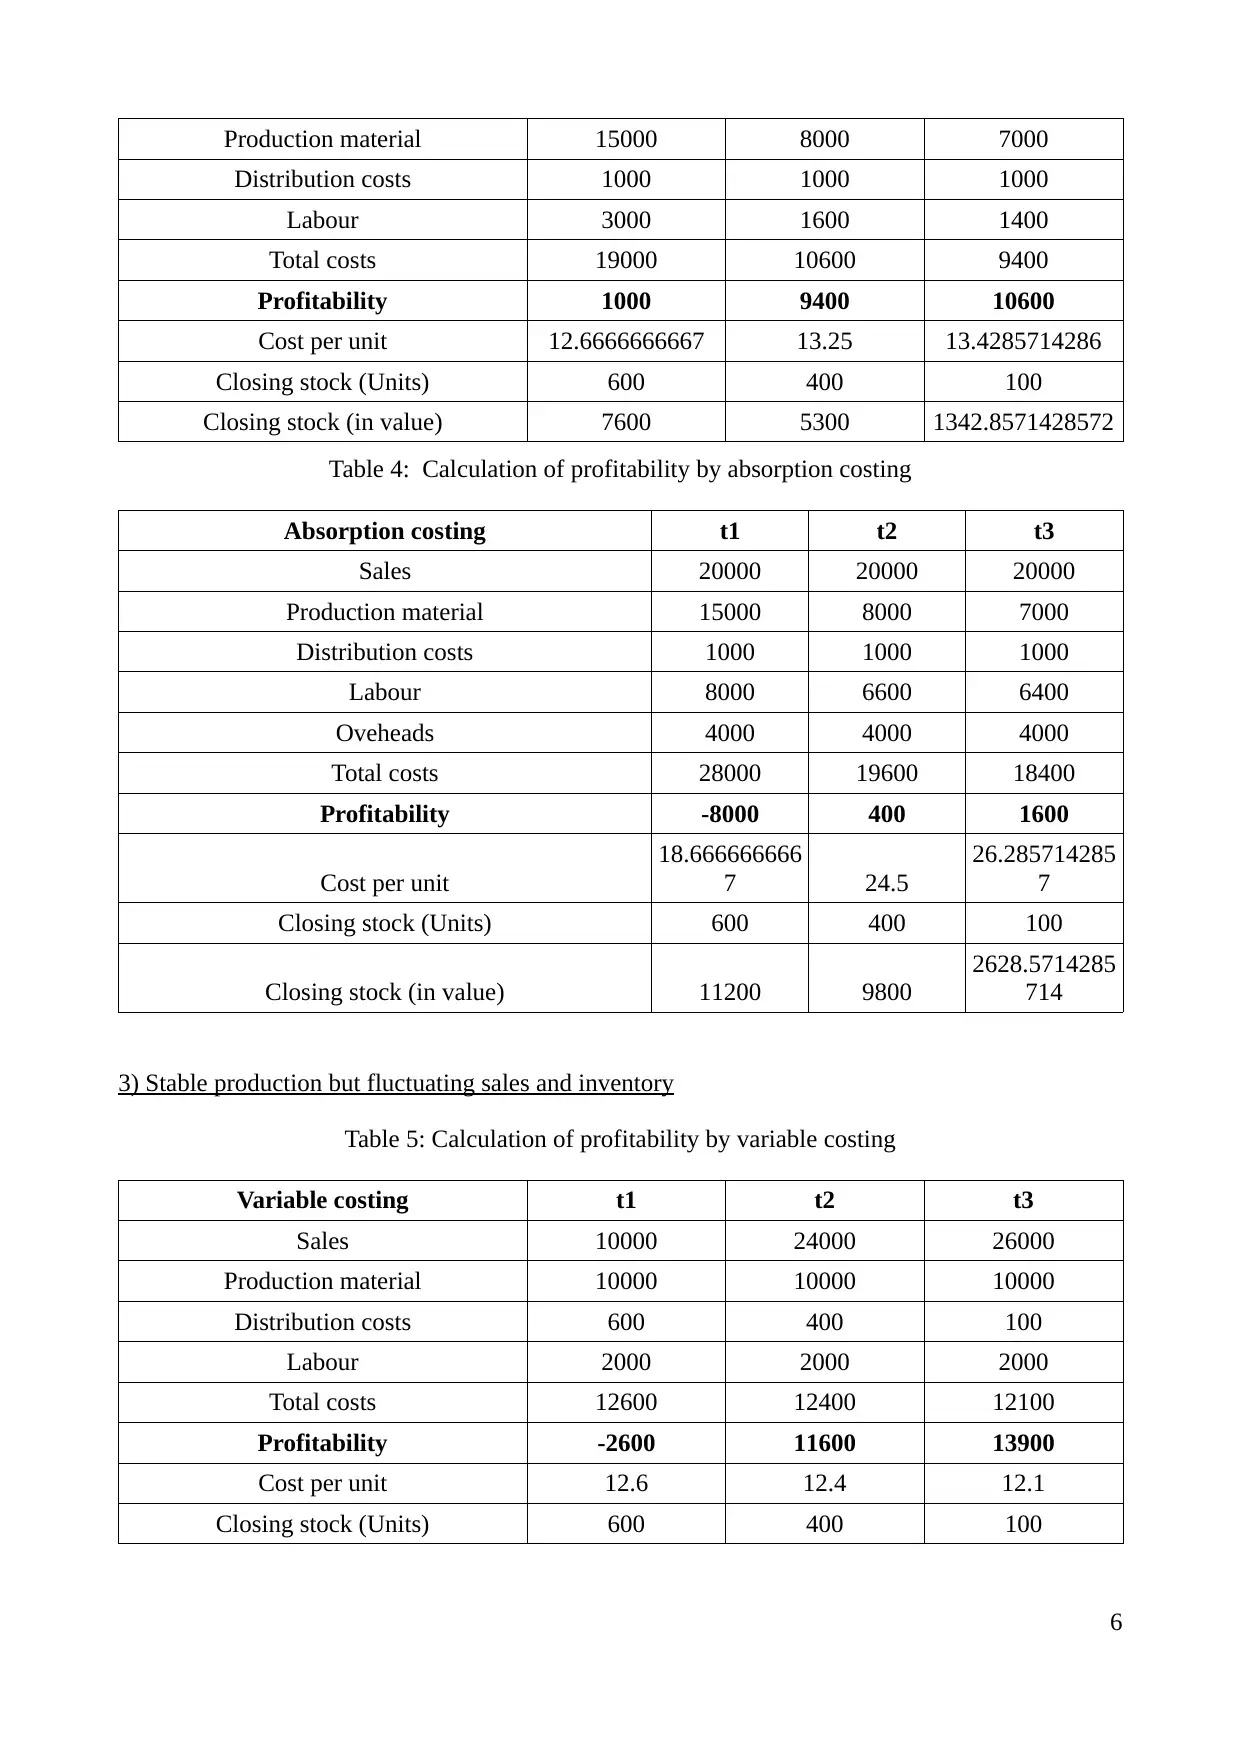
Production material 15000 8000 7000
Distribution costs 1000 1000 1000
Labour 3000 1600 1400
Total costs 19000 10600 9400
Profitability 1000 9400 10600
Cost per unit 12.6666666667 13.25 13.4285714286
Closing stock (Units) 600 400 100
Closing stock (in value) 7600 5300 1342.8571428572
Table 4: Calculation of profitability by absorption costing
Absorption costing t1 t2 t3
Sales 20000 20000 20000
Production material 15000 8000 7000
Distribution costs 1000 1000 1000
Labour 8000 6600 6400
Oveheads 4000 4000 4000
Total costs 28000 19600 18400
Profitability -8000 400 1600
Cost per unit
18.666666666
7 24.5
26.285714285
7
Closing stock (Units) 600 400 100
Closing stock (in value) 11200 9800
2628.5714285
714
3) Stable production but fluctuating sales and inventory
Table 5: Calculation of profitability by variable costing
Variable costing t1 t2 t3
Sales 10000 24000 26000
Production material 10000 10000 10000
Distribution costs 600 400 100
Labour 2000 2000 2000
Total costs 12600 12400 12100
Profitability -2600 11600 13900
Cost per unit 12.6 12.4 12.1
Closing stock (Units) 600 400 100
6
Distribution costs 1000 1000 1000
Labour 3000 1600 1400
Total costs 19000 10600 9400
Profitability 1000 9400 10600
Cost per unit 12.6666666667 13.25 13.4285714286
Closing stock (Units) 600 400 100
Closing stock (in value) 7600 5300 1342.8571428572
Table 4: Calculation of profitability by absorption costing
Absorption costing t1 t2 t3
Sales 20000 20000 20000
Production material 15000 8000 7000
Distribution costs 1000 1000 1000
Labour 8000 6600 6400
Oveheads 4000 4000 4000
Total costs 28000 19600 18400
Profitability -8000 400 1600
Cost per unit
18.666666666
7 24.5
26.285714285
7
Closing stock (Units) 600 400 100
Closing stock (in value) 11200 9800
2628.5714285
714
3) Stable production but fluctuating sales and inventory
Table 5: Calculation of profitability by variable costing
Variable costing t1 t2 t3
Sales 10000 24000 26000
Production material 10000 10000 10000
Distribution costs 600 400 100
Labour 2000 2000 2000
Total costs 12600 12400 12100
Profitability -2600 11600 13900
Cost per unit 12.6 12.4 12.1
Closing stock (Units) 600 400 100
6
⊘ This is a preview!⊘
Do you want full access?
Subscribe today to unlock all pages.
Trusted by 1+ million students worldwide
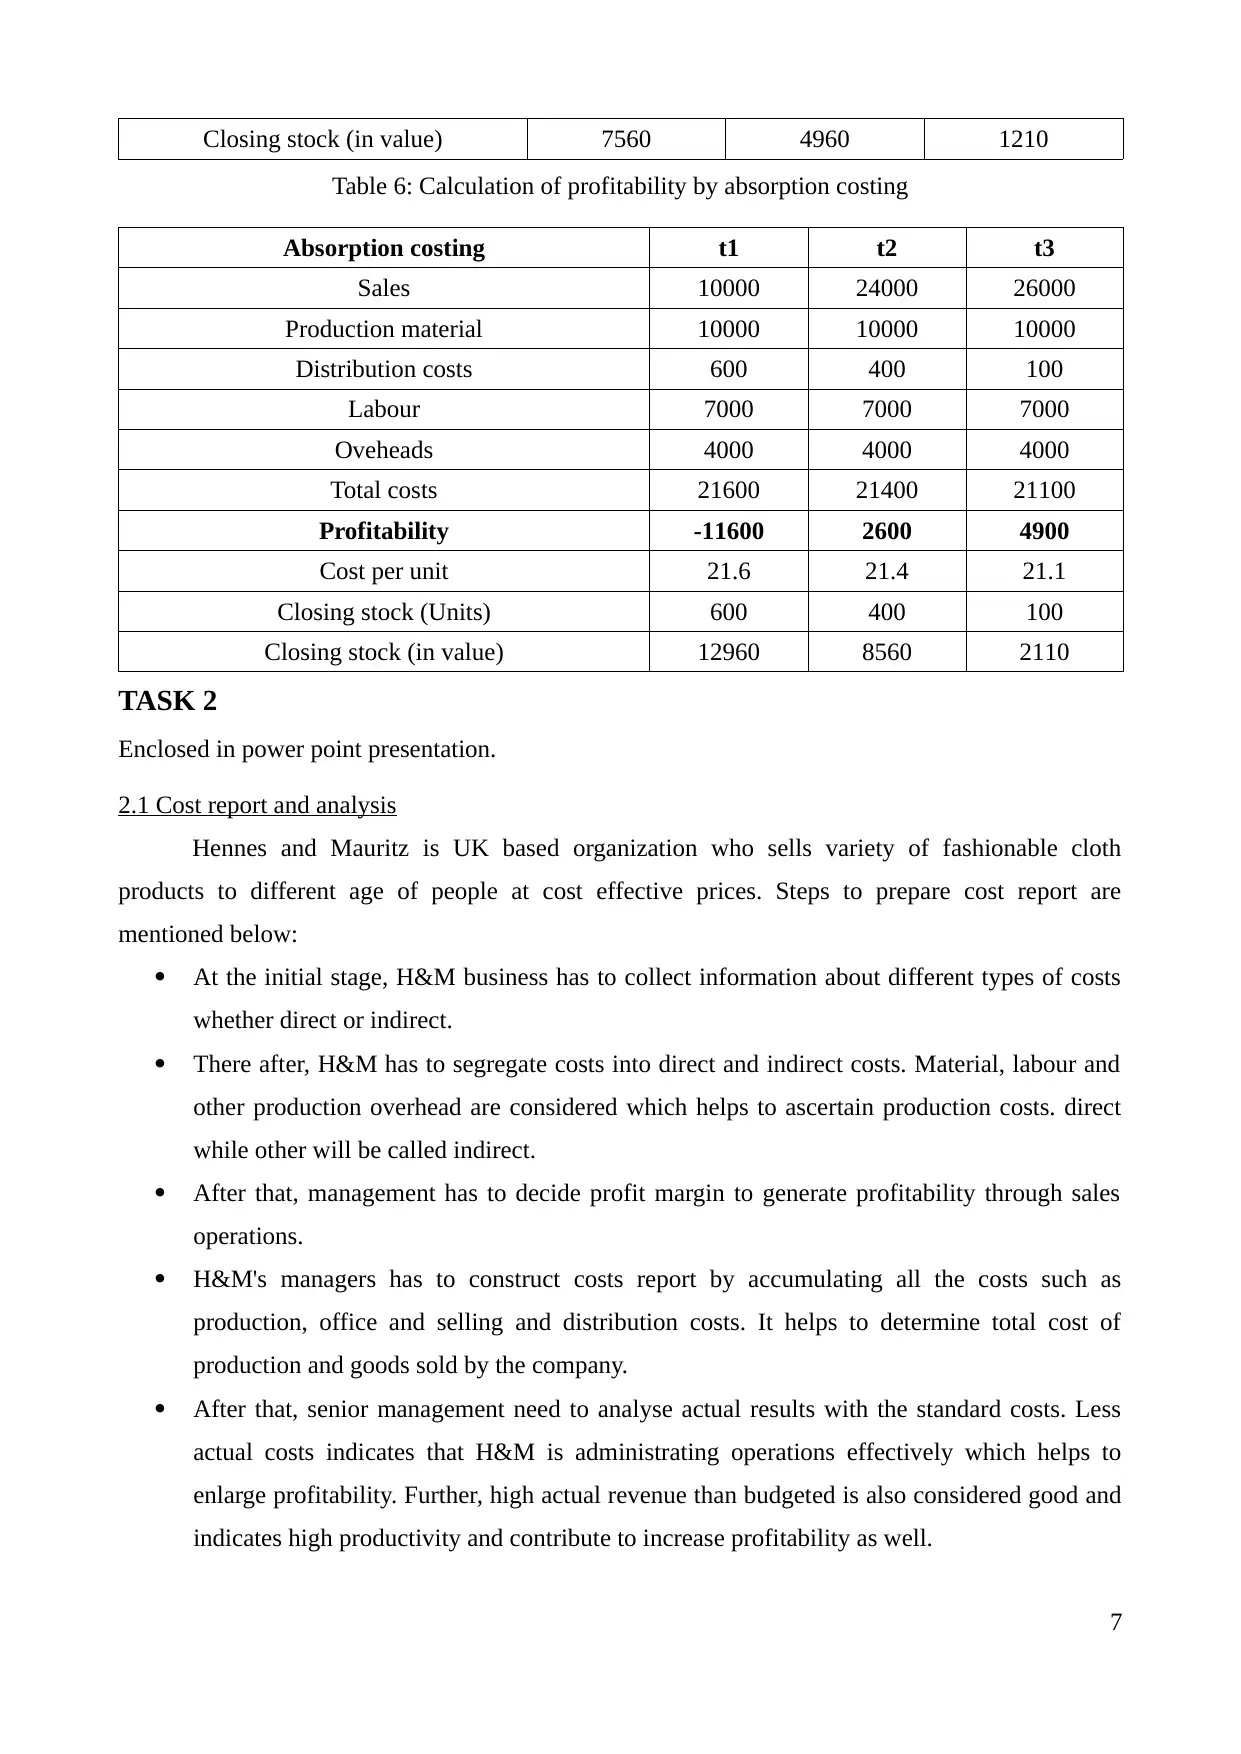
Closing stock (in value) 7560 4960 1210
Table 6: Calculation of profitability by absorption costing
Absorption costing t1 t2 t3
Sales 10000 24000 26000
Production material 10000 10000 10000
Distribution costs 600 400 100
Labour 7000 7000 7000
Oveheads 4000 4000 4000
Total costs 21600 21400 21100
Profitability -11600 2600 4900
Cost per unit 21.6 21.4 21.1
Closing stock (Units) 600 400 100
Closing stock (in value) 12960 8560 2110
TASK 2
Enclosed in power point presentation.
2.1 Cost report and analysis
Hennes and Mauritz is UK based organization who sells variety of fashionable cloth
products to different age of people at cost effective prices. Steps to prepare cost report are
mentioned below:
At the initial stage, H&M business has to collect information about different types of costs
whether direct or indirect.
There after, H&M has to segregate costs into direct and indirect costs. Material, labour and
other production overhead are considered which helps to ascertain production costs. direct
while other will be called indirect.
After that, management has to decide profit margin to generate profitability through sales
operations.
H&M's managers has to construct costs report by accumulating all the costs such as
production, office and selling and distribution costs. It helps to determine total cost of
production and goods sold by the company.
After that, senior management need to analyse actual results with the standard costs. Less
actual costs indicates that H&M is administrating operations effectively which helps to
enlarge profitability. Further, high actual revenue than budgeted is also considered good and
indicates high productivity and contribute to increase profitability as well.
7
Paraphrase This Document
Need a fresh take? Get an instant paraphrase of this document with our AI Paraphraser
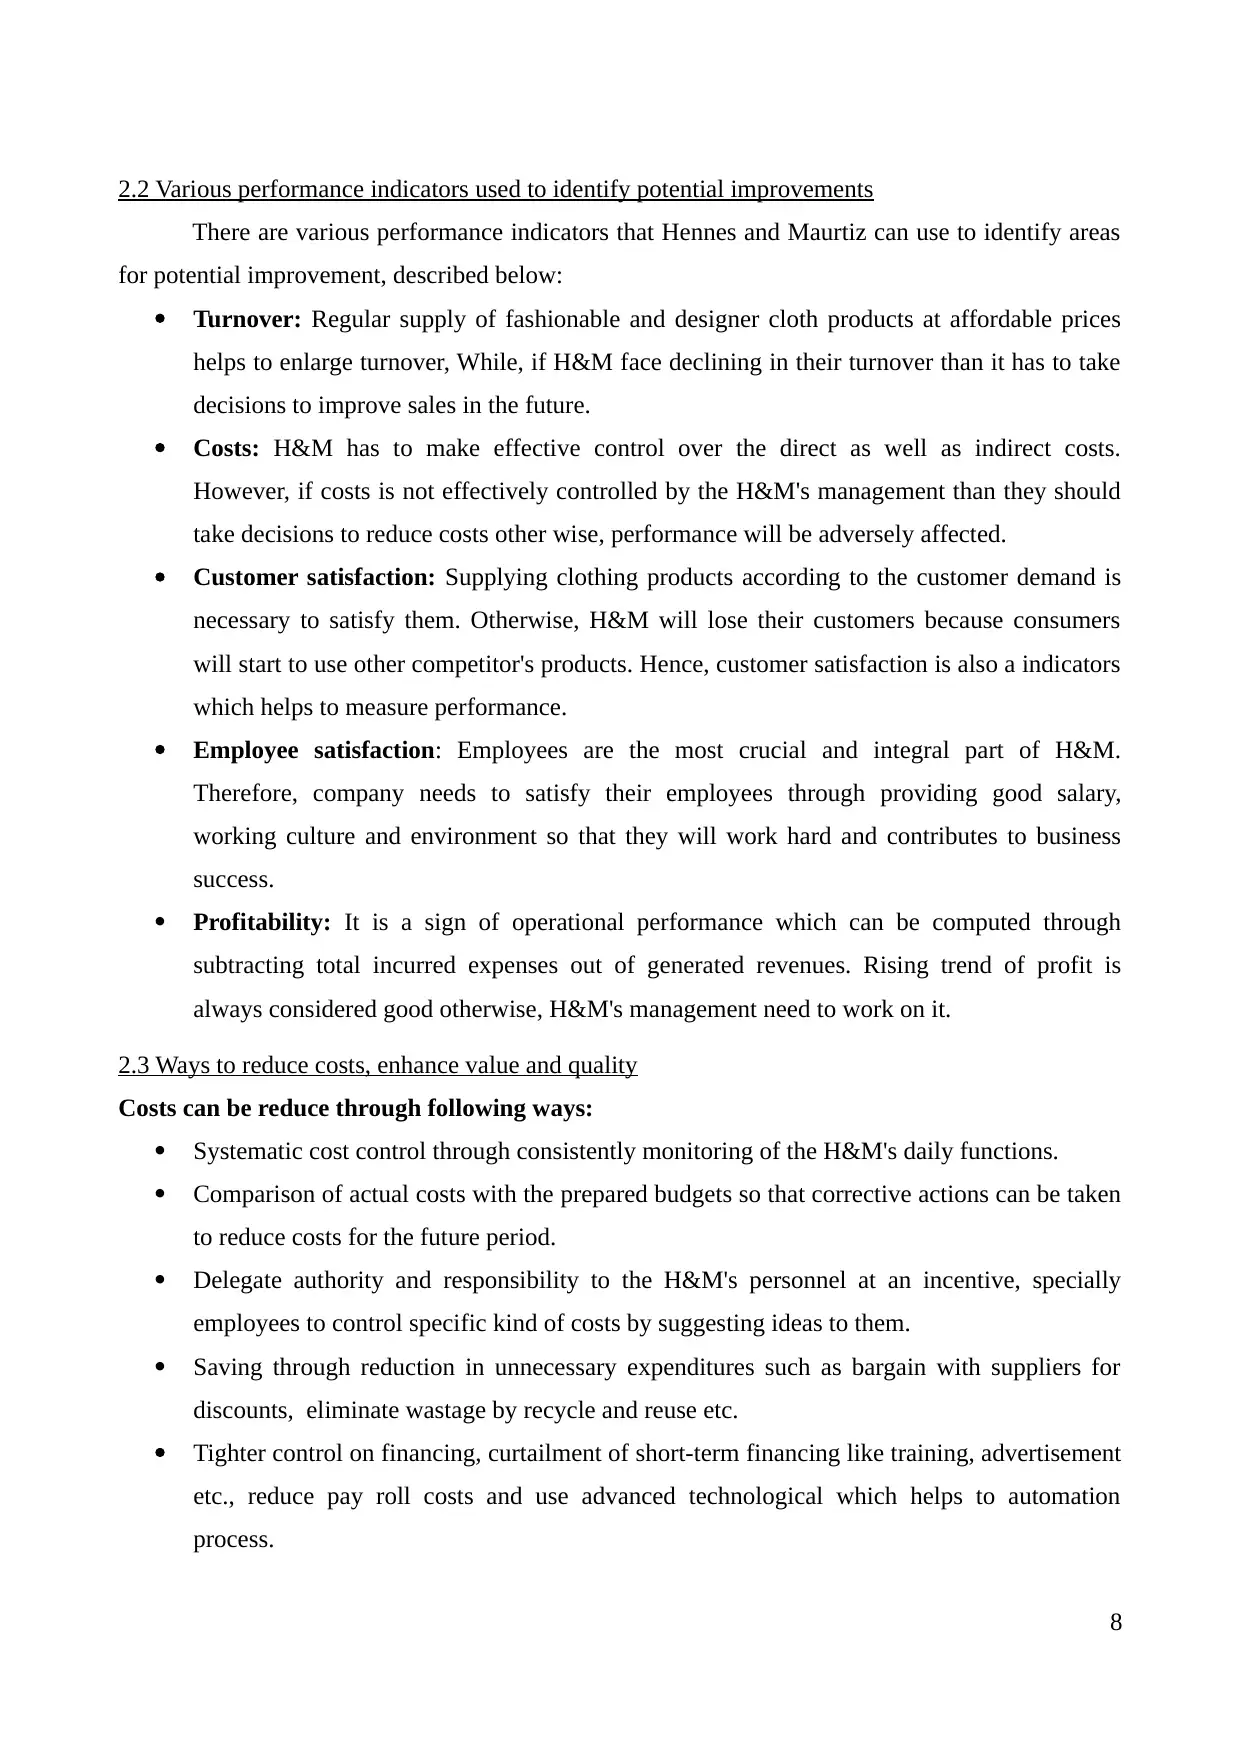
2.2 Various performance indicators used to identify potential improvements
There are various performance indicators that Hennes and Maurtiz can use to identify areas
for potential improvement, described below:
Turnover: Regular supply of fashionable and designer cloth products at affordable prices
helps to enlarge turnover, While, if H&M face declining in their turnover than it has to take
decisions to improve sales in the future.
Costs: H&M has to make effective control over the direct as well as indirect costs.
However, if costs is not effectively controlled by the H&M's management than they should
take decisions to reduce costs other wise, performance will be adversely affected.
Customer satisfaction: Supplying clothing products according to the customer demand is
necessary to satisfy them. Otherwise, H&M will lose their customers because consumers
will start to use other competitor's products. Hence, customer satisfaction is also a indicators
which helps to measure performance.
Employee satisfaction: Employees are the most crucial and integral part of H&M.
Therefore, company needs to satisfy their employees through providing good salary,
working culture and environment so that they will work hard and contributes to business
success.
Profitability: It is a sign of operational performance which can be computed through
subtracting total incurred expenses out of generated revenues. Rising trend of profit is
always considered good otherwise, H&M's management need to work on it.
2.3 Ways to reduce costs, enhance value and quality
Costs can be reduce through following ways:
Systematic cost control through consistently monitoring of the H&M's daily functions.
Comparison of actual costs with the prepared budgets so that corrective actions can be taken
to reduce costs for the future period.
Delegate authority and responsibility to the H&M's personnel at an incentive, specially
employees to control specific kind of costs by suggesting ideas to them.
Saving through reduction in unnecessary expenditures such as bargain with suppliers for
discounts, eliminate wastage by recycle and reuse etc.
Tighter control on financing, curtailment of short-term financing like training, advertisement
etc., reduce pay roll costs and use advanced technological which helps to automation
process.
8
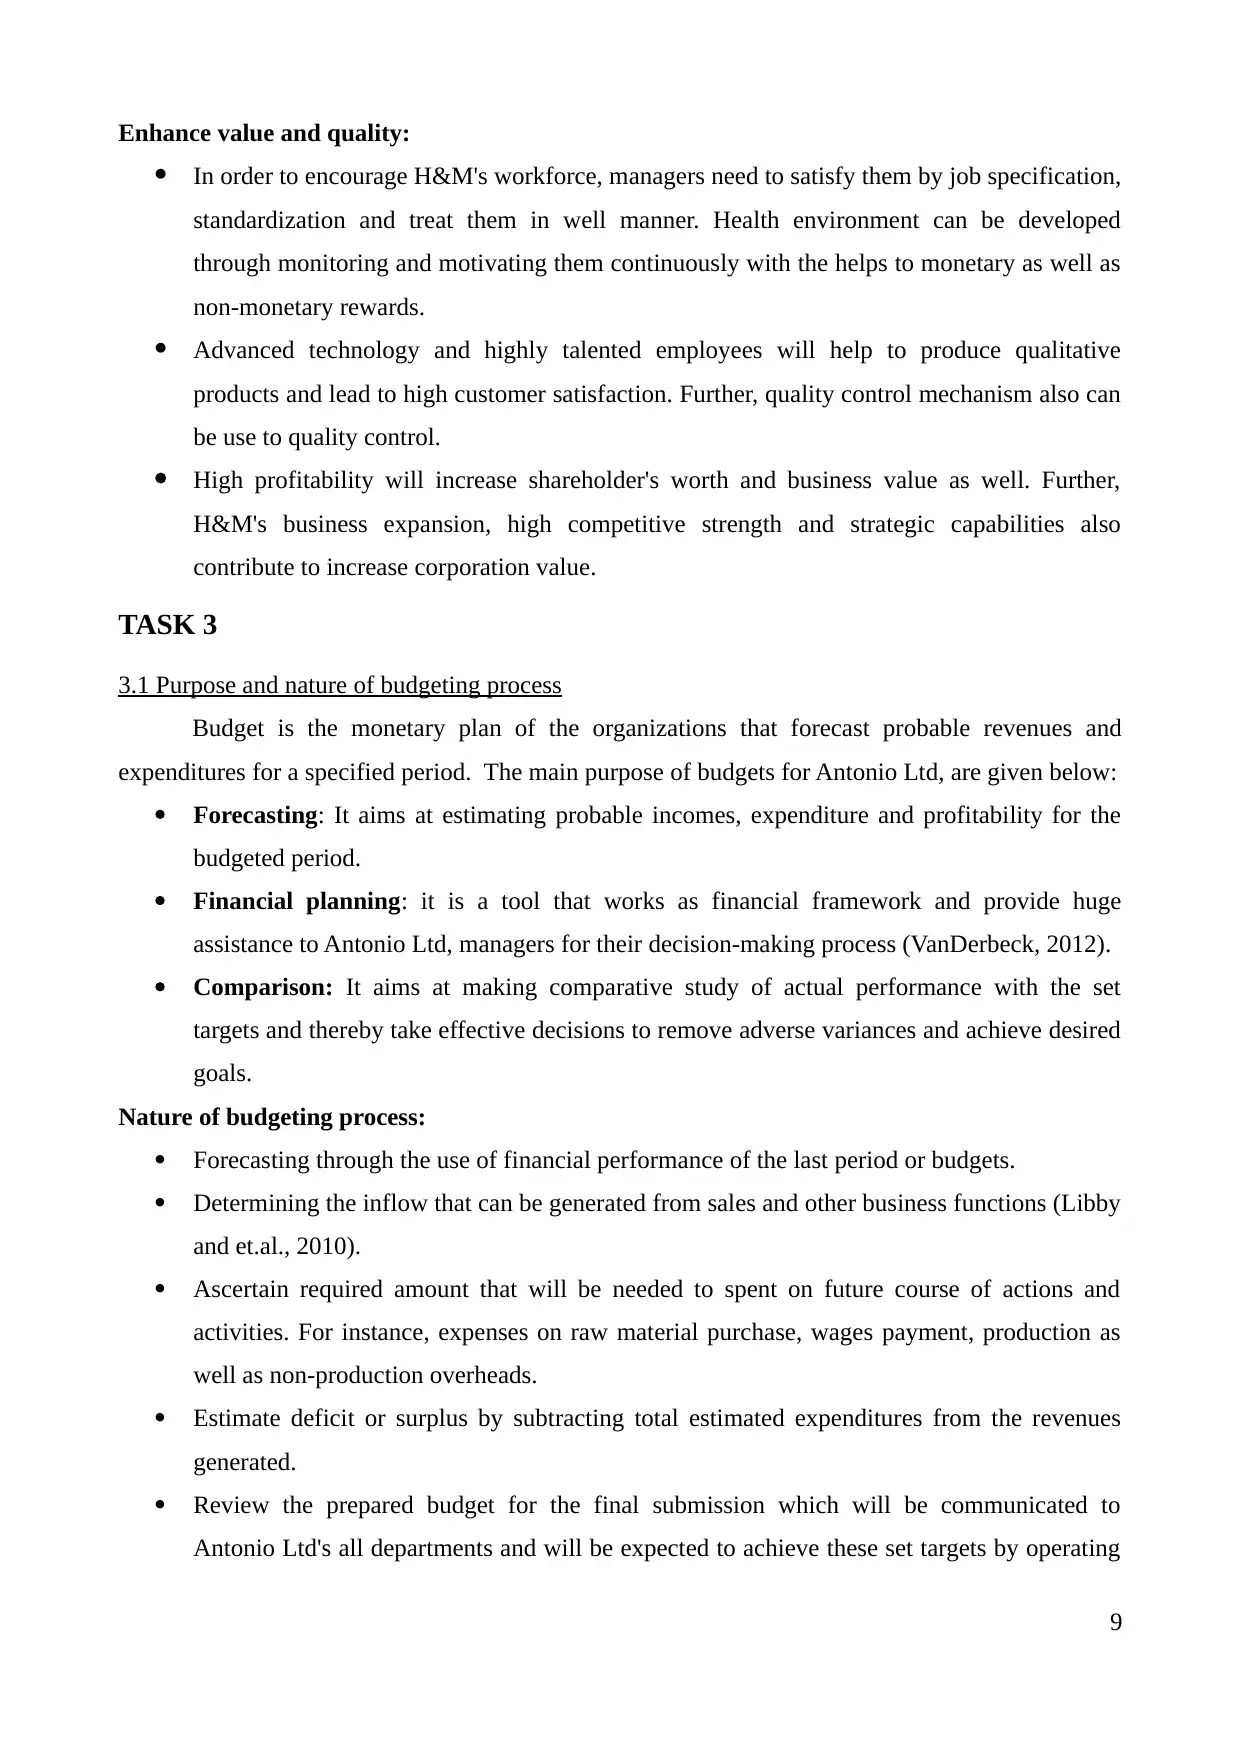
Enhance value and quality:
In order to encourage H&M's workforce, managers need to satisfy them by job specification,
standardization and treat them in well manner. Health environment can be developed
through monitoring and motivating them continuously with the helps to monetary as well as
non-monetary rewards.
Advanced technology and highly talented employees will help to produce qualitative
products and lead to high customer satisfaction. Further, quality control mechanism also can
be use to quality control.
High profitability will increase shareholder's worth and business value as well. Further,
H&M's business expansion, high competitive strength and strategic capabilities also
contribute to increase corporation value.
TASK 3
3.1 Purpose and nature of budgeting process
Budget is the monetary plan of the organizations that forecast probable revenues and
expenditures for a specified period. The main purpose of budgets for Antonio Ltd, are given below:
Forecasting: It aims at estimating probable incomes, expenditure and profitability for the
budgeted period.
Financial planning: it is a tool that works as financial framework and provide huge
assistance to Antonio Ltd, managers for their decision-making process (VanDerbeck, 2012).
Comparison: It aims at making comparative study of actual performance with the set
targets and thereby take effective decisions to remove adverse variances and achieve desired
goals.
Nature of budgeting process:
Forecasting through the use of financial performance of the last period or budgets.
Determining the inflow that can be generated from sales and other business functions (Libby
and et.al., 2010).
Ascertain required amount that will be needed to spent on future course of actions and
activities. For instance, expenses on raw material purchase, wages payment, production as
well as non-production overheads.
Estimate deficit or surplus by subtracting total estimated expenditures from the revenues
generated.
Review the prepared budget for the final submission which will be communicated to
Antonio Ltd's all departments and will be expected to achieve these set targets by operating
9
⊘ This is a preview!⊘
Do you want full access?
Subscribe today to unlock all pages.
Trusted by 1+ million students worldwide
accordingly.
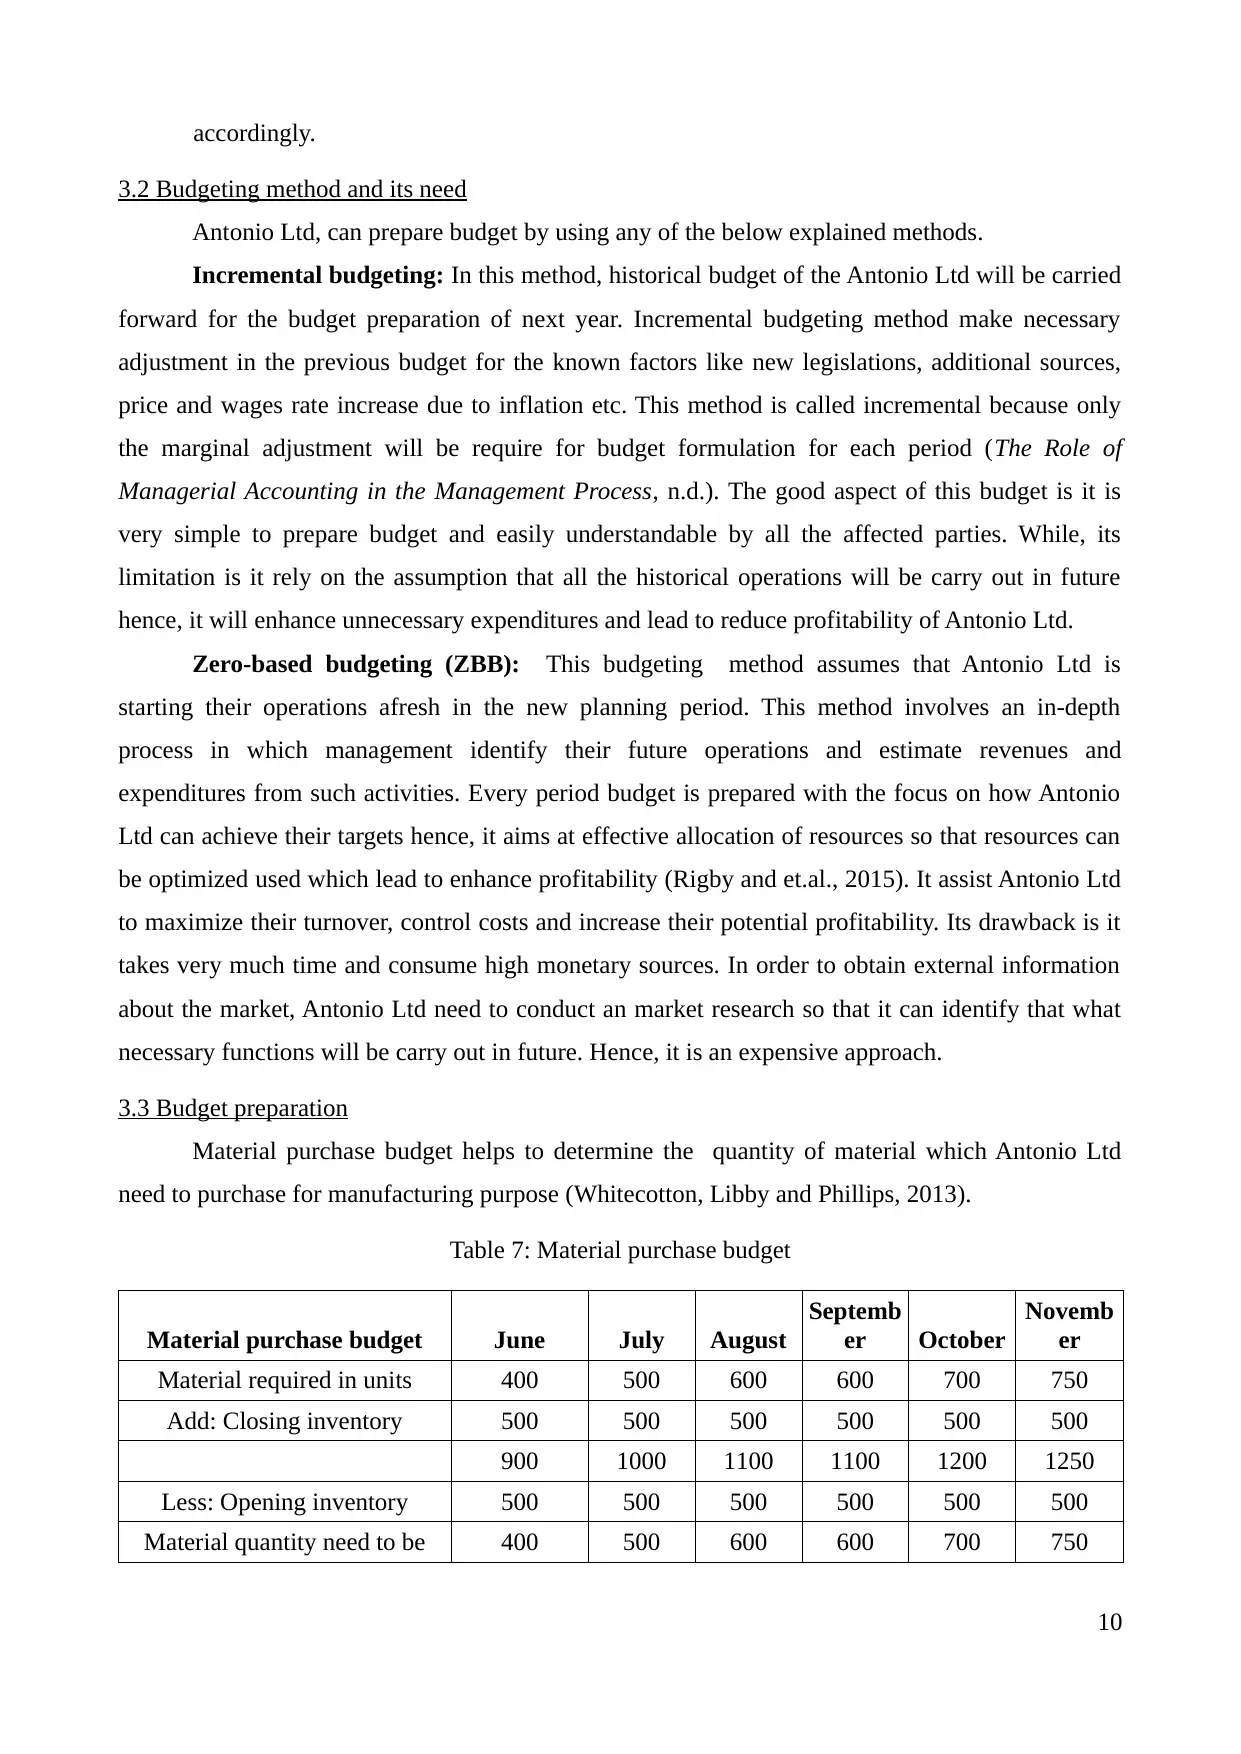
3.2 Budgeting method and its need
Antonio Ltd, can prepare budget by using any of the below explained methods.
Incremental budgeting: In this method, historical budget of the Antonio Ltd will be carried
forward for the budget preparation of next year. Incremental budgeting method make necessary
adjustment in the previous budget for the known factors like new legislations, additional sources,
price and wages rate increase due to inflation etc. This method is called incremental because only
the marginal adjustment will be require for budget formulation for each period (The Role of
Managerial Accounting in the Management Process, n.d.). The good aspect of this budget is it is
very simple to prepare budget and easily understandable by all the affected parties. While, its
limitation is it rely on the assumption that all the historical operations will be carry out in future
hence, it will enhance unnecessary expenditures and lead to reduce profitability of Antonio Ltd.
Zero-based budgeting (ZBB): This budgeting method assumes that Antonio Ltd is
starting their operations afresh in the new planning period. This method involves an in-depth
process in which management identify their future operations and estimate revenues and
expenditures from such activities. Every period budget is prepared with the focus on how Antonio
Ltd can achieve their targets hence, it aims at effective allocation of resources so that resources can
be optimized used which lead to enhance profitability (Rigby and et.al., 2015). It assist Antonio Ltd
to maximize their turnover, control costs and increase their potential profitability. Its drawback is it
takes very much time and consume high monetary sources. In order to obtain external information
about the market, Antonio Ltd need to conduct an market research so that it can identify that what
necessary functions will be carry out in future. Hence, it is an expensive approach.
3.3 Budget preparation
Material purchase budget helps to determine the quantity of material which Antonio Ltd
need to purchase for manufacturing purpose (Whitecotton, Libby and Phillips, 2013).
Table 7: Material purchase budget
Material purchase budget June July August
Septemb
er October
Novemb
er
Material required in units 400 500 600 600 700 750
Add: Closing inventory 500 500 500 500 500 500
900 1000 1100 1100 1200 1250
Less: Opening inventory 500 500 500 500 500 500
Material quantity need to be 400 500 600 600 700 750
10
Paraphrase This Document
Need a fresh take? Get an instant paraphrase of this document with our AI Paraphraser
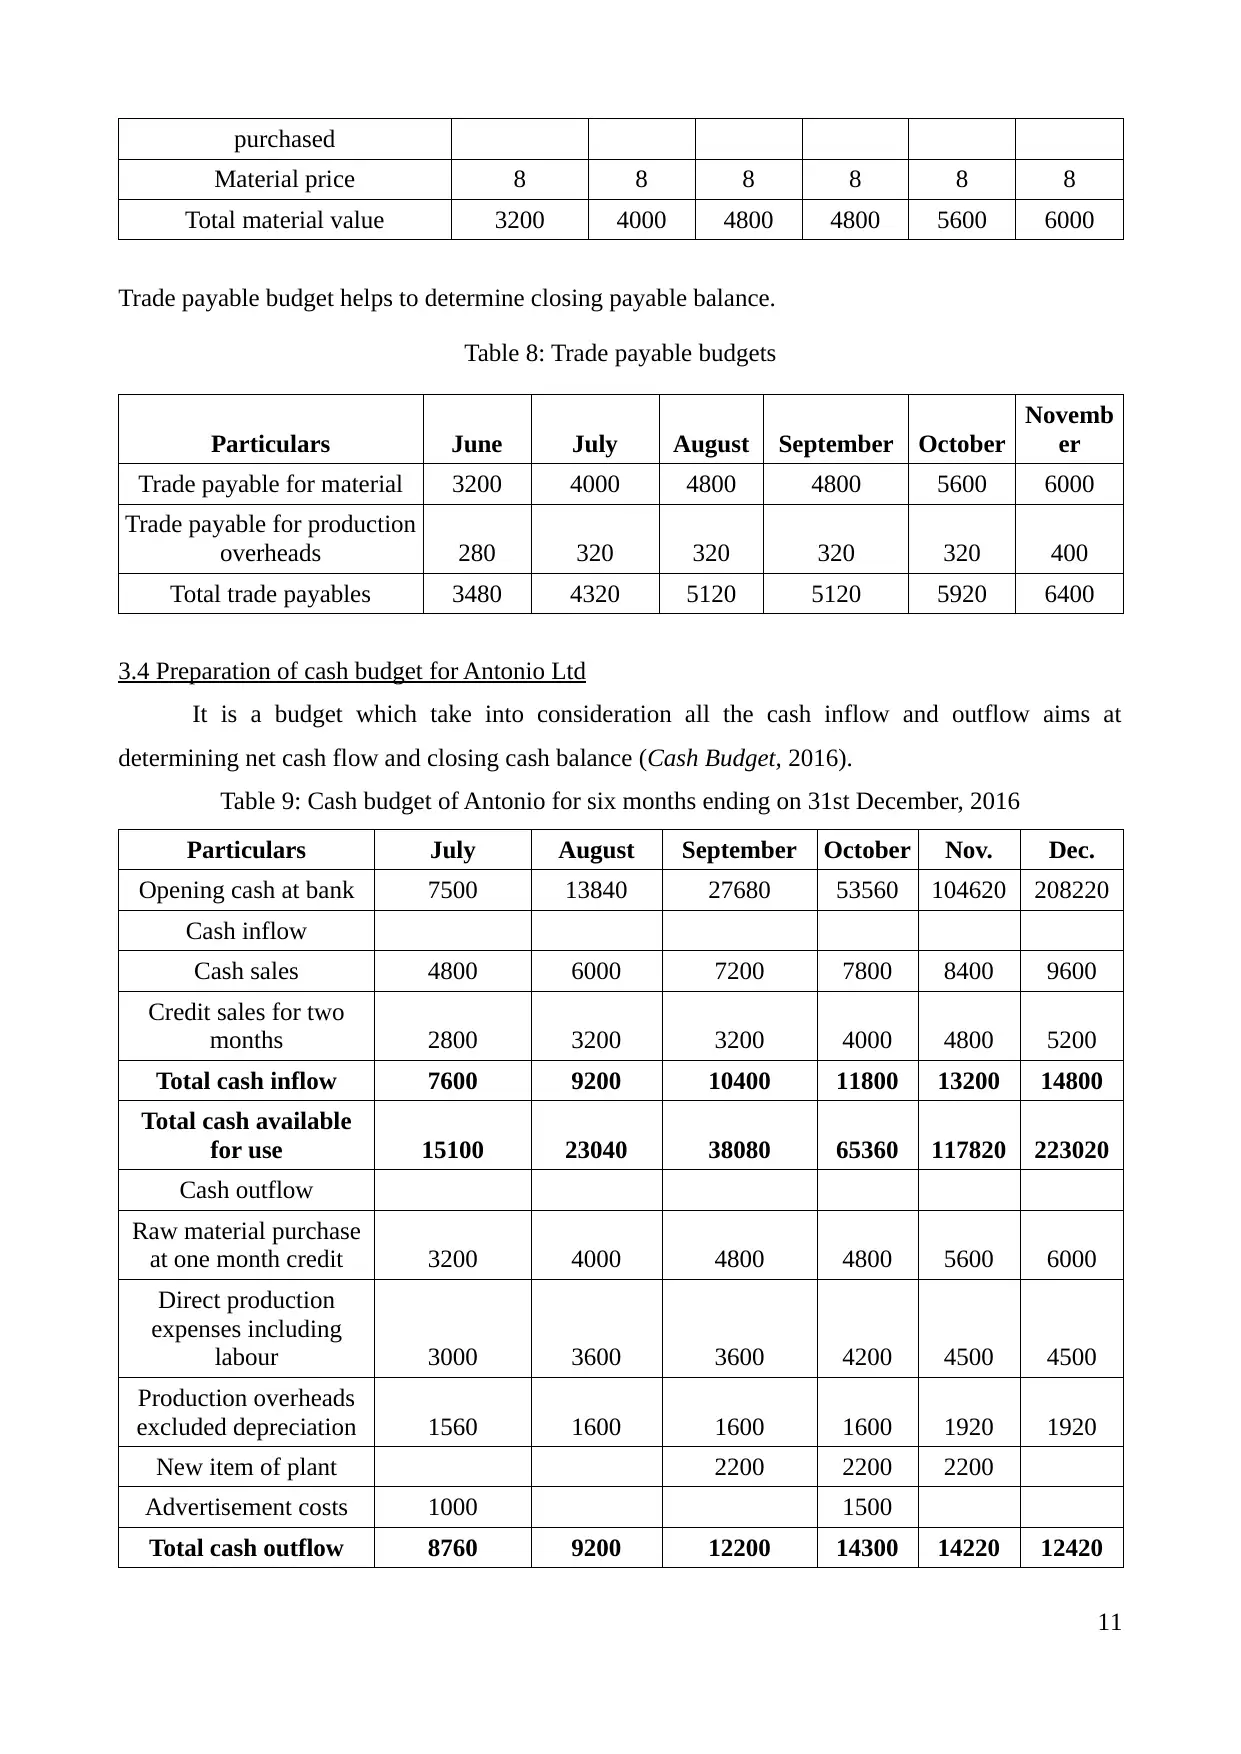
purchased
Material price 8 8 8 8 8 8
Total material value 3200 4000 4800 4800 5600 6000
Trade payable budget helps to determine closing payable balance.
Table 8: Trade payable budgets
Particulars June July August September October
Novemb
er
Trade payable for material 3200 4000 4800 4800 5600 6000
Trade payable for production
overheads 280 320 320 320 320 400
Total trade payables 3480 4320 5120 5120 5920 6400
3.4 Preparation of cash budget for Antonio Ltd
It is a budget which take into consideration all the cash inflow and outflow aims at
determining net cash flow and closing cash balance (Cash Budget, 2016).
Table 9: Cash budget of Antonio for six months ending on 31st December, 2016
Particulars July August September October Nov. Dec.
Opening cash at bank 7500 13840 27680 53560 104620 208220
Cash inflow
Cash sales 4800 6000 7200 7800 8400 9600
Credit sales for two
months 2800 3200 3200 4000 4800 5200
Total cash inflow 7600 9200 10400 11800 13200 14800
Total cash available
for use 15100 23040 38080 65360 117820 223020
Cash outflow
Raw material purchase
at one month credit 3200 4000 4800 4800 5600 6000
Direct production
expenses including
labour 3000 3600 3600 4200 4500 4500
Production overheads
excluded depreciation 1560 1600 1600 1600 1920 1920
New item of plant 2200 2200 2200
Advertisement costs 1000 1500
Total cash outflow 8760 9200 12200 14300 14220 12420
11
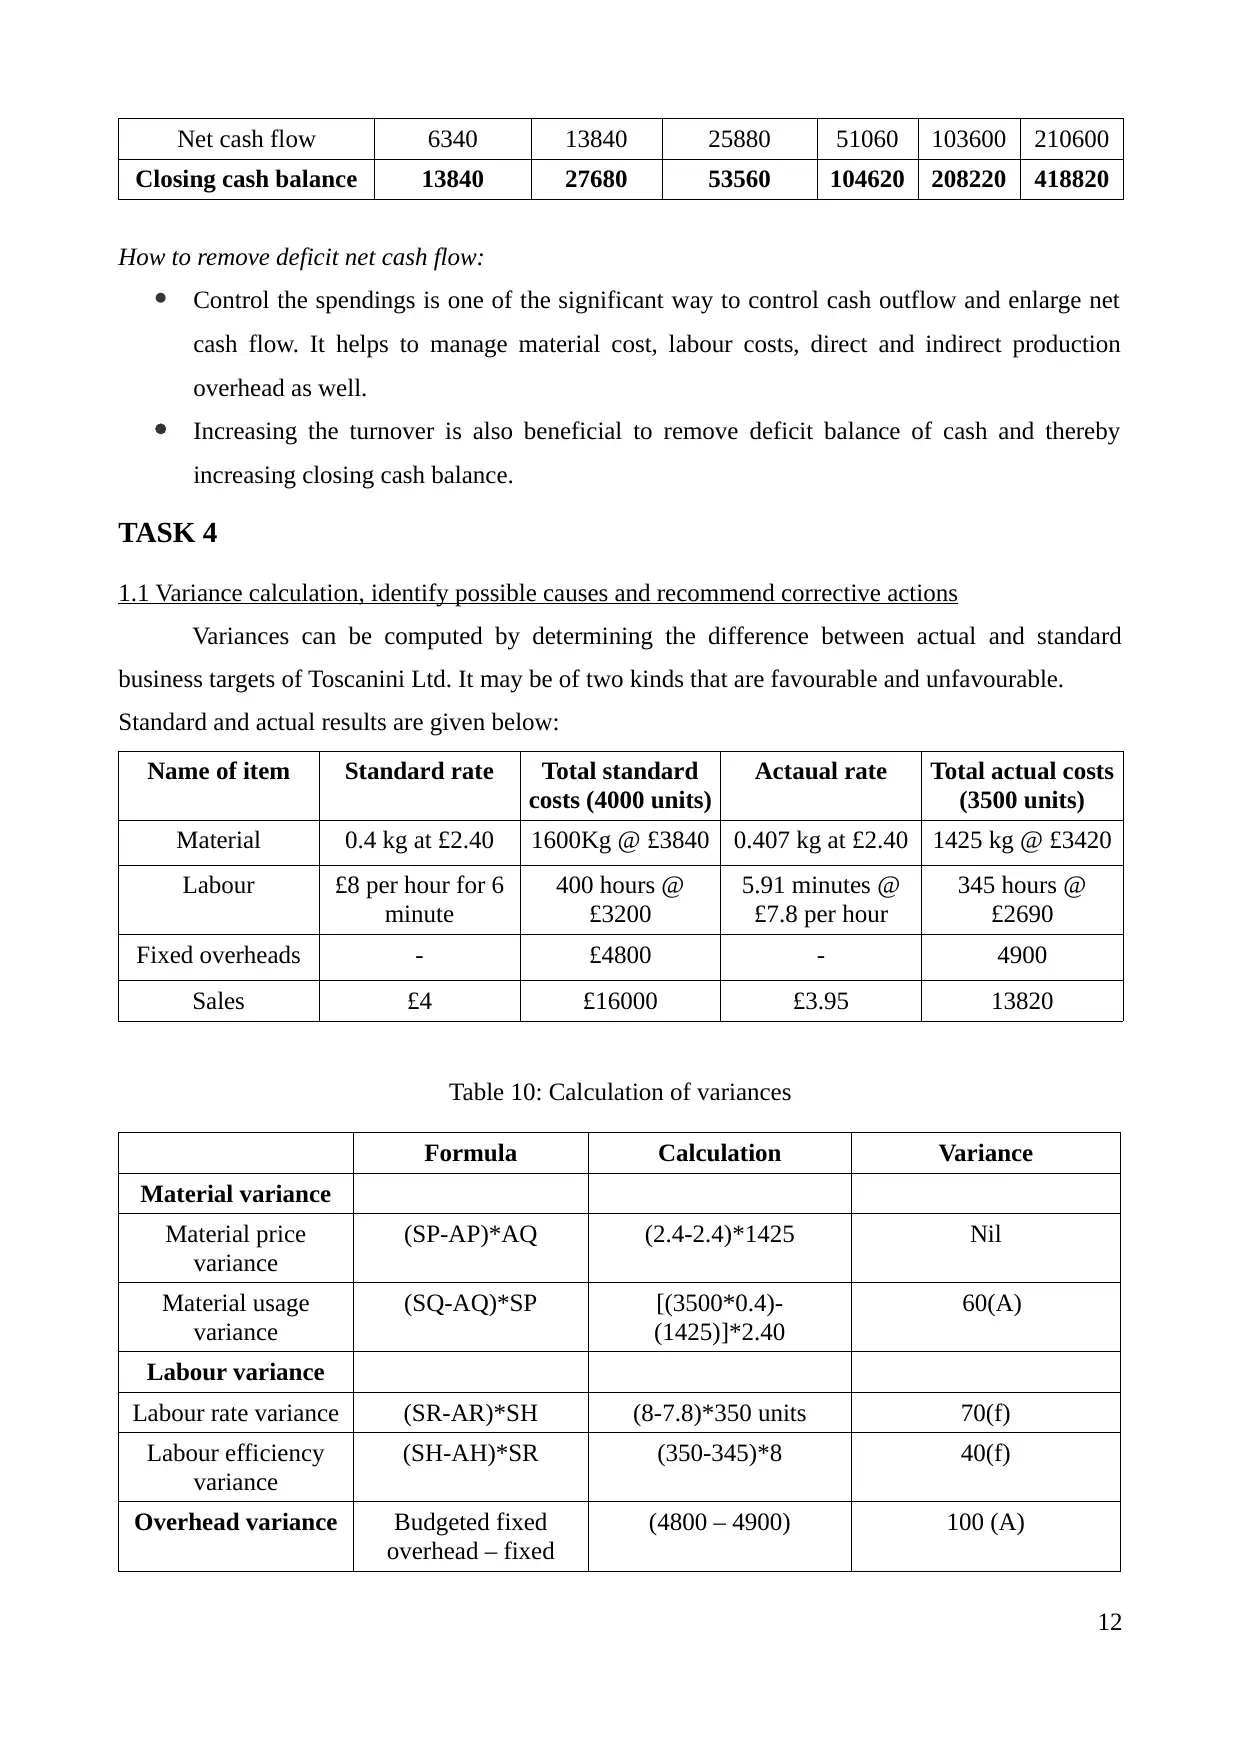
Net cash flow 6340 13840 25880 51060 103600 210600
Closing cash balance 13840 27680 53560 104620 208220 418820
How to remove deficit net cash flow:
Control the spendings is one of the significant way to control cash outflow and enlarge net
cash flow. It helps to manage material cost, labour costs, direct and indirect production
overhead as well.
Increasing the turnover is also beneficial to remove deficit balance of cash and thereby
increasing closing cash balance.
TASK 4
1.1 Variance calculation, identify possible causes and recommend corrective actions
Variances can be computed by determining the difference between actual and standard
business targets of Toscanini Ltd. It may be of two kinds that are favourable and unfavourable.
Standard and actual results are given below:
Name of item Standard rate Total standard
costs (4000 units)
Actaual rate Total actual costs
(3500 units)
Material 0.4 kg at £2.40 1600Kg @ £3840 0.407 kg at £2.40 1425 kg @ £3420
Labour £8 per hour for 6
minute
400 hours @
£3200
5.91 minutes @
£7.8 per hour
345 hours @
£2690
Fixed overheads - £4800 - 4900
Sales £4 £16000 £3.95 13820
Table 10: Calculation of variances
Formula Calculation Variance
Material variance
Material price
variance
(SP-AP)*AQ (2.4-2.4)*1425 Nil
Material usage
variance
(SQ-AQ)*SP [(3500*0.4)-
(1425)]*2.40
60(A)
Labour variance
Labour rate variance (SR-AR)*SH (8-7.8)*350 units 70(f)
Labour efficiency
variance
(SH-AH)*SR (350-345)*8 40(f)
Overhead variance Budgeted fixed
overhead – fixed
(4800 – 4900) 100 (A)
12
⊘ This is a preview!⊘
Do you want full access?
Subscribe today to unlock all pages.
Trusted by 1+ million students worldwide
1 out of 16
Related Documents


Your All-in-One AI-Powered Toolkit for Academic Success.
+13062052269
info@desklib.com
Available 24*7 on WhatsApp / Email
![[object Object]](/_next/static/media/star-bottom.7253800d.svg)
Unlock your academic potential
Copyright © 2020–2026 A2Z Services. All Rights Reserved. Developed and managed by ZUCOL.