Finance Resource Decisions Report: Sainsbury's Analysis
VerifiedAdded on 2020/02/05
|14
|4385
|113
Report
AI Summary
This report delves into the crucial aspects of managing finance resource decisions within a business context, specifically using Sainsbury's as a case study. It begins by identifying and evaluating various internal and external sources of finance available to a company, assessing their implications in terms of costs and benefits. The report then explores how financial information is used by different decision-makers, such as employees, suppliers, investors, and competitors, to make informed choices. It also analyzes the impact of finance on financial statements, including both the income statement and balance sheet. Furthermore, the report examines the use of budgets for financial planning, calculating unit costs for pricing decisions, and applying investment appraisal techniques like net present value and payback period to evaluate investment proposals. Finally, it provides a comprehensive analysis of the company's financial statements, including an examination of different types of businesses and their financial reporting practices.

Managing Finance Resource
Decisions
Decisions
Paraphrase This Document
Need a fresh take? Get an instant paraphrase of this document with our AI Paraphraser
Table of Contents
Introduction ...............................................................................................................................1
Task 1.........................................................................................................................................1
AC 1.1 Finance sources available to the business.................................................................1
AC 1.2 Implication of different sources................................................................................1
AC 1.3 Appropriate finance source.......................................................................................2
AC 2.1 Cost of different finance sources..............................................................................2
AC 2.2 Importance of financial planning..............................................................................2
AC 2.3 Information needs of different decision makers.......................................................3
AC 2.4 Impact of finance on the financial statements...........................................................3
Task 2.........................................................................................................................................3
AC 3.1 Analysis of budgets and take decisions.....................................................................3
AC 3.2 Calculation of unit cost and make pricing decisions.................................................4
AC 3.3 Investment appraisal techniques...............................................................................6
Task 3.........................................................................................................................................8
AC 4.1 Financial statements of the company........................................................................8
AC 4.2 Financial statements of different type of businesses.................................................8
AC 4.3 Analysis of financial statements...............................................................................9
Conclusion................................................................................................................................11
Reference..................................................................................................................................12
INTRODUCTION
Every organization has set objectives or targets that the organization needs to achieve.
The success of the business is very much dependent on the availability of finance sources that
the organization requires to run its business. Sainsbury's is the second largest chain of
supermarket in the United Kingdom headquartered in Holborn, London, UK. The company
was established in the year 1869. It operates at international place as it operates in different
countries over the world. The report aims at identifying a range of finance sources for the
company, their implication in terms of cost and benefits. Moreover, the report will explain
that how financial information is used by various decision makers to take important
decisions. Further, Investment appraisal techniques are also identified to evaluate the
alternatives and select the best investment proposal.
TASK 1
AC 1.1 Finance sources available to the business
Sainsbury can fulfil its finance need through distinct type of finance sources that are
described as follows;
Internal sources: These types of sources are available within the organization itself.
The internal sources include retained earnings, other business profits, disposing off the scrap
assets or cash squeezing operations. Retained earnings are the remaining profit balances that
are not distributed among the shareholders. Further, Sainsbury's operates at larger place
hence; it can also use the profits of other businesses. On contrary, through selling the
unusable assets or making delayed payments to the creditors company can avail larger the
cash balances.
External sources: These sources are available outside from the organization includes
bank loans, share capital and overdraft facilities. Sainsbury can take loans from banks for
different time duration. Further, banks also provide overdraft facilities to the company in
order to mitigate the urgent requirement. Moreover, the company can issue shares in the
market to the public to generate the required funds. Another important source is debentures
Sainsbury can issue the debenture to the holders to fulfil the financial needs (Minnis, 2011).
Moreover, venture capital can be provided to the investors for enhancing the funds.
AC 1.2 Implication of different sources
All the finance sources applied different implication to the business. On the share
capital business require to pay return to the shareholders. In case of bank loan and overdraft
businesses require to pay interest charges along with the principal payment. On contrary, in
1 | P a g e
⊘ This is a preview!⊘
Do you want full access?
Subscribe today to unlock all pages.
Trusted by 1+ million students worldwide
case of share capital they have controlling rights as they can manage the operations of the
businesses (Schroeder, Clark and Cathey, 2011). However, banks have not such kind of rights
they can only sell the provided security against the given loan. Furthermore, on the issued
debentures company require to pay fixed rate of interest to the debentures.
AC 1.3 Appropriate finance source
Appropriate finance sources can be select on the basis of their implication. For
fulfilling the urgent or immediate requirement the overdraft and retained earnings will be
appropriate sources. However, for fulfilling the medium term requirement bank loans can be
taken by the company (Managing Financial Resources and Decisions, n.d.). Further, long
term finance requirement can be filled through issuing share capital as the equity
shareholders return are not fixed. Therefore, it does not impose any fixed burden to the
company. Moreover, venture capital also can be provided to the investors for this purpose.
AC 2.1 Cost of different finance sources
The cost of distinct finance sources tends to vary from each other. For instance, on the
issued amount of share capital, the company require to pay dividend to their shareholders.
Further, before adopting any new policy shareholders must be communicate as they are the
owners and having voting rights that give them right to manage the business operations.
However, the cost of bank loans, debentures and overdraft facilities involve interest charges.
The interest rate on bank loans may be of two kinds fixed or fluctuating (Malmi and
Granlund, 2009). However, under the debentures company need to pay a fixed rate of interest
to the holders. Moreover, retained earning does not include any financial burden to the
company. However, it includes opportunities cost as the company can use this retained
earnings in the other sources. For instance, it can invest the profits in other company that
having higher the profits. Further, the cost of cash squeezing operation is that business can
not avail cash discount in case of delayed payments.
AC 2.2 Importance of financial planning
Financial planning helps to manage the business finance sources in an efficient
manner. Moreover, it helps to take better investment and working capital decisions. It
determines the organization fund requirement and determines optimum capital structure. It
helps to attain debt and equity in an appropriate ratio at minimum cost that helps to yield
maximum return. Further, it manages the working capital through administrating the cash
inflows and outflows (Ismail and Mohsin, 2013). Through financial planning business is able
to control income efficiently. Effective financial planning helps to make easier the financial
2 | P a g e
Paraphrase This Document
Need a fresh take? Get an instant paraphrase of this document with our AI Paraphraser
decisions in order to achieve the business goals. Moreover, it minimizes the risk factor and
negative impact of market uncertainties to the business. Thus, it can be said that financial
planning is a very important tool for the business.
AC 2.3 Information needs of different decision makers
There are number of decision makers that require financial information regarding the
company's operation to take decisions. Employees require information regarding company's
profits and the growth. It is because all their interest in company is related to the business
success. They are very much interested to get increased salary, better working environment,
working culture and other non monetary benefits. Higher the business performance satisfies
the employees’ needs to a great extent. Supplier analyse the company's creditworthiness to
pay the liabilities on right time. Thus, they wanted to know the business financial
performance. Improved financial performance of the business can avail favourable supplier
terms. Investor invests their money so as to attain greater return. Therefore, they wanted to
know the business return and analyse the risk return factor of alternative businesses in order
to make correct investment decisions (Georgiou, 2010). Further, Government require that all
the business make payment of their taxes on regular basis. It identifies the business
profitability and determines the taxes that business organization is paying tax or not.
Competitor requires information to know their competitors position in the market and
determine their policies and strategies for the purpose of compete effectively.
AC 2.4 Impact of finance on the financial statements
All the finance sources show in the business financial statements of the company.
Financial statements include both income statements and balance sheet. The process in which
business entity records the business transaction is known as financial statements. The amount
of issued share capital shows in both the assets and liability side. However, the dividend
shows in the income statements of the company. Further, the interest payment shows in the
income statement as finance cost. However, the amount of loan shows in the both assets and
liability side. Further, the amount of retained earning that is used by the company for fulfil
the finance requirement shows in the retained earnings statements.
TASK 2
AC 3.1 Analysis of budgets and take decisions
Budgets are prepared through forecasting the future expenditures and incomes for a
specified period. It helps to increase the revenue and reduce the expenditures that help to
3 | P a g e
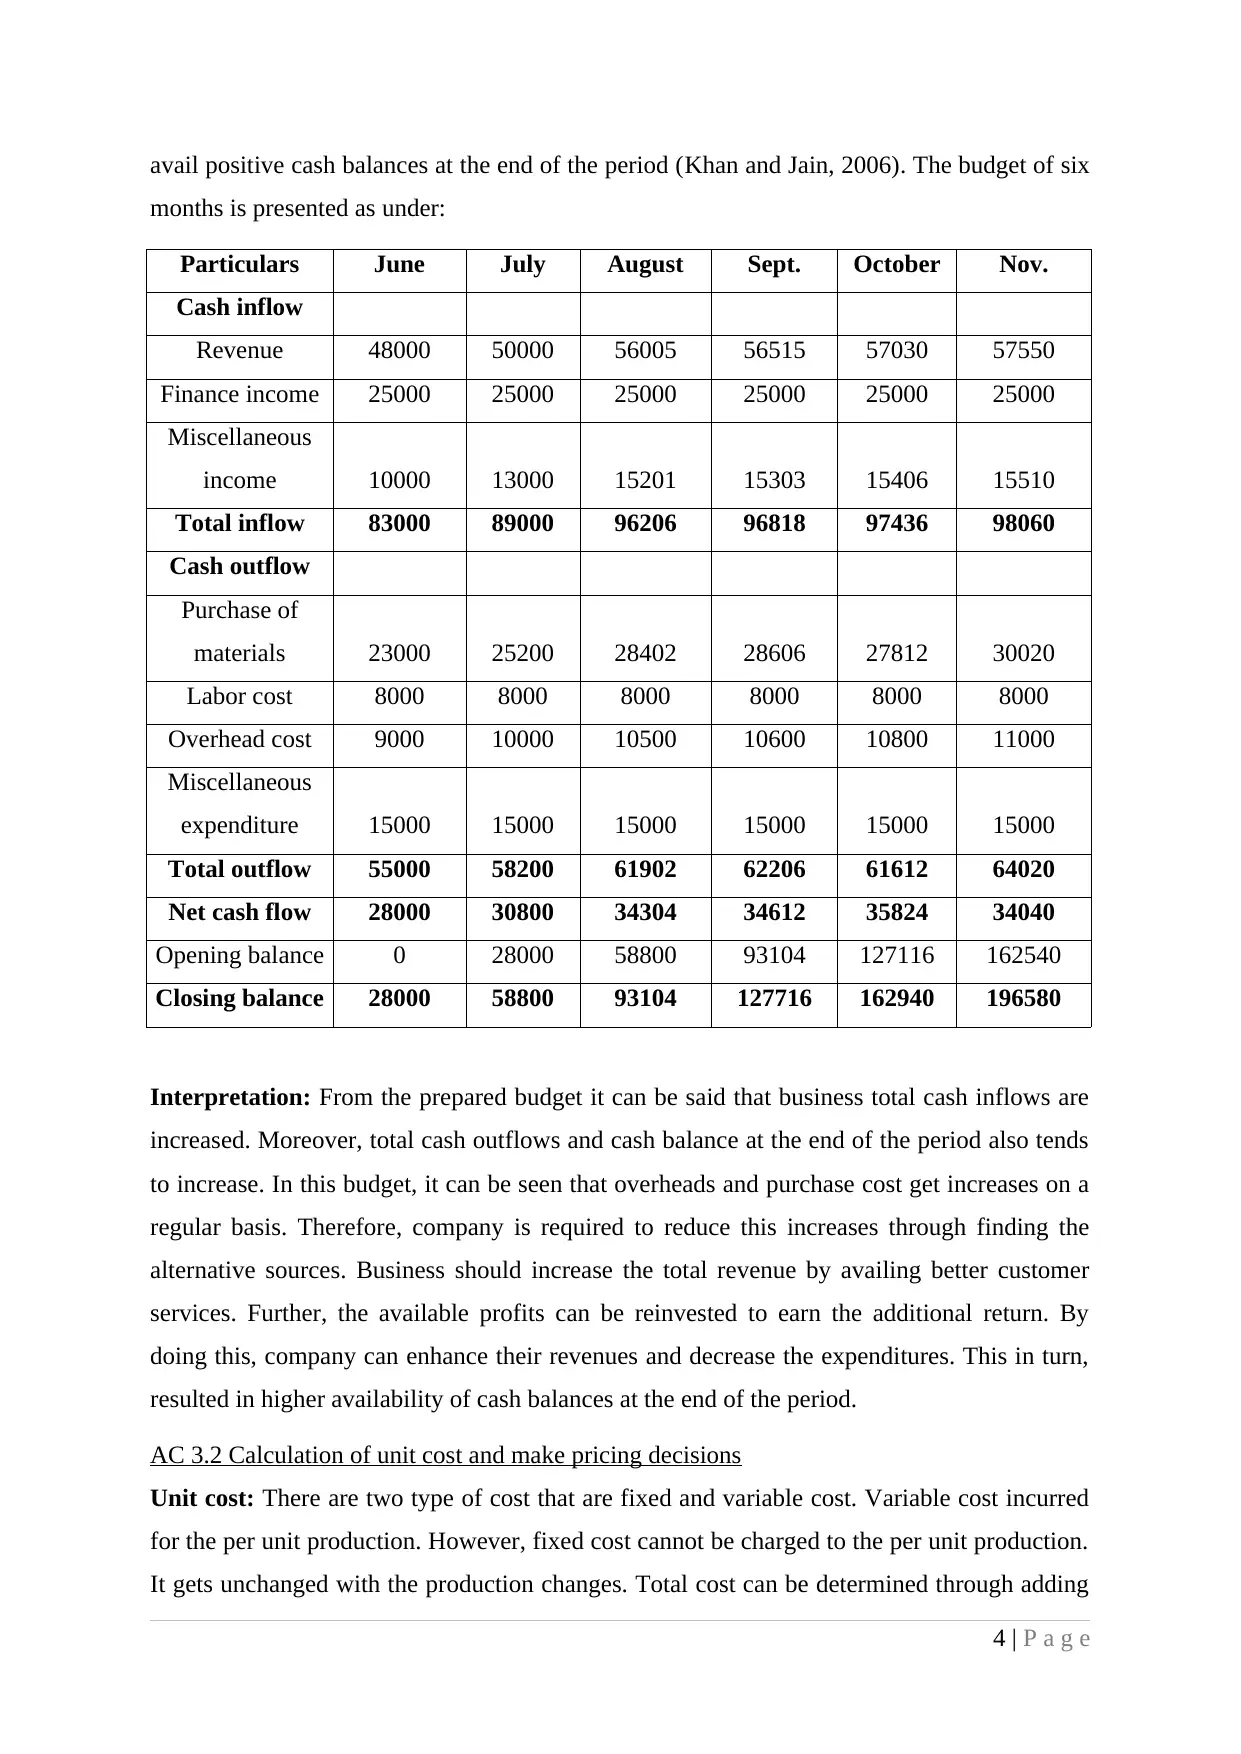
avail positive cash balances at the end of the period (Khan and Jain, 2006). The budget of six
months is presented as under:
Particulars June July August Sept. October Nov.
Cash inflow
Revenue 48000 50000 56005 56515 57030 57550
Finance income 25000 25000 25000 25000 25000 25000
Miscellaneous
income 10000 13000 15201 15303 15406 15510
Total inflow 83000 89000 96206 96818 97436 98060
Cash outflow
Purchase of
materials 23000 25200 28402 28606 27812 30020
Labor cost 8000 8000 8000 8000 8000 8000
Overhead cost 9000 10000 10500 10600 10800 11000
Miscellaneous
expenditure 15000 15000 15000 15000 15000 15000
Total outflow 55000 58200 61902 62206 61612 64020
Net cash flow 28000 30800 34304 34612 35824 34040
Opening balance 0 28000 58800 93104 127116 162540
Closing balance 28000 58800 93104 127716 162940 196580
Interpretation: From the prepared budget it can be said that business total cash inflows are
increased. Moreover, total cash outflows and cash balance at the end of the period also tends
to increase. In this budget, it can be seen that overheads and purchase cost get increases on a
regular basis. Therefore, company is required to reduce this increases through finding the
alternative sources. Business should increase the total revenue by availing better customer
services. Further, the available profits can be reinvested to earn the additional return. By
doing this, company can enhance their revenues and decrease the expenditures. This in turn,
resulted in higher availability of cash balances at the end of the period.
AC 3.2 Calculation of unit cost and make pricing decisions
Unit cost: There are two type of cost that are fixed and variable cost. Variable cost incurred
for the per unit production. However, fixed cost cannot be charged to the per unit production.
It gets unchanged with the production changes. Total cost can be determined through adding
4 | P a g e
⊘ This is a preview!⊘
Do you want full access?
Subscribe today to unlock all pages.
Trusted by 1+ million students worldwide
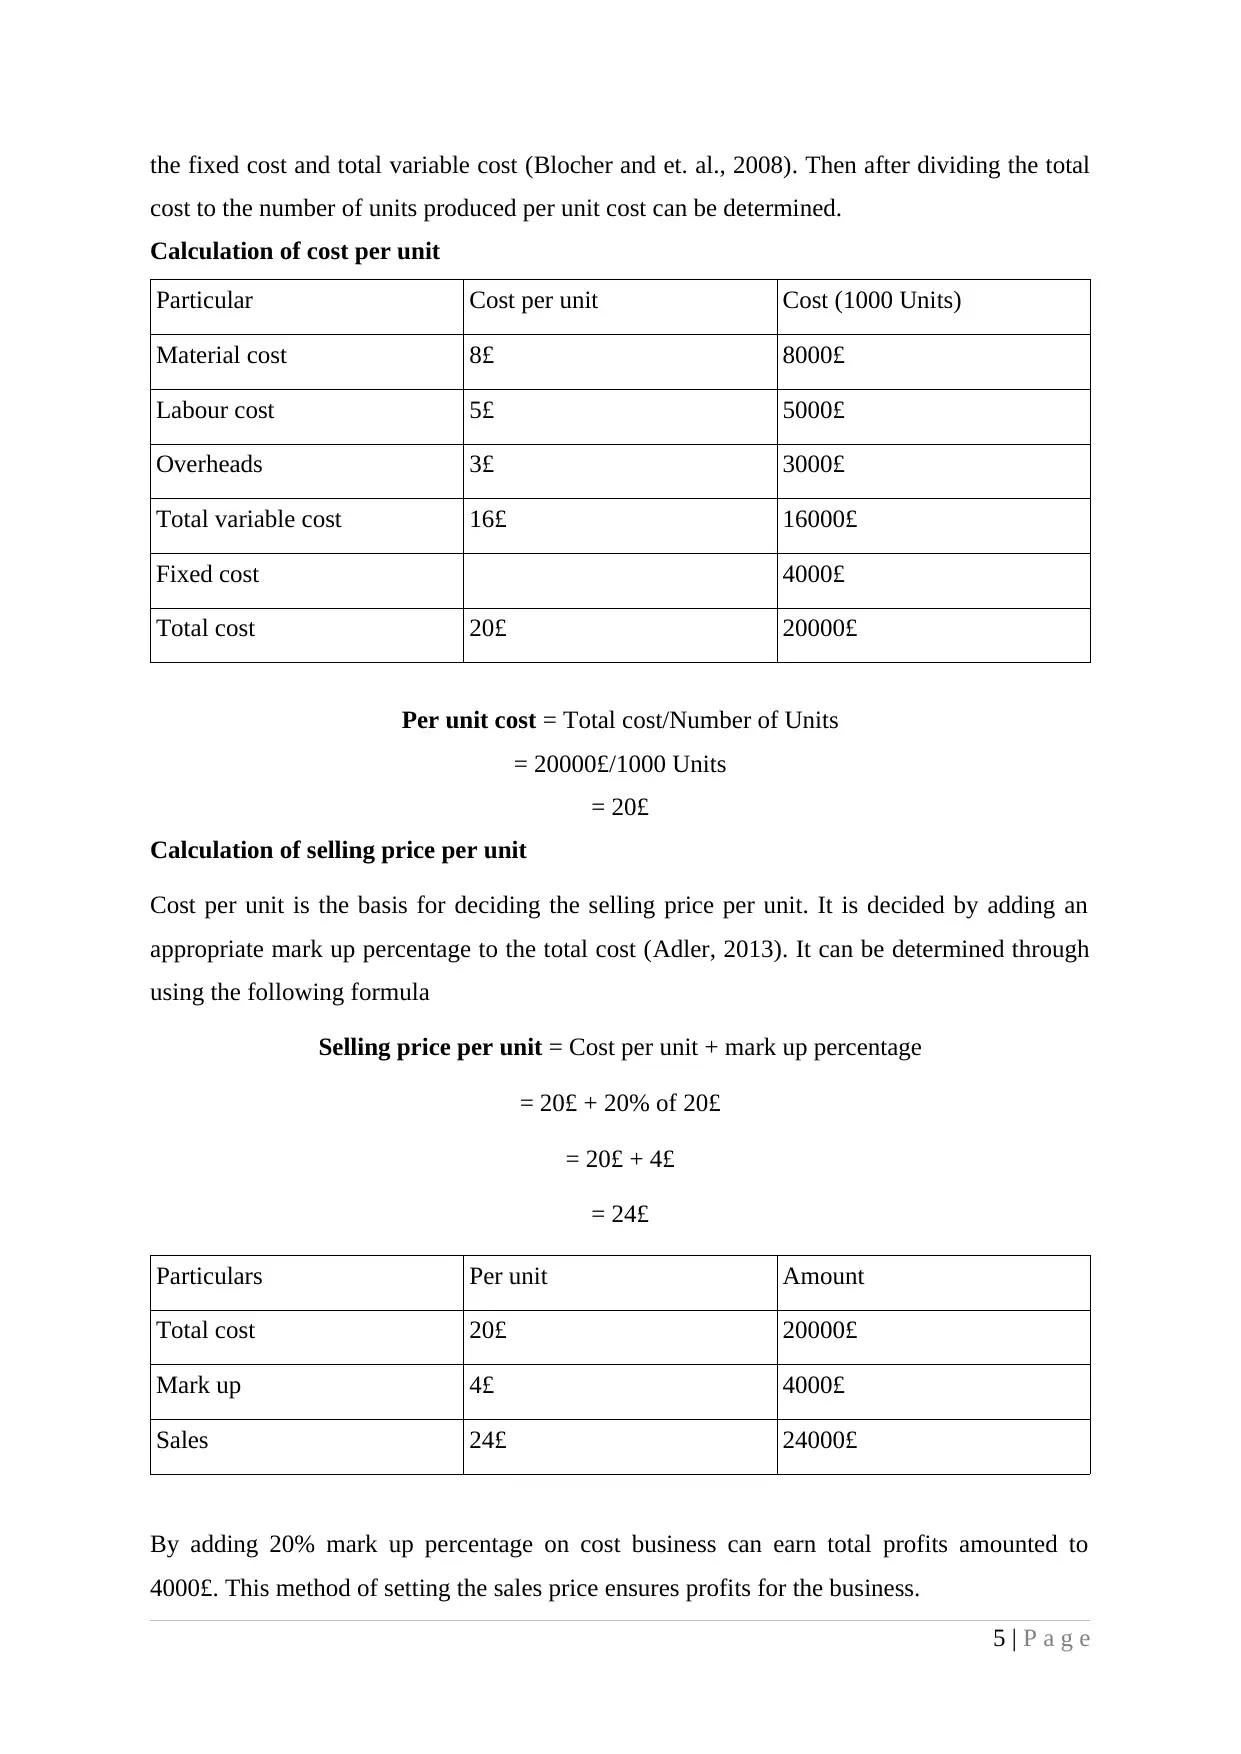
the fixed cost and total variable cost (Blocher and et. al., 2008). Then after dividing the total
cost to the number of units produced per unit cost can be determined.
Calculation of cost per unit
Particular Cost per unit Cost (1000 Units)
Material cost 8£ 8000£
Labour cost 5£ 5000£
Overheads 3£ 3000£
Total variable cost 16£ 16000£
Fixed cost 4000£
Total cost 20£ 20000£
Per unit cost = Total cost/Number of Units
= 20000£/1000 Units
= 20£
Calculation of selling price per unit
Cost per unit is the basis for deciding the selling price per unit. It is decided by adding an
appropriate mark up percentage to the total cost (Adler, 2013). It can be determined through
using the following formula
Selling price per unit = Cost per unit + mark up percentage
= 20£ + 20% of 20£
= 20£ + 4£
= 24£
Particulars Per unit Amount
Total cost 20£ 20000£
Mark up 4£ 4000£
Sales 24£ 24000£
By adding 20% mark up percentage on cost business can earn total profits amounted to
4000£. This method of setting the sales price ensures profits for the business.
5 | P a g e
Paraphrase This Document
Need a fresh take? Get an instant paraphrase of this document with our AI Paraphraser
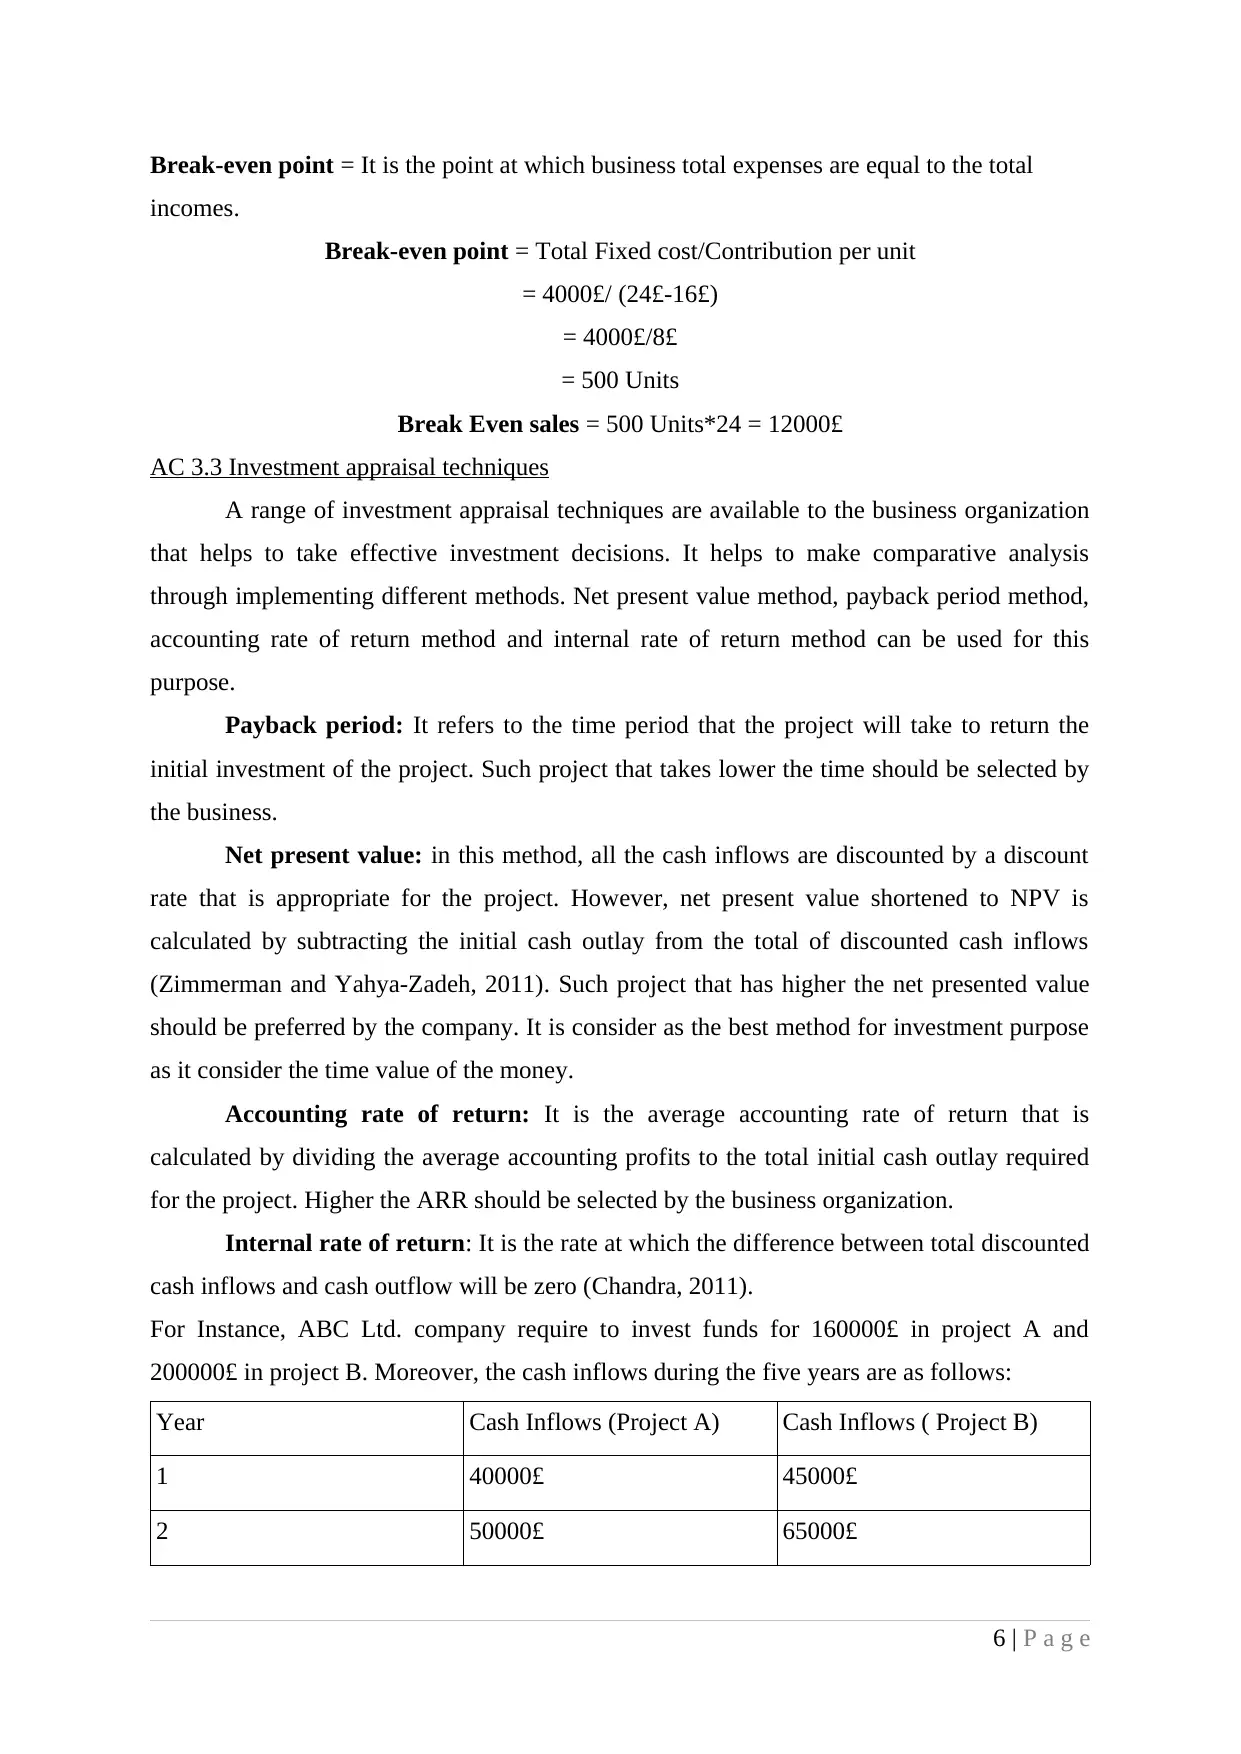
Break-even point = It is the point at which business total expenses are equal to the total
incomes.
Break-even point = Total Fixed cost/Contribution per unit
= 4000£/ (24£-16£)
= 4000£/8£
= 500 Units
Break Even sales = 500 Units*24 = 12000£
AC 3.3 Investment appraisal techniques
A range of investment appraisal techniques are available to the business organization
that helps to take effective investment decisions. It helps to make comparative analysis
through implementing different methods. Net present value method, payback period method,
accounting rate of return method and internal rate of return method can be used for this
purpose.
Payback period: It refers to the time period that the project will take to return the
initial investment of the project. Such project that takes lower the time should be selected by
the business.
Net present value: in this method, all the cash inflows are discounted by a discount
rate that is appropriate for the project. However, net present value shortened to NPV is
calculated by subtracting the initial cash outlay from the total of discounted cash inflows
(Zimmerman and Yahya-Zadeh, 2011). Such project that has higher the net presented value
should be preferred by the company. It is consider as the best method for investment purpose
as it consider the time value of the money.
Accounting rate of return: It is the average accounting rate of return that is
calculated by dividing the average accounting profits to the total initial cash outlay required
for the project. Higher the ARR should be selected by the business organization.
Internal rate of return: It is the rate at which the difference between total discounted
cash inflows and cash outflow will be zero (Chandra, 2011).
For Instance, ABC Ltd. company require to invest funds for 160000£ in project A and
200000£ in project B. Moreover, the cash inflows during the five years are as follows:
Year Cash Inflows (Project A) Cash Inflows ( Project B)
1 40000£ 45000£
2 50000£ 65000£
6 | P a g e
3 58000£ 78000£
4 79000£ 80000£
Calculation of payback period method and accounting rate of return
Year Cash Flows Cumulative Cash flows Cumulative
0 -160000 -160000 -200000 -200000
1 40000 -120000 45000 -155000
2 50000 -70000 65000 -90000
3 58000 -12000 78000 -12000
4 79000 67000 80000 68000
Total 67000 68000
Payback period of project A = 3 year + 12000£/79000£ = 3.1519 Year
Payback period of project B = 3 Year + 12000£/80000£ = 3.15 Year
ARR = Average accounting profits/Total investment *100
Project A = 67000£/4 = 16750£
Project B = 68000£/4 = 17000£
ARR = 16750£/160000£*100 = 10.47%
ARR = 17000£/20000£*100 = 8.5%
Calculation of Net present value and IRR
Year Cash Flows
Discounted
factor
Discounted
cash flows Cash flows
Discounted
factor
Discounted
cash flows
0 -160000 1 -160000 -200000 1 -200000
1 40000 0.909 36360 45000 0.909 40905
2 50000 0.826 41300 65000 0.826 53690
3 58000 0.751 43558 78000 0.751 58578
4 79000 0.683 53957 80000 0.683 54640
NPV/IRR 13.86% 15175 11.64% 7813
Comparative Analysis
particular Project A Project B
Payback period 3.15 3.15
7 | P a g e
⊘ This is a preview!⊘
Do you want full access?
Subscribe today to unlock all pages.
Trusted by 1+ million students worldwide
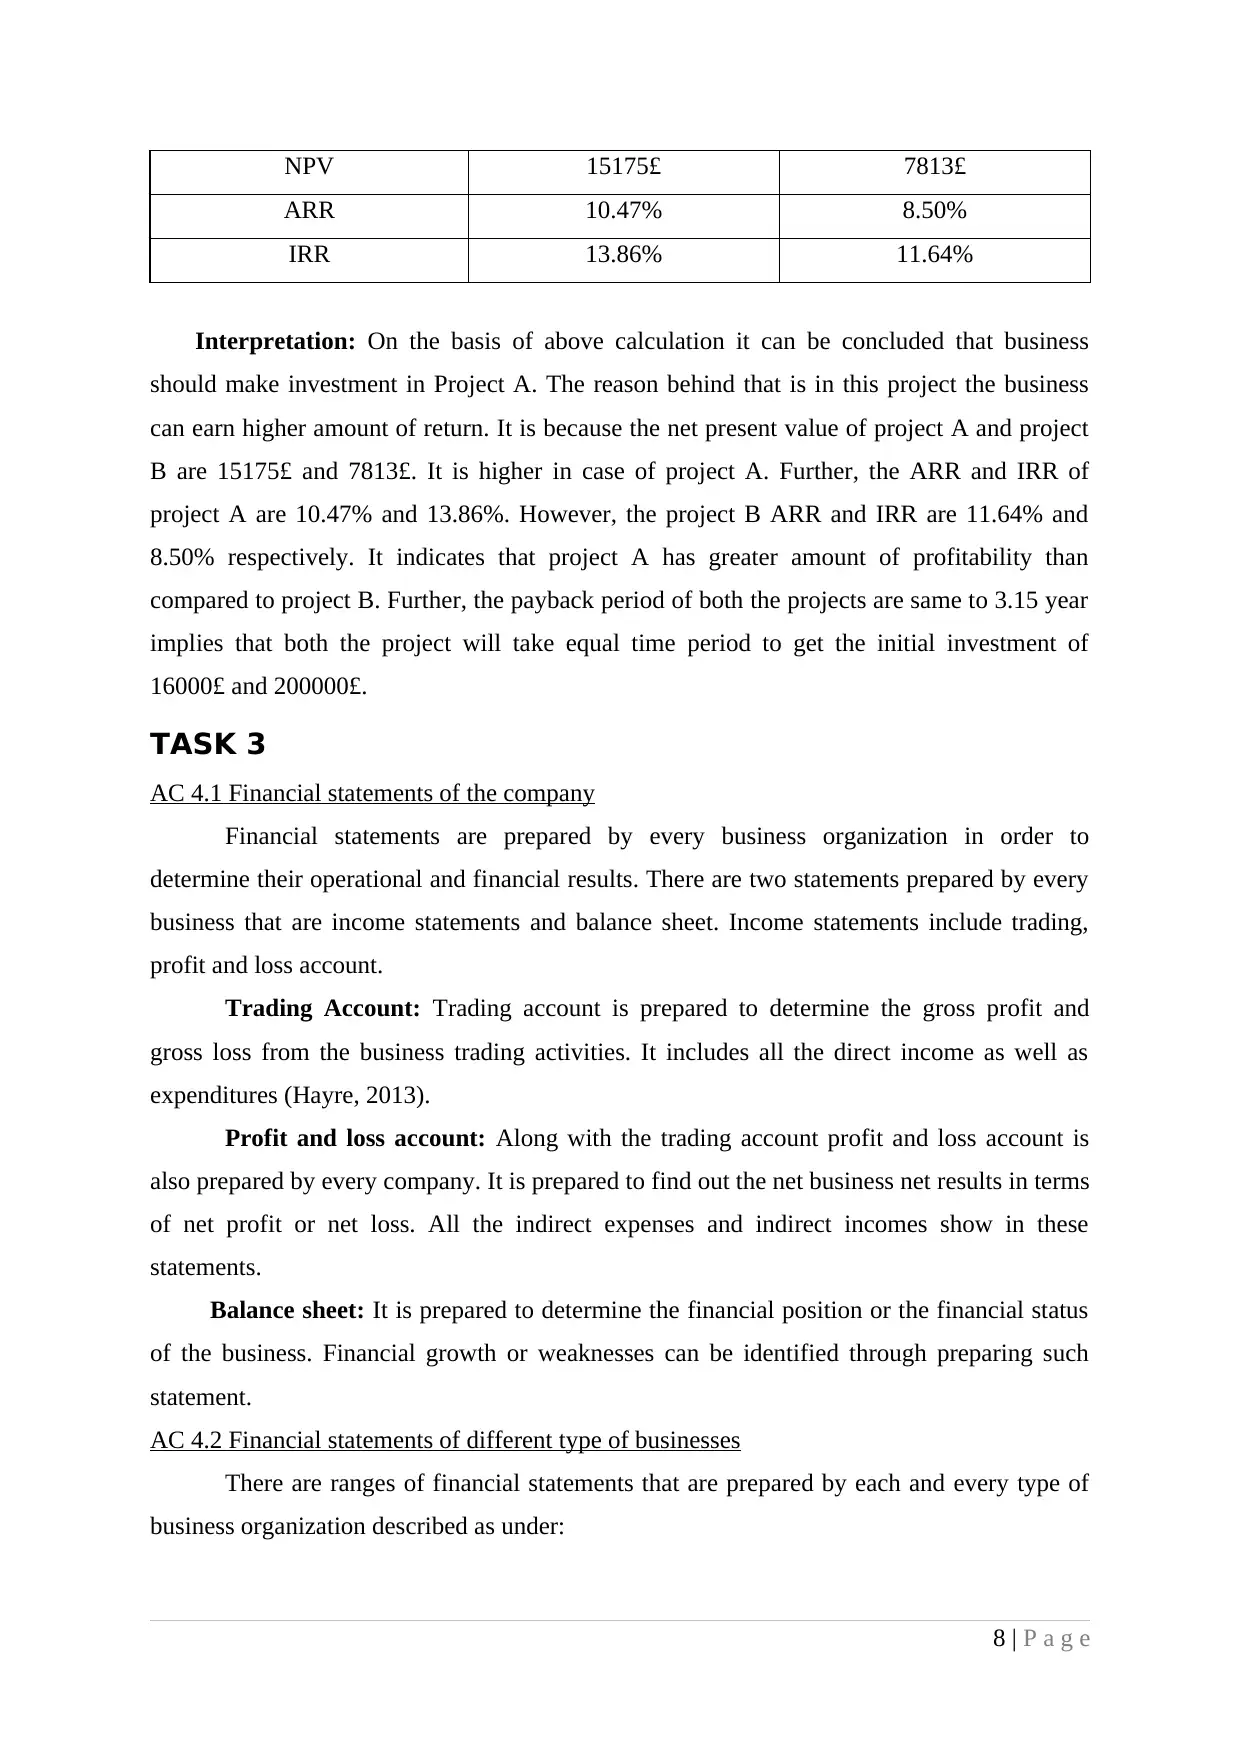
NPV 15175£ 7813£
ARR 10.47% 8.50%
IRR 13.86% 11.64%
Interpretation: On the basis of above calculation it can be concluded that business
should make investment in Project A. The reason behind that is in this project the business
can earn higher amount of return. It is because the net present value of project A and project
B are 15175£ and 7813£. It is higher in case of project A. Further, the ARR and IRR of
project A are 10.47% and 13.86%. However, the project B ARR and IRR are 11.64% and
8.50% respectively. It indicates that project A has greater amount of profitability than
compared to project B. Further, the payback period of both the projects are same to 3.15 year
implies that both the project will take equal time period to get the initial investment of
16000£ and 200000£.
TASK 3
AC 4.1 Financial statements of the company
Financial statements are prepared by every business organization in order to
determine their operational and financial results. There are two statements prepared by every
business that are income statements and balance sheet. Income statements include trading,
profit and loss account.
Trading Account: Trading account is prepared to determine the gross profit and
gross loss from the business trading activities. It includes all the direct income as well as
expenditures (Hayre, 2013).
Profit and loss account: Along with the trading account profit and loss account is
also prepared by every company. It is prepared to find out the net business net results in terms
of net profit or net loss. All the indirect expenses and indirect incomes show in these
statements.
Balance sheet: It is prepared to determine the financial position or the financial status
of the business. Financial growth or weaknesses can be identified through preparing such
statement.
AC 4.2 Financial statements of different type of businesses
There are ranges of financial statements that are prepared by each and every type of
business organization described as under:
8 | P a g e
Paraphrase This Document
Need a fresh take? Get an instant paraphrase of this document with our AI Paraphraser
Sole proprietorship: Under this type of business organization, an individual person
makes investment in the company. Moreover, all the efforts are made by the entrepreneurs
only so all the profits are available for the entrepreneurs. Further, all the losses are born by
the sole trader. It prepares trading and profit and loss account as the income statements
(Goyal and Goyal 2012). Moreover, balance sheet is prepared in order to determine the
financial position of the business. The sample of trading, profit and loss account and balance
sheet of sole trader are given as under:
Partnership: Under the partnership form of business organization, more than two
partners can make agreement to start the business. Therefore, they all make efforts in the
business and share the business profit and losses. Moreover, the liability of all the partners is
unlimited for the business. It prepares its financial statements according to the partnership act
requirement. It prepares profit and loss account as the income statements and also the balance
sheet.
Company: It is a legal body that came into existence by the companies act. Therefore
all the financial statements are prepared as per the act requirements. It prepares profit and loss
account, balance sheet, statements of retained earnings, cash flow statement and fund flow
statements (O' Bryan, 2010). Moreover, parent company that has any subsidiary company
require preparing consolidated financial statements.
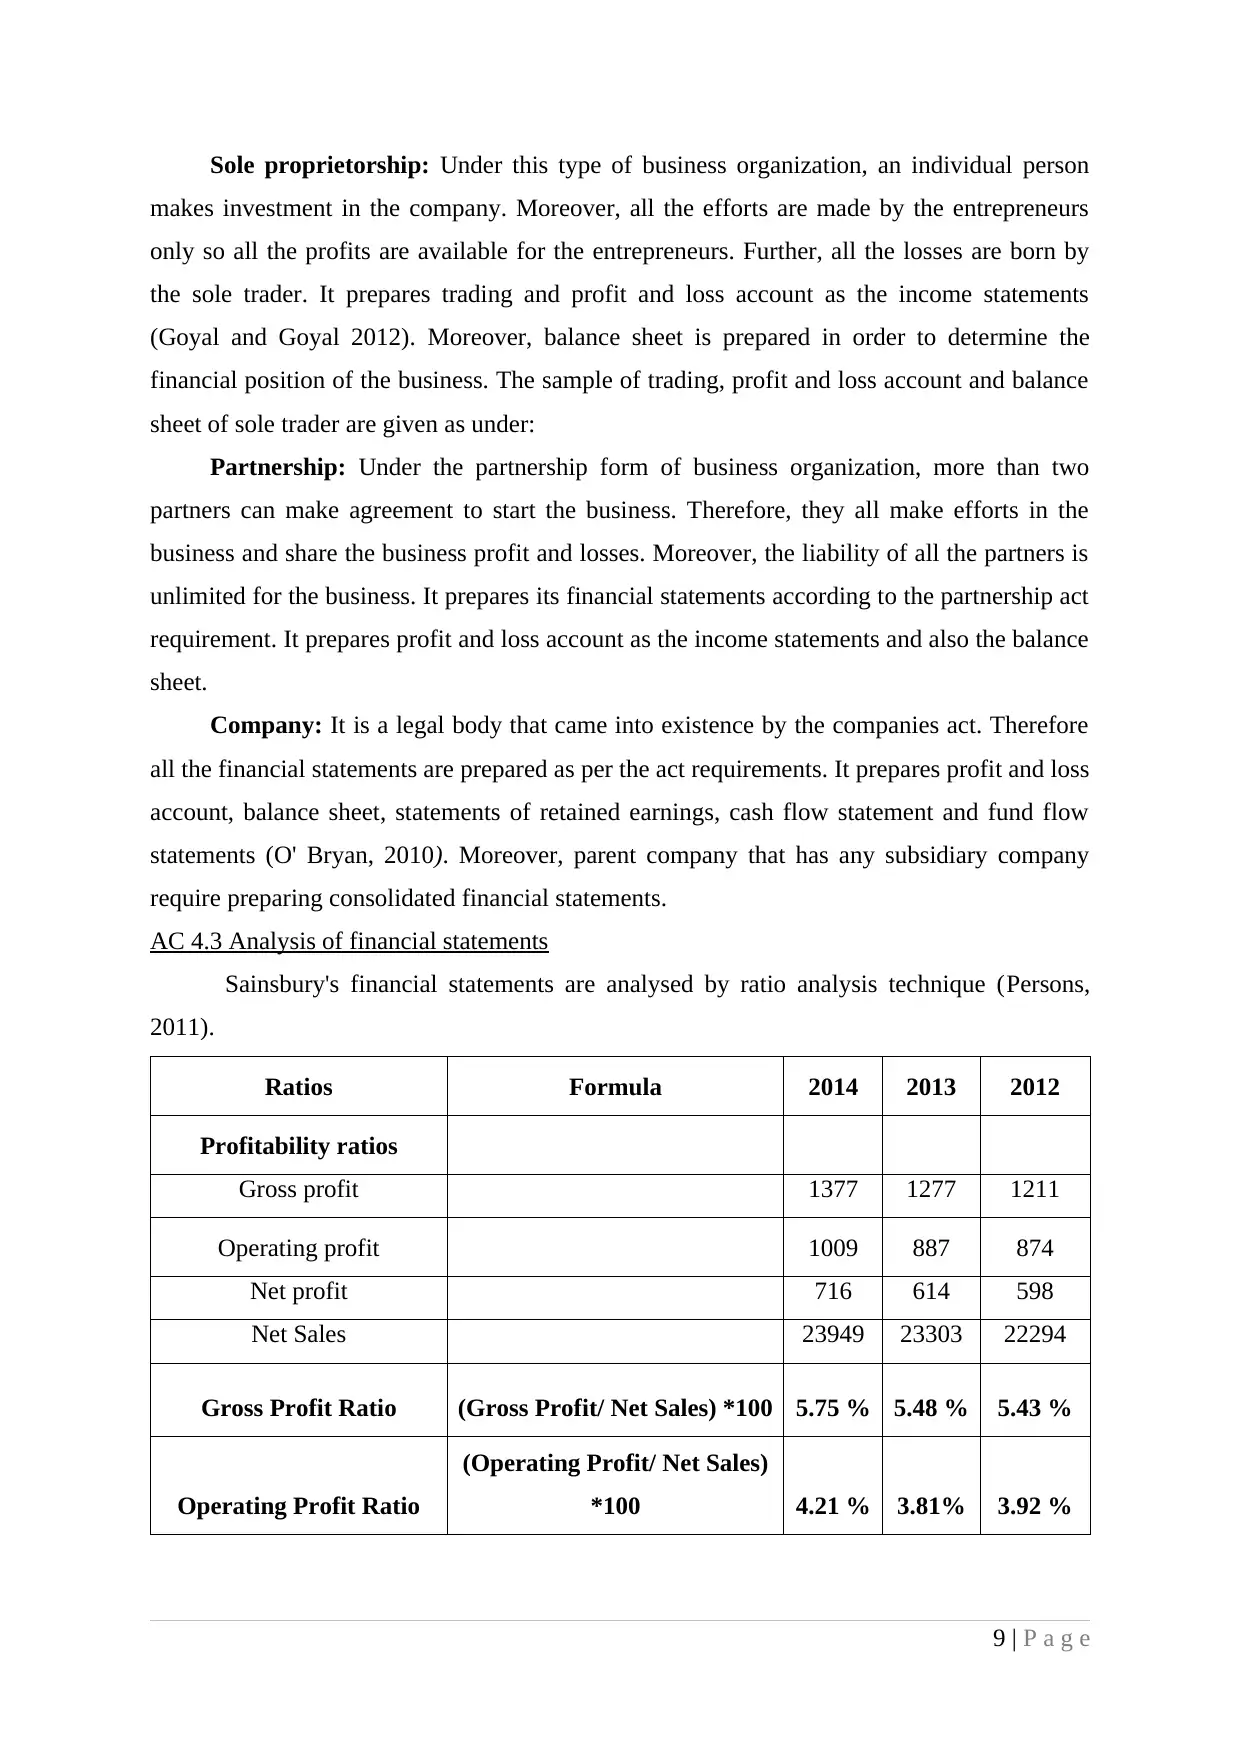
AC 4.3 Analysis of financial statements
Sainsbury's financial statements are analysed by ratio analysis technique (Persons,
2011).
Ratios Formula 2014 2013 2012
Profitability ratios
Gross profit 1377 1277 1211
Operating profit 1009 887 874
Net profit 716 614 598
Net Sales 23949 23303 22294
Gross Profit Ratio (Gross Profit/ Net Sales) *100 5.75 % 5.48 % 5.43 %
Operating Profit Ratio
(Operating Profit/ Net Sales)
*100 4.21 % 3.81% 3.92 %
9 | P a g e
makes investment in the company. Moreover, all the efforts are made by the entrepreneurs
only so all the profits are available for the entrepreneurs. Further, all the losses are born by
the sole trader. It prepares trading and profit and loss account as the income statements
(Goyal and Goyal 2012). Moreover, balance sheet is prepared in order to determine the
financial position of the business. The sample of trading, profit and loss account and balance
sheet of sole trader are given as under:
Partnership: Under the partnership form of business organization, more than two
partners can make agreement to start the business. Therefore, they all make efforts in the
business and share the business profit and losses. Moreover, the liability of all the partners is
unlimited for the business. It prepares its financial statements according to the partnership act
requirement. It prepares profit and loss account as the income statements and also the balance
sheet.
Company: It is a legal body that came into existence by the companies act. Therefore
all the financial statements are prepared as per the act requirements. It prepares profit and loss
account, balance sheet, statements of retained earnings, cash flow statement and fund flow
statements (O' Bryan, 2010). Moreover, parent company that has any subsidiary company
require preparing consolidated financial statements.
AC 4.3 Analysis of financial statements
Sainsbury's financial statements are analysed by ratio analysis technique (Persons,
2011).
Ratios Formula 2014 2013 2012
Profitability ratios
Gross profit 1377 1277 1211
Operating profit 1009 887 874
Net profit 716 614 598
Net Sales 23949 23303 22294
Gross Profit Ratio (Gross Profit/ Net Sales) *100 5.75 % 5.48 % 5.43 %
Operating Profit Ratio
(Operating Profit/ Net Sales)
*100 4.21 % 3.81% 3.92 %
9 | P a g e
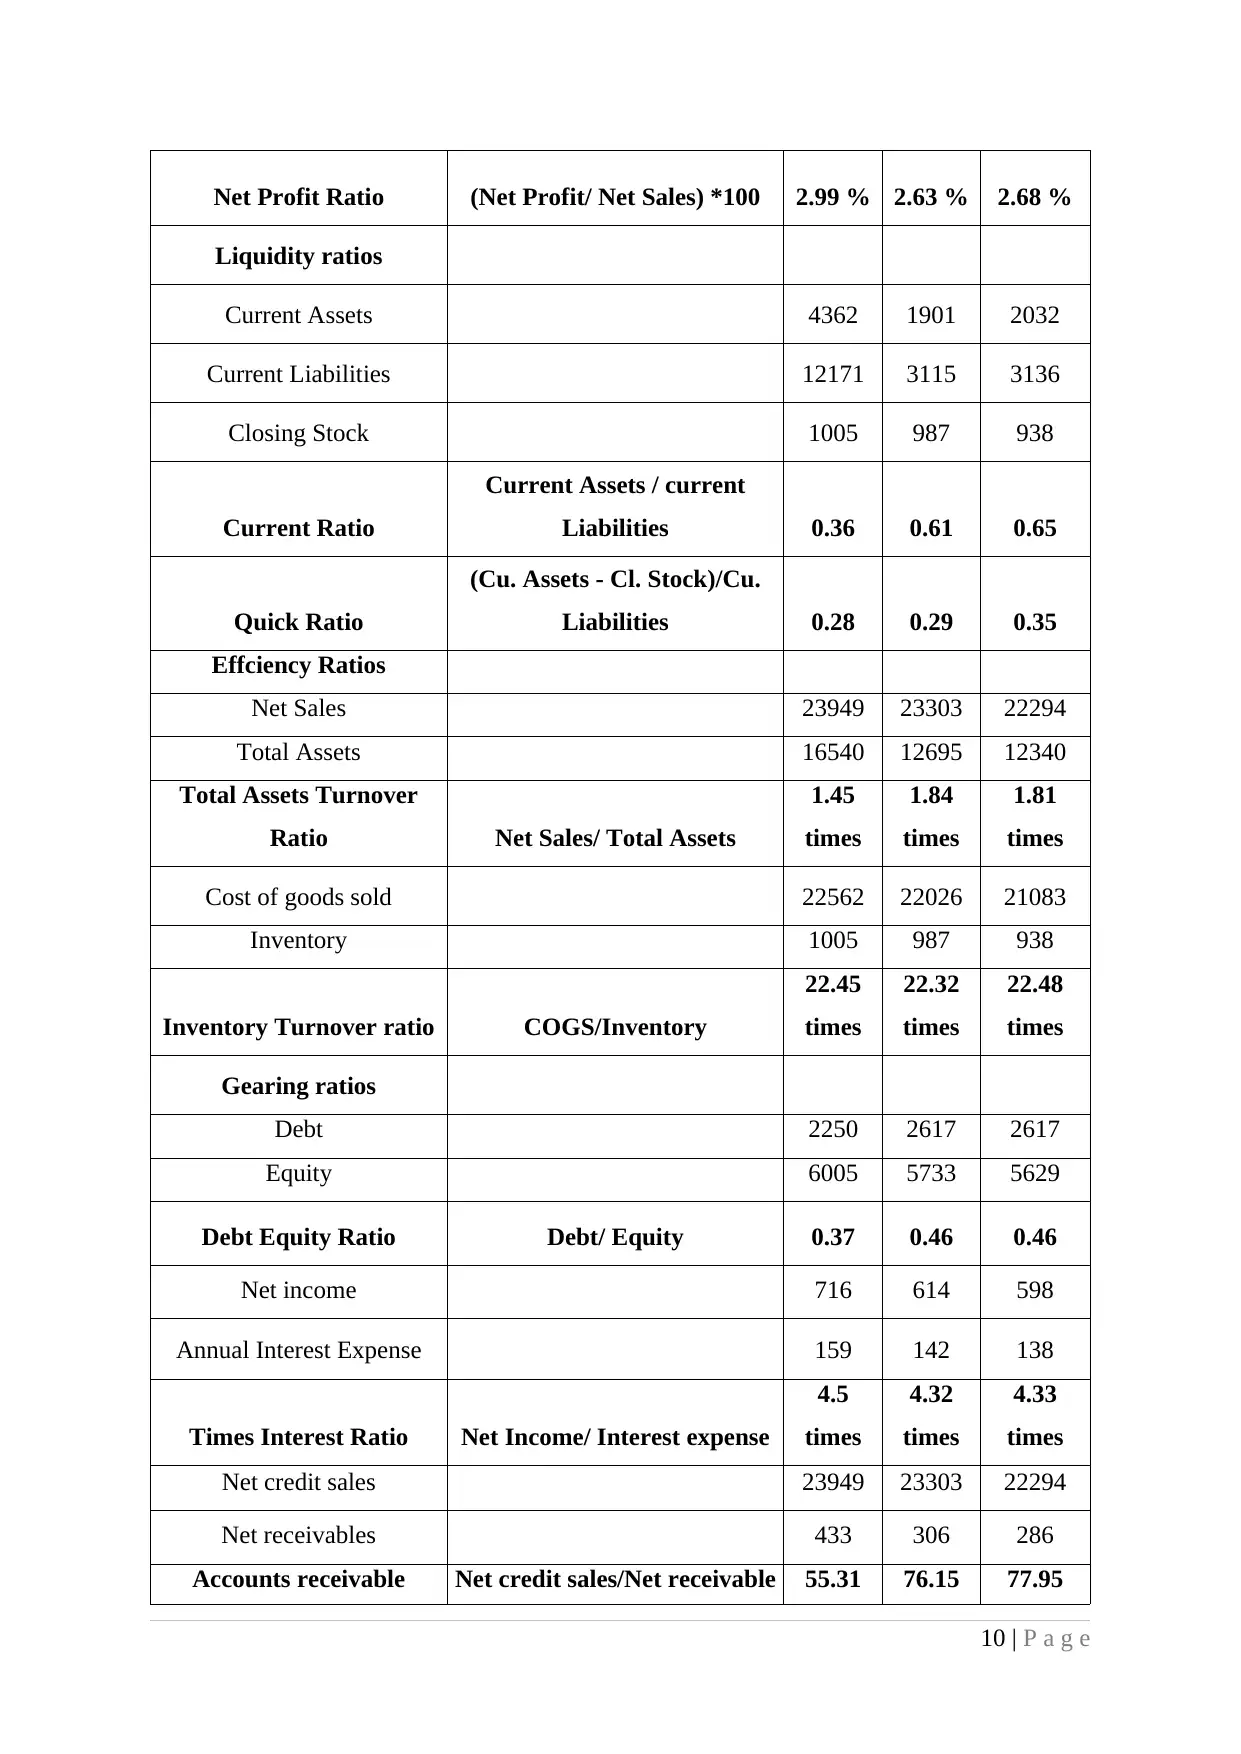
Net Profit Ratio (Net Profit/ Net Sales) *100 2.99 % 2.63 % 2.68 %
Liquidity ratios
Current Assets 4362 1901 2032
Current Liabilities 12171 3115 3136
Closing Stock 1005 987 938
Current Ratio
Current Assets / current
Liabilities 0.36 0.61 0.65
Quick Ratio
(Cu. Assets - Cl. Stock)/Cu.
Liabilities 0.28 0.29 0.35
Effciency Ratios
Net Sales 23949 23303 22294
Total Assets 16540 12695 12340
Total Assets Turnover
Ratio Net Sales/ Total Assets
1.45
times
1.84
times
1.81
times
Cost of goods sold 22562 22026 21083
Inventory 1005 987 938
Inventory Turnover ratio COGS/Inventory
22.45
times
22.32
times
22.48
times
Gearing ratios
Debt 2250 2617 2617
Equity 6005 5733 5629
Debt Equity Ratio Debt/ Equity 0.37 0.46 0.46
Net income 716 614 598
Annual Interest Expense 159 142 138
Times Interest Ratio Net Income/ Interest expense
4.5
times
4.32
times
4.33
times
Net credit sales 23949 23303 22294
Net receivables 433 306 286
Accounts receivable Net credit sales/Net receivable 55.31 76.15 77.95
10 | P a g e
⊘ This is a preview!⊘
Do you want full access?
Subscribe today to unlock all pages.
Trusted by 1+ million students worldwide
1 out of 14
Related Documents


Your All-in-One AI-Powered Toolkit for Academic Success.
+13062052269
info@desklib.com
Available 24*7 on WhatsApp / Email
![[object Object]](/_next/static/media/star-bottom.7253800d.svg)
Unlock your academic potential
Copyright © 2020–2026 A2Z Services. All Rights Reserved. Developed and managed by ZUCOL.