Business Economics Report: Market Equilibrium Analysis
VerifiedAdded on 2020/05/28
|18
|2664
|38
Report
AI Summary
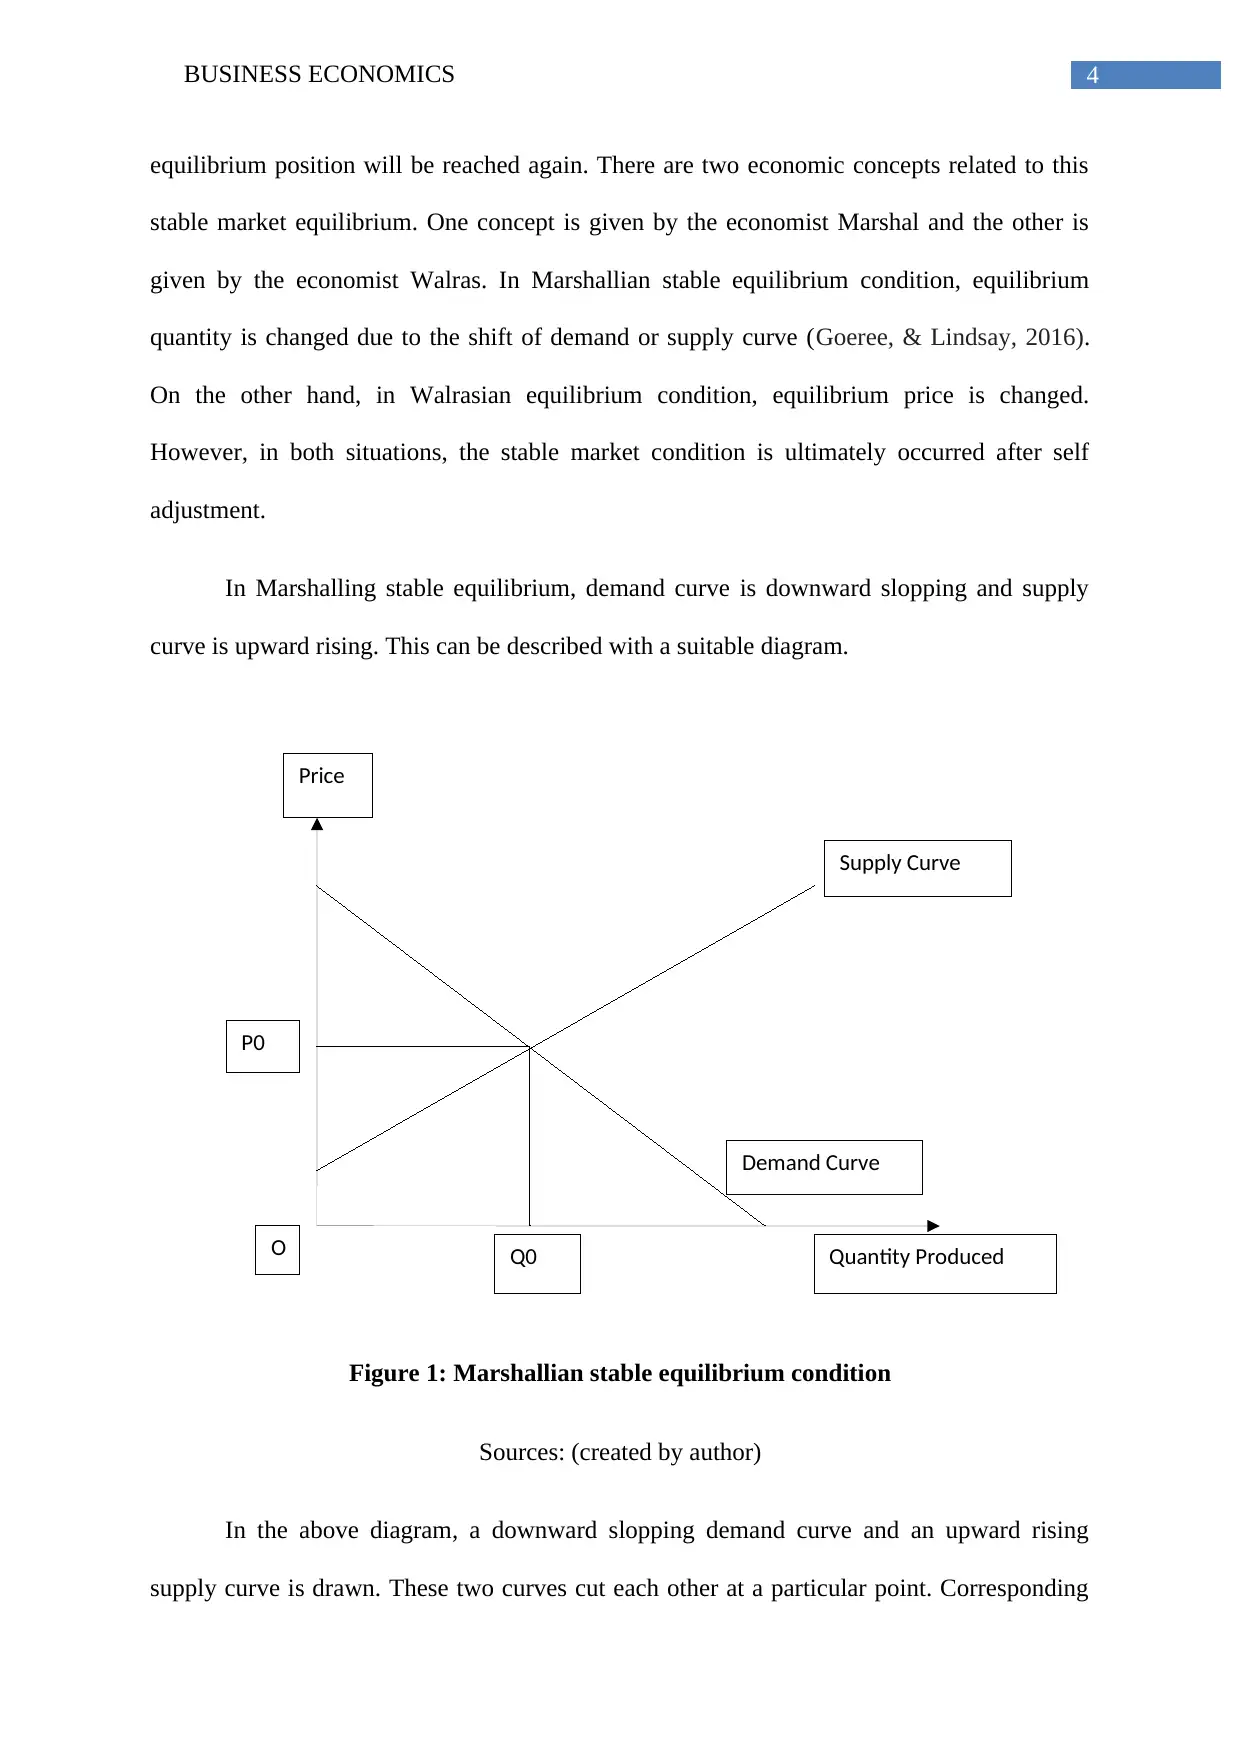
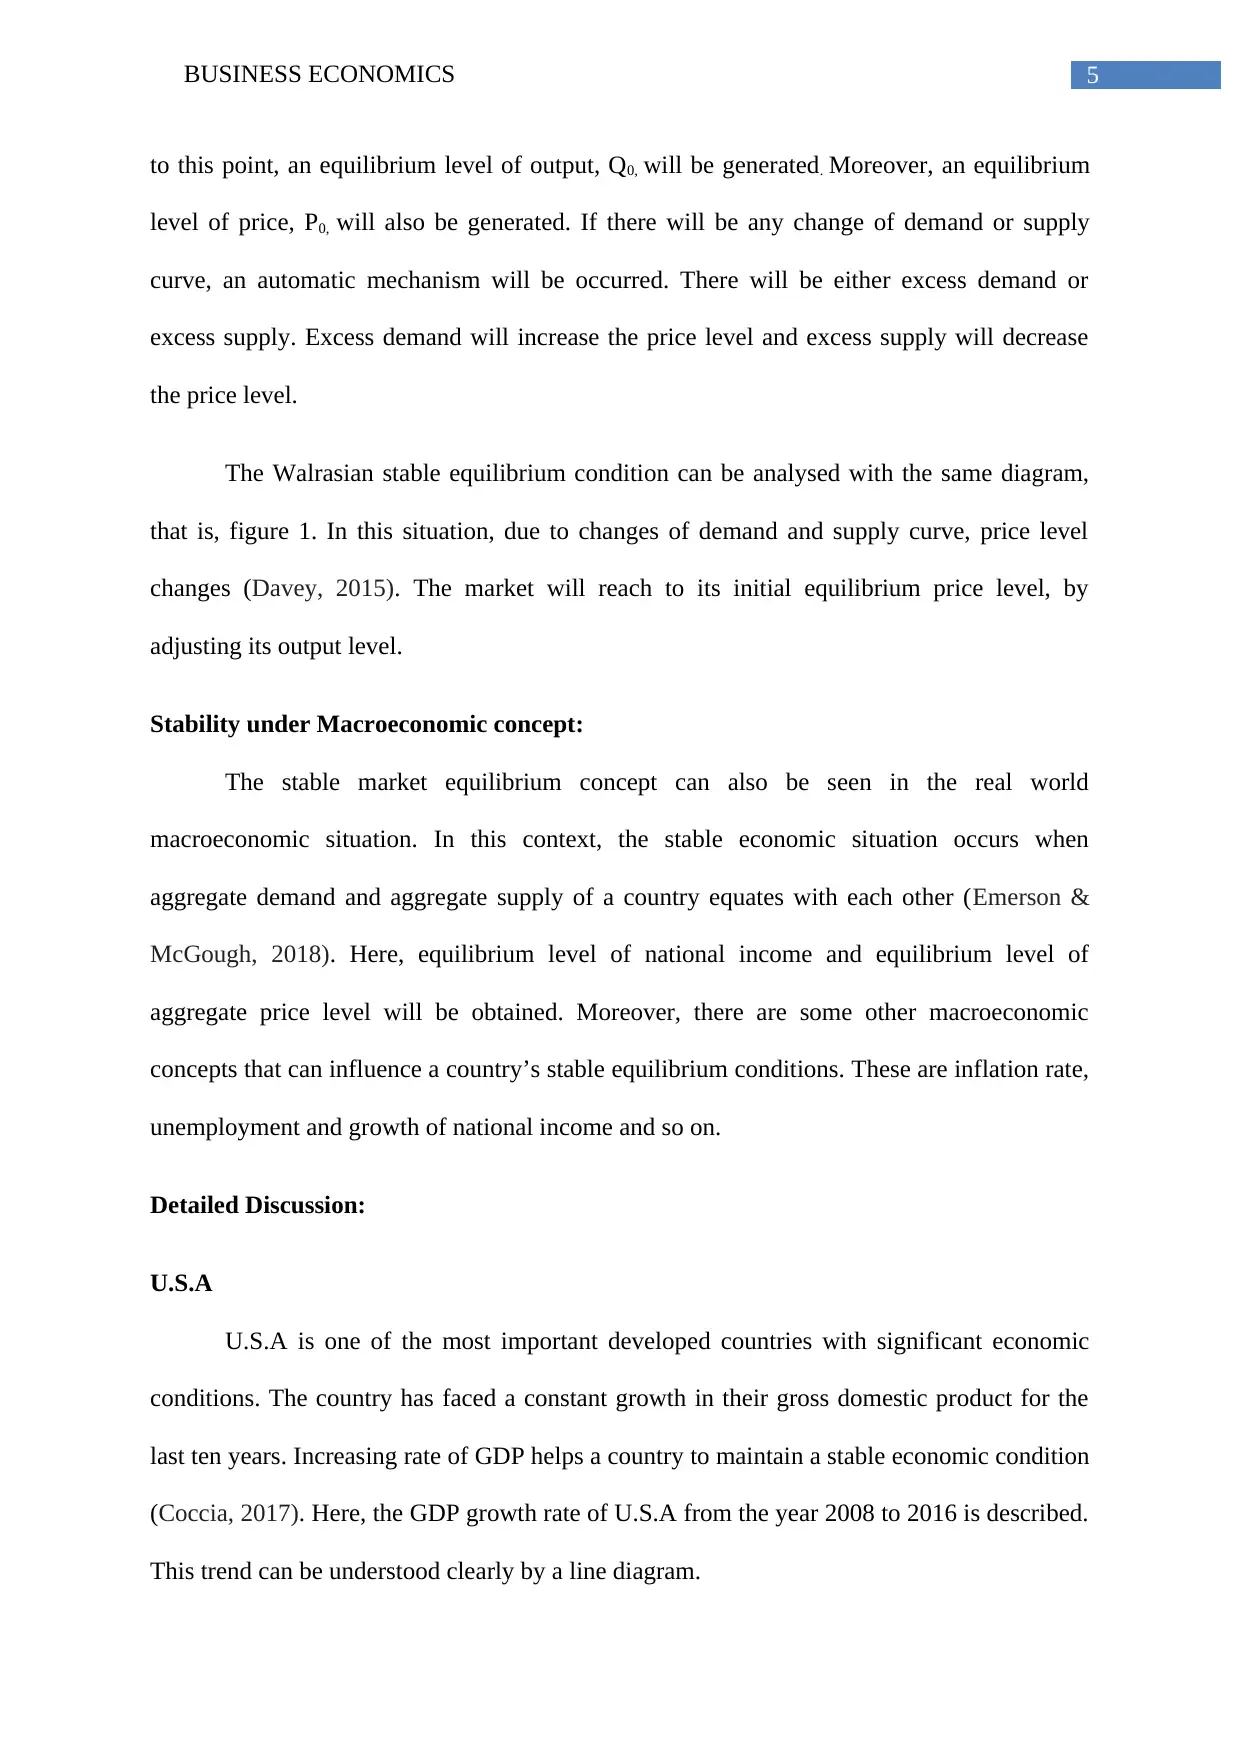
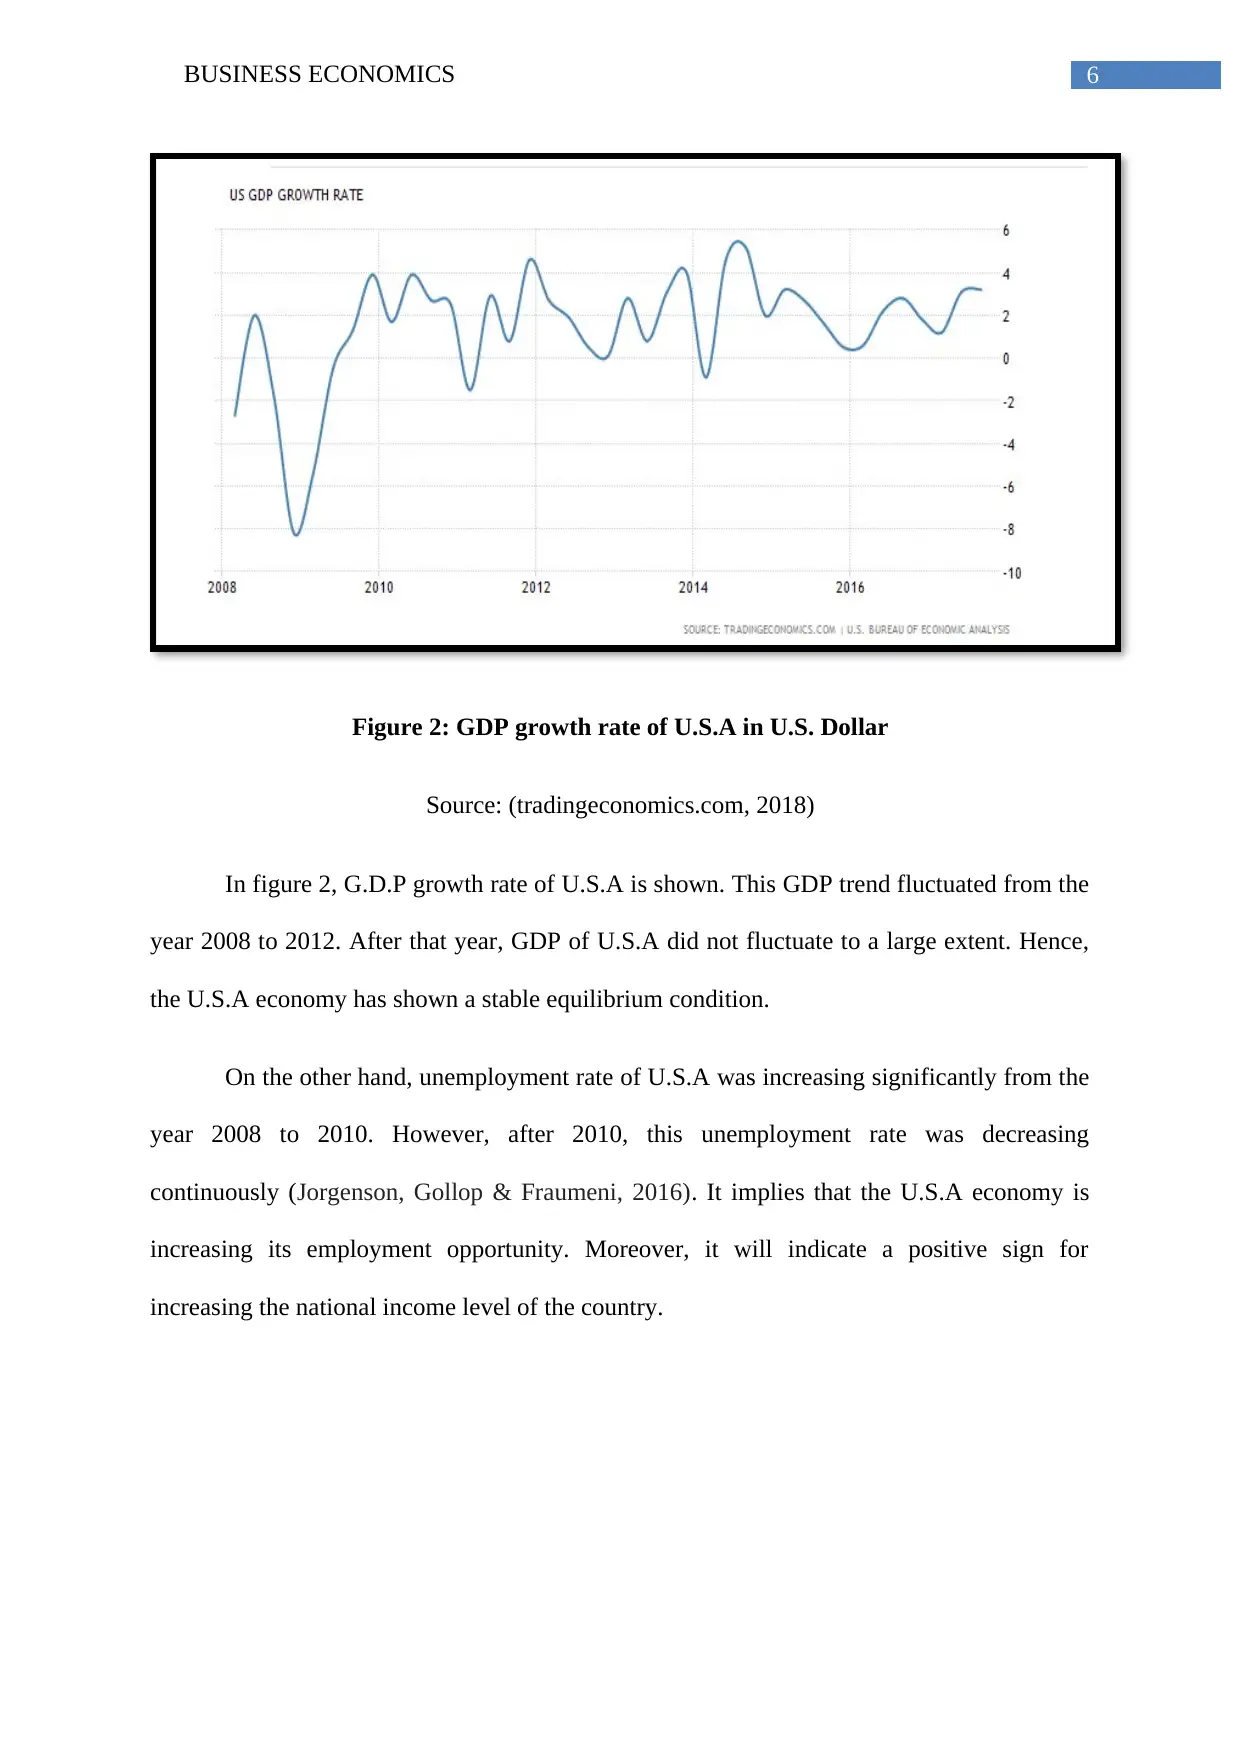
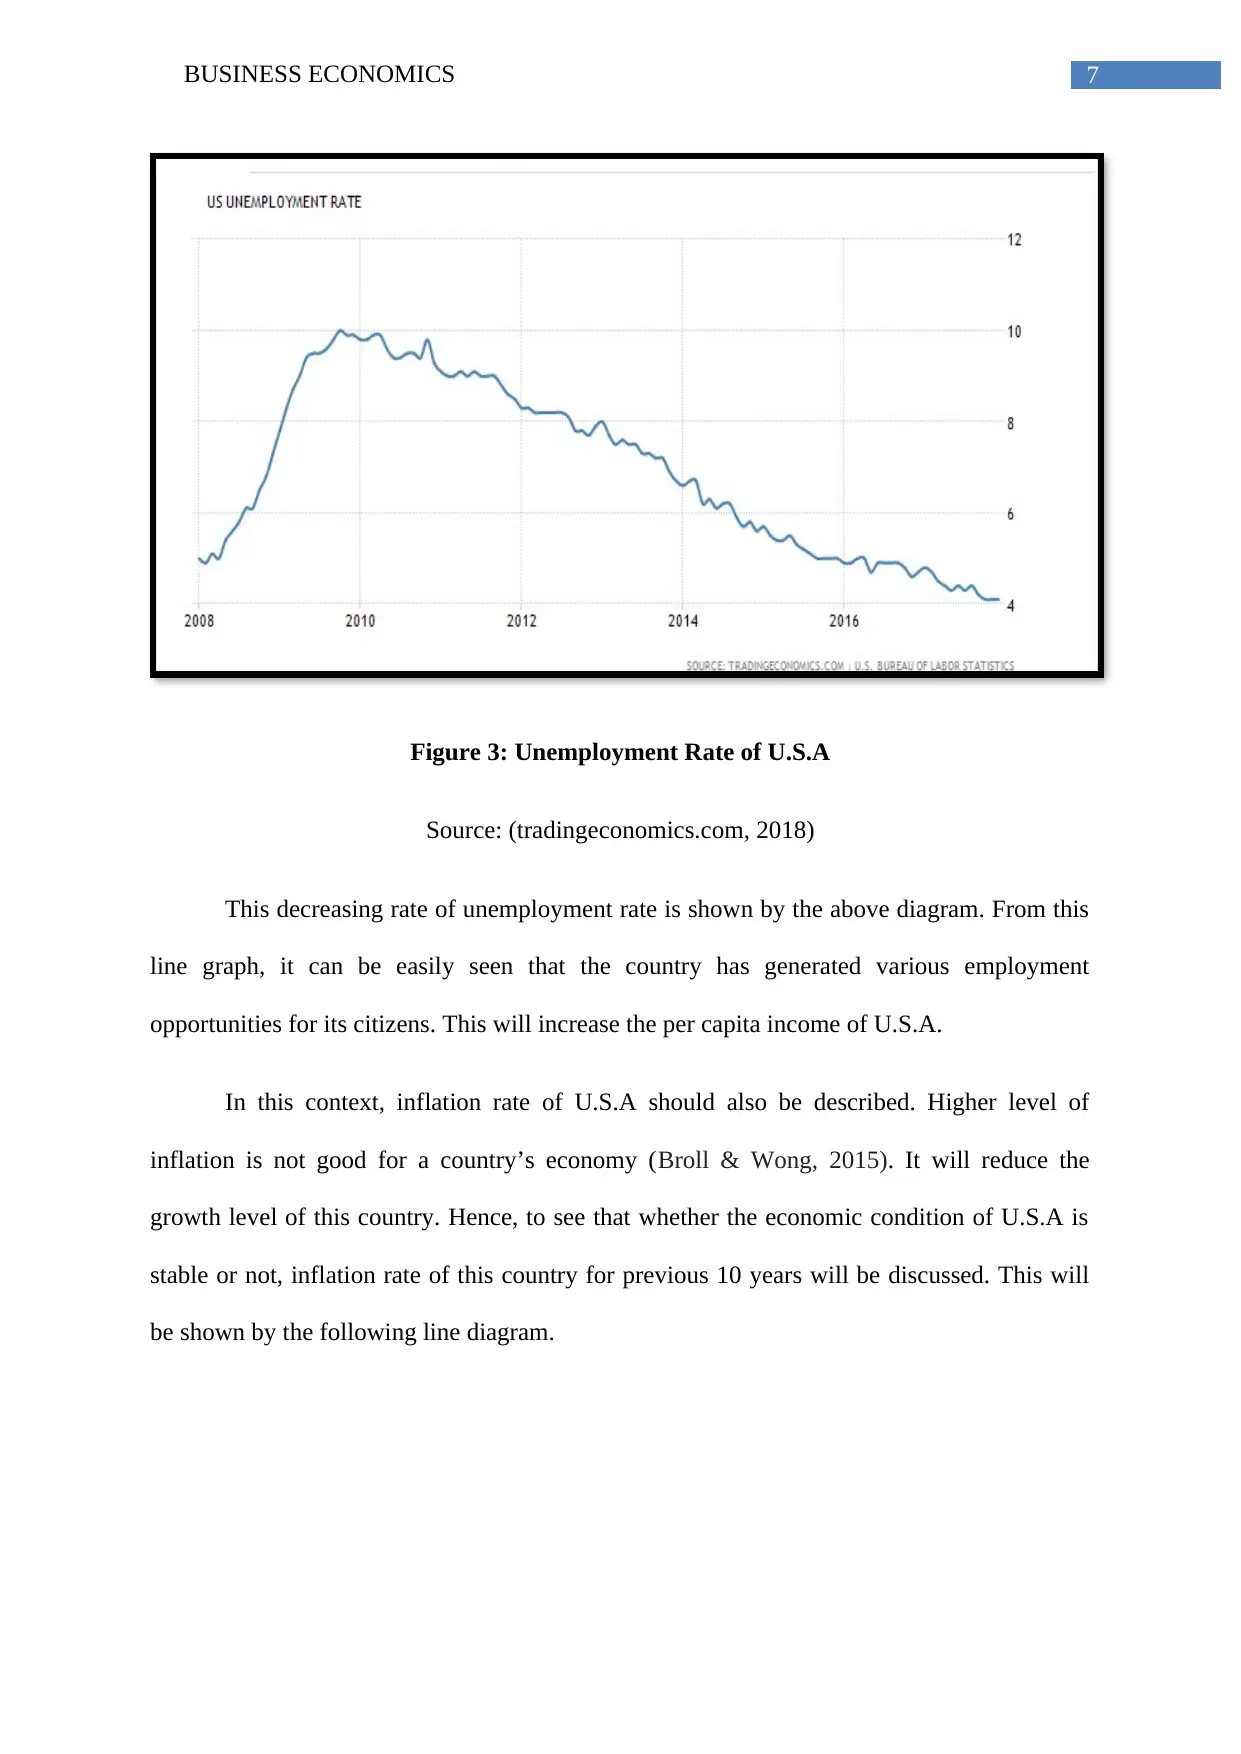
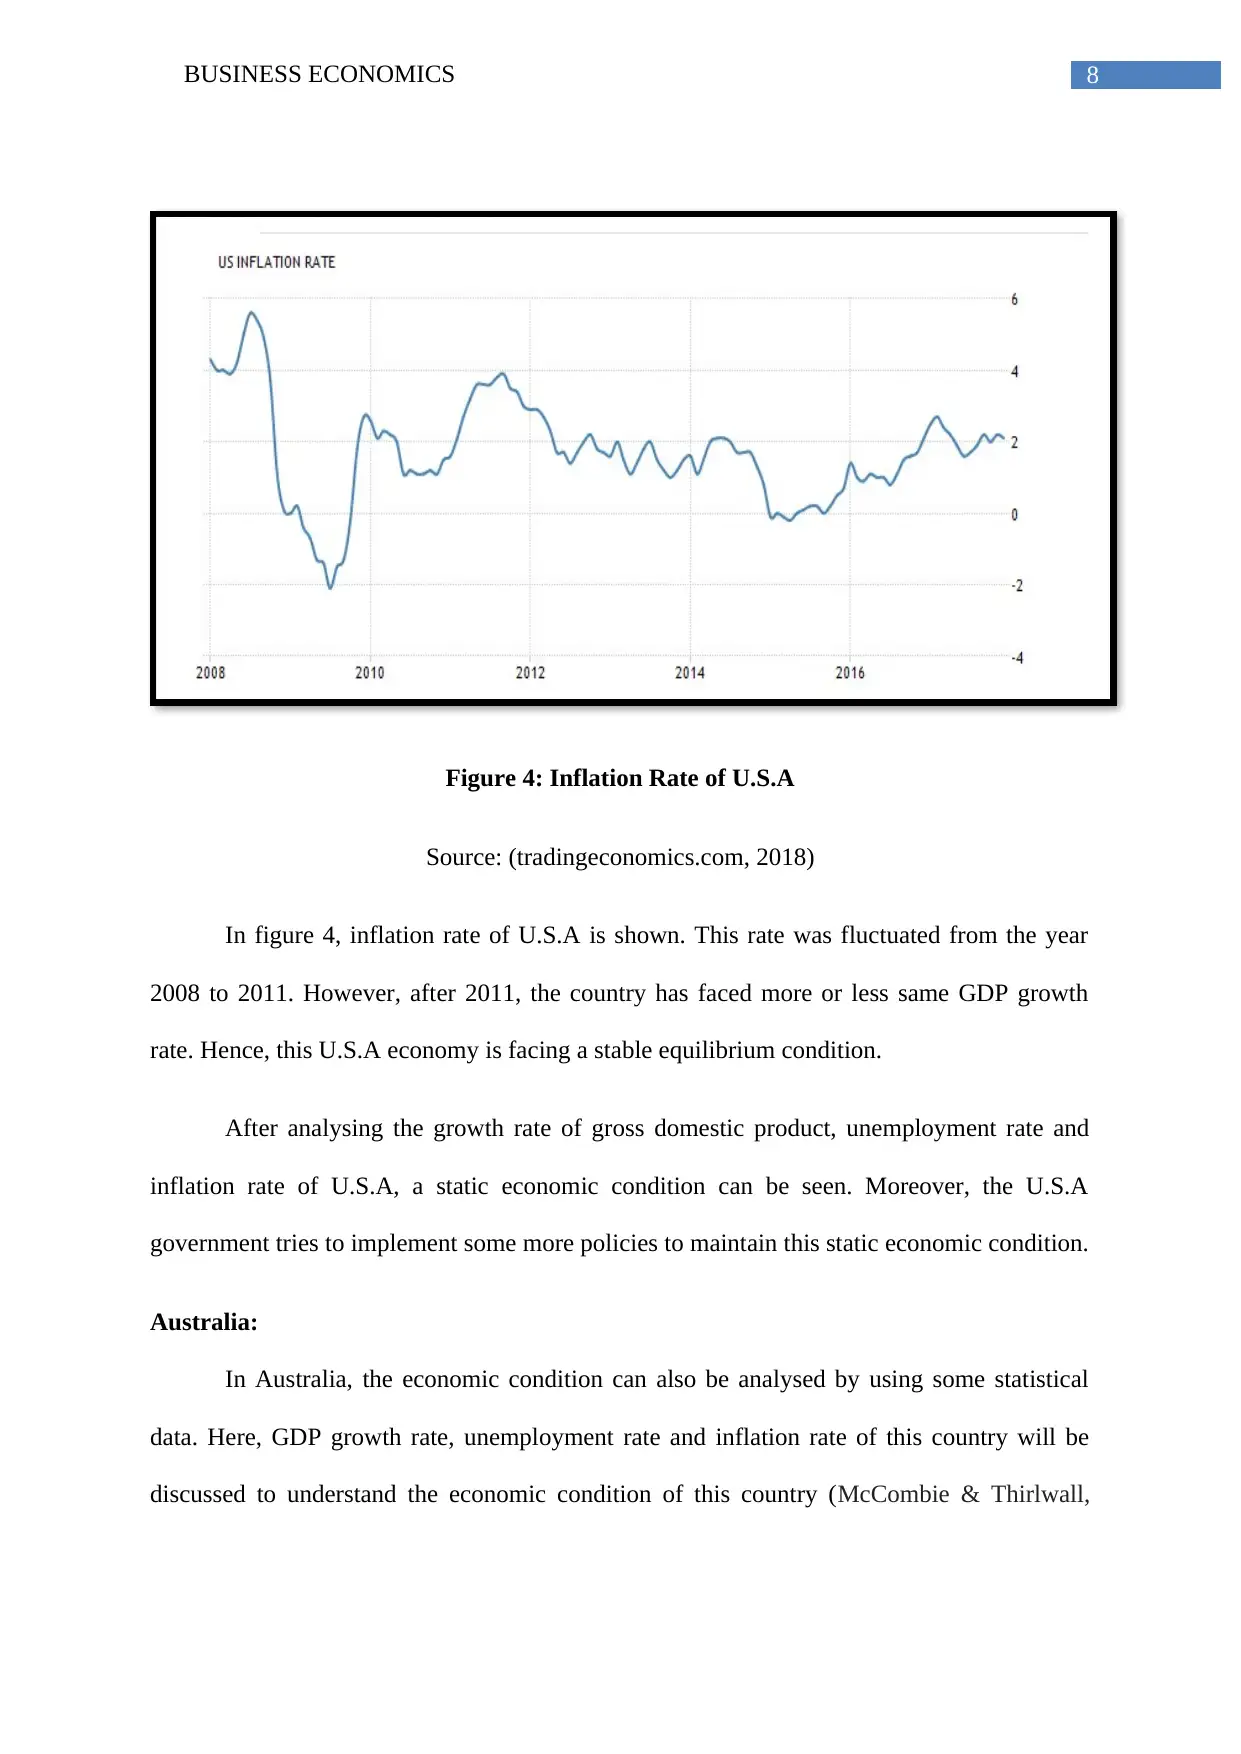
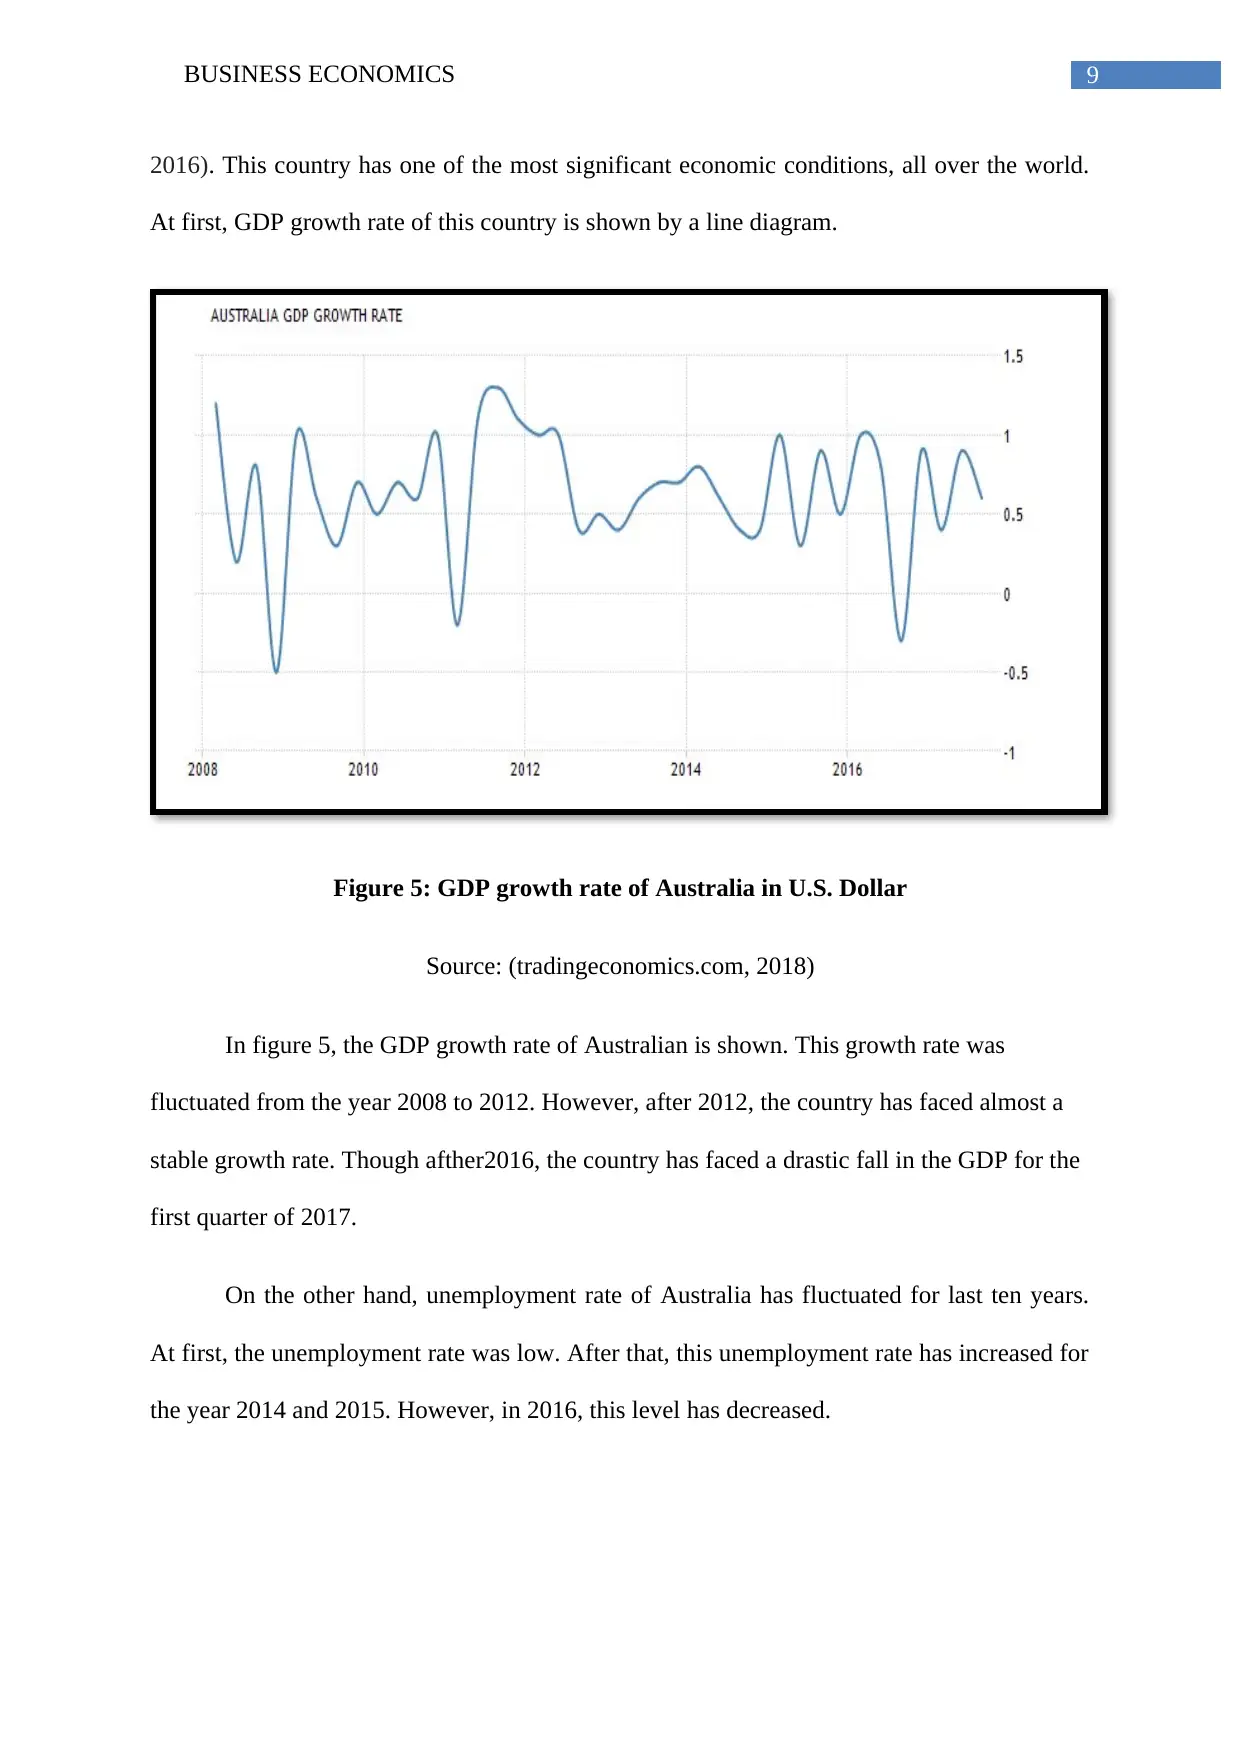
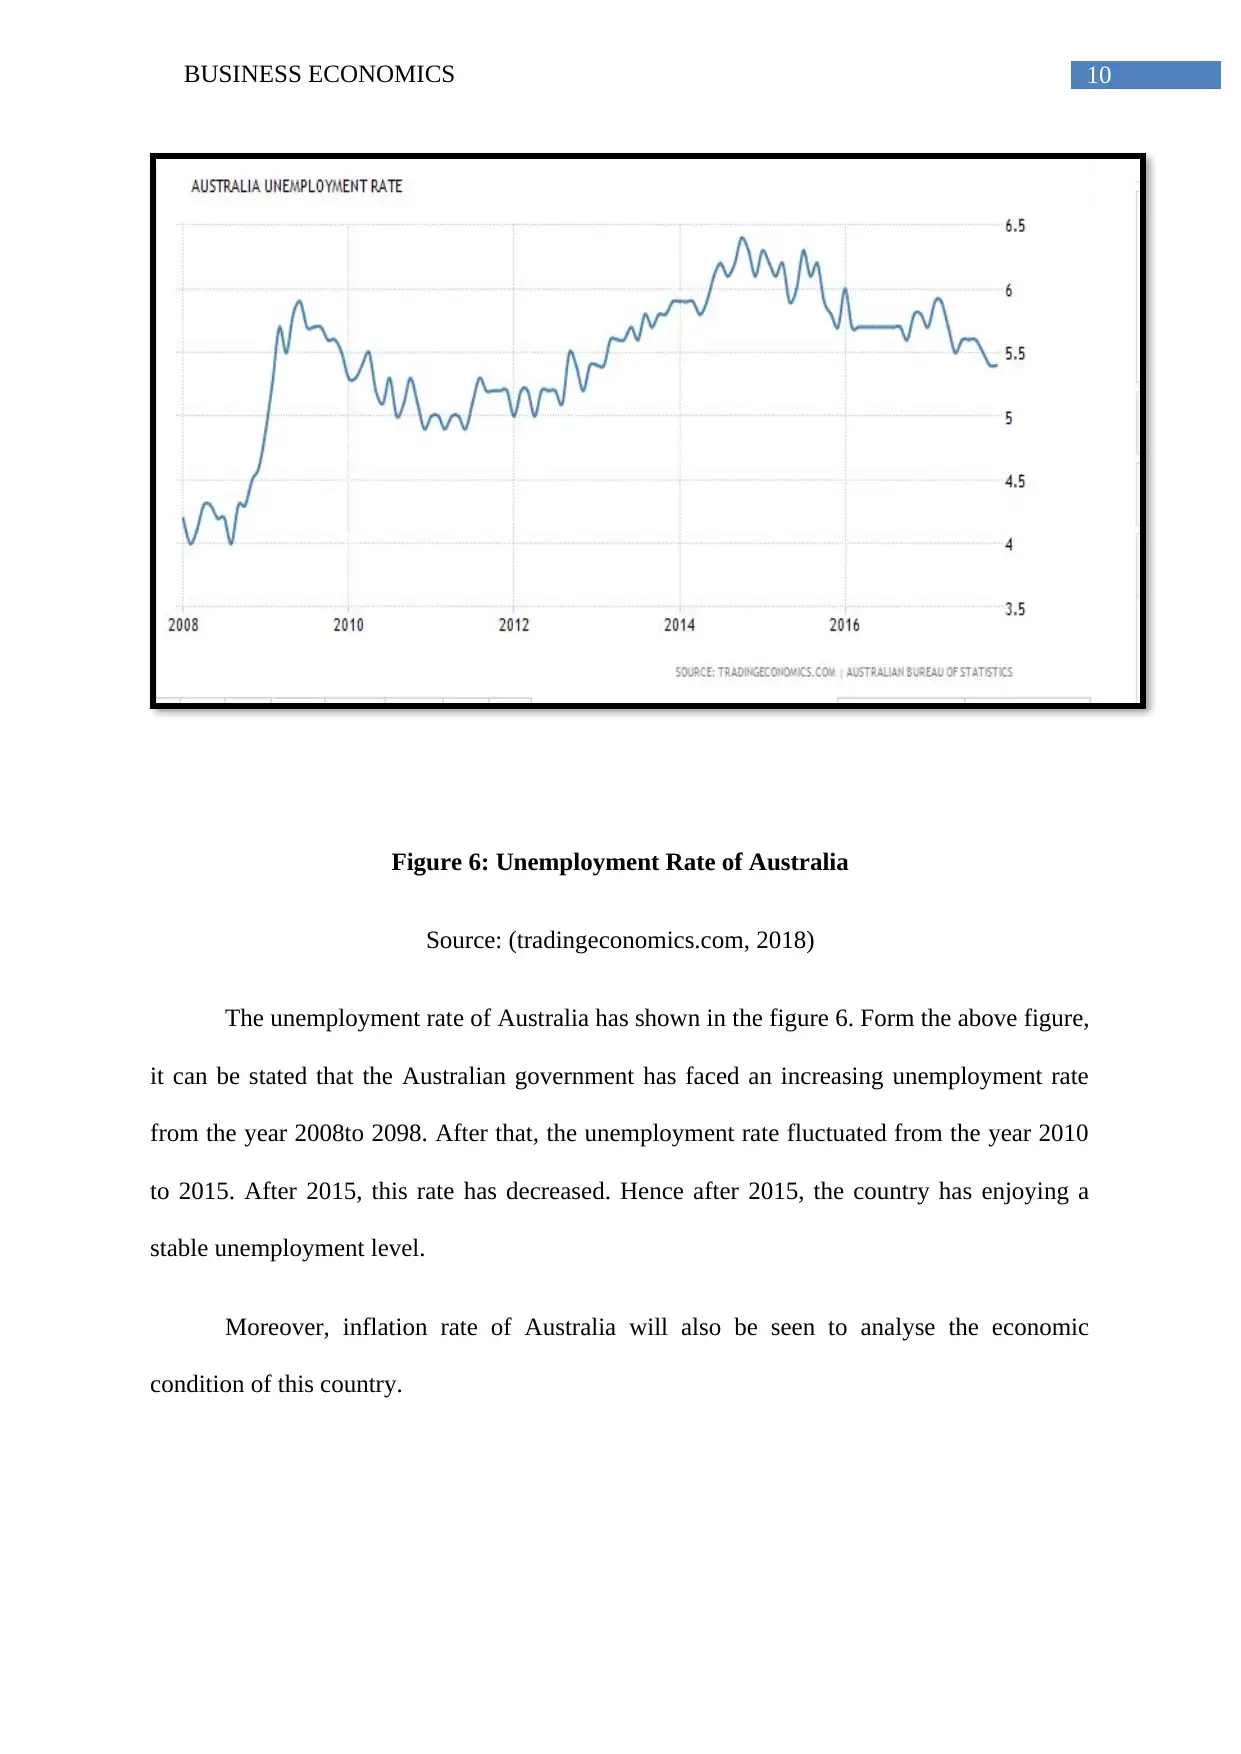
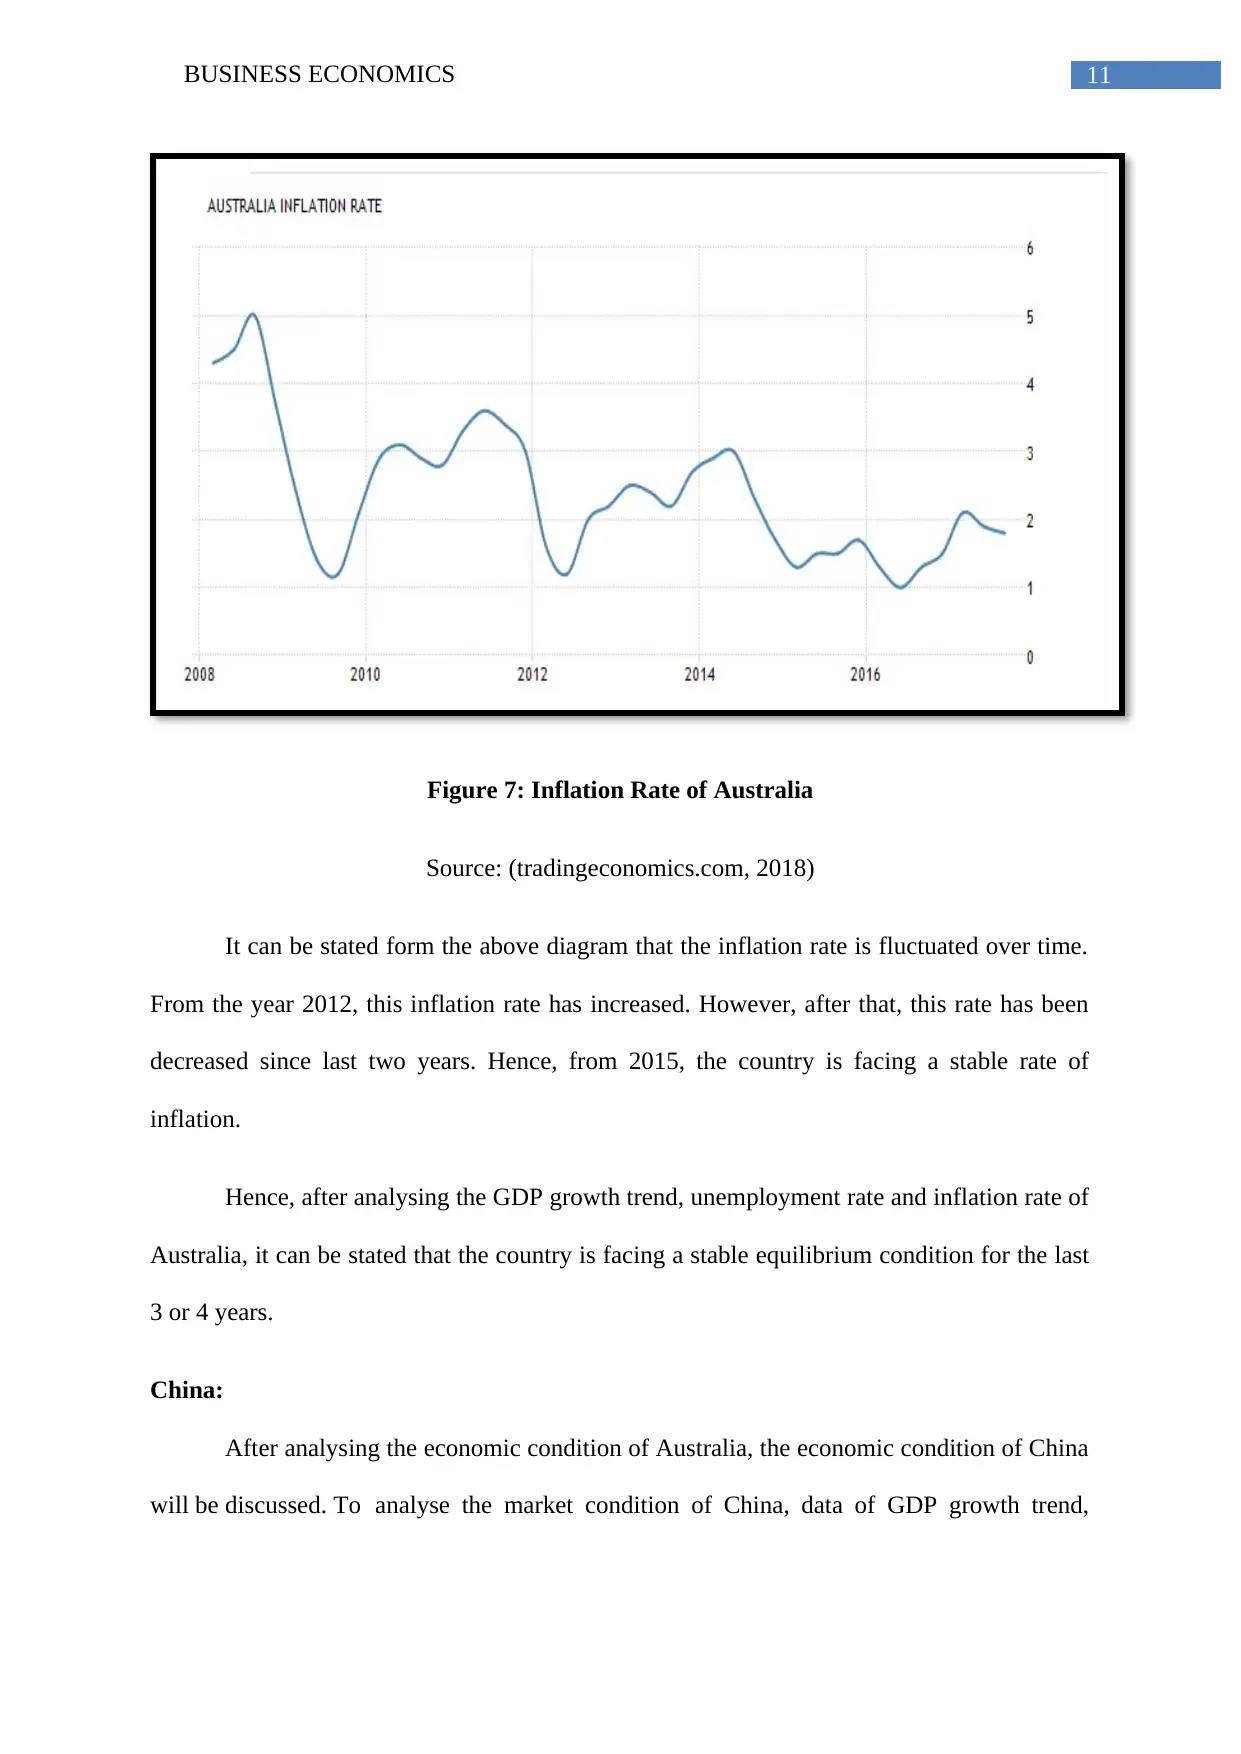
This report provides an analysis of market equilibrium, a fundamental concept in microeconomics, extending into a macroeconomic context by examining the Gross Domestic Product (GDP), unemployment rate, and inflation rate of the U.S., Australia, and China. The introduction establishes the concept of stable equilibrium, influenced by external factors, and sets the stage for comparing the economic conditions of the three countries. The analysis section outlines the economic theory behind market equilibrium, differentiating between Marshallian and Walrasian equilibrium conditions, and includes relevant diagrams. The detailed discussion presents statistical data, including GDP growth, unemployment rates, and inflation rates from 2008 to 2016 for each country. The U.S. and Australia demonstrate relatively stable economic conditions, whereas China exhibits fluctuations in GDP growth and unemployment, indicating less stability. The report concludes by summarizing the comparative economic stability of the three nations based on the analyzed macroeconomic factors and provides a list of references used.

Running head: BUSINESS ECONOMICS
Business Economics
Name of the University
Name of the Student
Author Note
Business Economics
Name of the University
Name of the Student
Author Note
Paraphrase This Document
Need a fresh take? Get an instant paraphrase of this document with our AI Paraphraser

1BUSINESS ECONOMICS
Executive Summary:
Market equilibrium is a basic microeconomic concept. In this situation, total demand and
total supply of a country equate with each other. However, under macroeconomic concept, a
country’s gross domestic product (GDP), unemployment rate and inflation rate are taken
under consideration to analyse the market condition of a country. By analysing those factors,
it can be seen that the country is either is stable position or not. In this report, the market
condition of U.S, Australia and China are taken to discuss.

2BUSINESS ECONOMICS
Table of Contents
Introduction:...............................................................................................................................3
Analysis:.....................................................................................................................................3
Theory:...................................................................................................................................3
Stability under Macroeconomic concept:...............................................................................5
Detailed Discussion:...............................................................................................................5
U.S.A......................................................................................................................................5
Australia:................................................................................................................................8
China:...................................................................................................................................11
Conclusion:..............................................................................................................................14
Reference:................................................................................................................................15
⊘ This is a preview!⊘
Do you want full access?
Subscribe today to unlock all pages.

Trusted by 1+ million students worldwide

3BUSINESS ECONOMICS
Introduction:
Economic equilibrium is a situation, where aggregate market demand and aggregate
market supply equate with each other. However, this equilibrium situation can be stable or
unstable. In this report, the concept of stable equilibrium will be discussed. Moreover, there
are some external factors, which can influence this equilibrium condition of a country. These
are labour employment, entire price level, consumer preferences, inflation rate and some
other external forces (Emerson & McGough, 2018). However, under a stable equilibrium
condition, no external factors can change this equilibrium condition. Hence, each country
wants to attain this stable equilibrium condition. In this report, the economic condition of
United States, Australia and China will be analysed. Some real statistical data of these three
countries will be given to understand the actual market condition. Moreover, it will be
analysed that whether the economic condition of each country is in equilibrium or not. To
analyse this report, a proper economic theory based ton aggregate demand and aggregate
supply will be considered. After analysing this whole topic, a conclusion will be drawn based
on those analyses.
Analysis:
Theory:
Market equilibrium is an important concept of economics. Under stable market
equilibrium, aggregate supply and aggregate demand of a country will remain in balance.
Moreover, an equilibrium output and an equilibrium price level will be obtained. Under a
stable market condition, this equilibrium price level and output level will always remain fixed
(Brekke, Golombek, Kaut, Kittelsen & Wallace, 2017). If any external forces change these
equilibrium positions, the market will automatically adjust itself. Hence, the initial
Paraphrase This Document
Need a fresh take? Get an instant paraphrase of this document with our AI Paraphraser

4BUSINESS ECONOMICS
Price
Quantity Produced
Supply Curve
Demand Curve
Q0
P0
O
equilibrium position will be reached again. There are two economic concepts related to this
stable market equilibrium. One concept is given by the economist Marshal and the other is
given by the economist Walras. In Marshallian stable equilibrium condition, equilibrium
quantity is changed due to the shift of demand or supply curve (Goeree, & Lindsay, 2016).
On the other hand, in Walrasian equilibrium condition, equilibrium price is changed.
However, in both situations, the stable market condition is ultimately occurred after self
adjustment.
In Marshalling stable equilibrium, demand curve is downward slopping and supply
curve is upward rising. This can be described with a suitable diagram.
Figure 1: Marshallian stable equilibrium condition
Sources: (created by author)
In the above diagram, a downward slopping demand curve and an upward rising
supply curve is drawn. These two curves cut each other at a particular point. Corresponding

5BUSINESS ECONOMICS
to this point, an equilibrium level of output, Q0, will be generated. Moreover, an equilibrium
level of price, P0, will also be generated. If there will be any change of demand or supply
curve, an automatic mechanism will be occurred. There will be either excess demand or
excess supply. Excess demand will increase the price level and excess supply will decrease
the price level.
The Walrasian stable equilibrium condition can be analysed with the same diagram,
that is, figure 1. In this situation, due to changes of demand and supply curve, price level
changes (Davey, 2015). The market will reach to its initial equilibrium price level, by
adjusting its output level.
Stability under Macroeconomic concept:
The stable market equilibrium concept can also be seen in the real world
macroeconomic situation. In this context, the stable economic situation occurs when
aggregate demand and aggregate supply of a country equates with each other (Emerson &
McGough, 2018). Here, equilibrium level of national income and equilibrium level of
aggregate price level will be obtained. Moreover, there are some other macroeconomic
concepts that can influence a country’s stable equilibrium conditions. These are inflation rate,
unemployment and growth of national income and so on.
Detailed Discussion:
U.S.A
U.S.A is one of the most important developed countries with significant economic
conditions. The country has faced a constant growth in their gross domestic product for the
last ten years. Increasing rate of GDP helps a country to maintain a stable economic condition
(Coccia, 2017). Here, the GDP growth rate of U.S.A from the year 2008 to 2016 is described.
This trend can be understood clearly by a line diagram.
⊘ This is a preview!⊘
Do you want full access?
Subscribe today to unlock all pages.

Trusted by 1+ million students worldwide

6BUSINESS ECONOMICS
Figure 2: GDP growth rate of U.S.A in U.S. Dollar
Source: (tradingeconomics.com, 2018)
In figure 2, G.D.P growth rate of U.S.A is shown. This GDP trend fluctuated from the
year 2008 to 2012. After that year, GDP of U.S.A did not fluctuate to a large extent. Hence,
the U.S.A economy has shown a stable equilibrium condition.
On the other hand, unemployment rate of U.S.A was increasing significantly from the
year 2008 to 2010. However, after 2010, this unemployment rate was decreasing
continuously (Jorgenson, Gollop & Fraumeni, 2016). It implies that the U.S.A economy is
increasing its employment opportunity. Moreover, it will indicate a positive sign for
increasing the national income level of the country.
Paraphrase This Document
Need a fresh take? Get an instant paraphrase of this document with our AI Paraphraser

7BUSINESS ECONOMICS
Figure 3: Unemployment Rate of U.S.A
Source: (tradingeconomics.com, 2018)
This decreasing rate of unemployment rate is shown by the above diagram. From this
line graph, it can be easily seen that the country has generated various employment
opportunities for its citizens. This will increase the per capita income of U.S.A.
In this context, inflation rate of U.S.A should also be described. Higher level of
inflation is not good for a country’s economy (Broll & Wong, 2015). It will reduce the
growth level of this country. Hence, to see that whether the economic condition of U.S.A is
stable or not, inflation rate of this country for previous 10 years will be discussed. This will
be shown by the following line diagram.

8BUSINESS ECONOMICS
Figure 4: Inflation Rate of U.S.A
Source: (tradingeconomics.com, 2018)
In figure 4, inflation rate of U.S.A is shown. This rate was fluctuated from the year
2008 to 2011. However, after 2011, the country has faced more or less same GDP growth
rate. Hence, this U.S.A economy is facing a stable equilibrium condition.
After analysing the growth rate of gross domestic product, unemployment rate and
inflation rate of U.S.A, a static economic condition can be seen. Moreover, the U.S.A
government tries to implement some more policies to maintain this static economic condition.
Australia:
In Australia, the economic condition can also be analysed by using some statistical
data. Here, GDP growth rate, unemployment rate and inflation rate of this country will be
discussed to understand the economic condition of this country (McCombie & Thirlwall,
⊘ This is a preview!⊘
Do you want full access?
Subscribe today to unlock all pages.

Trusted by 1+ million students worldwide

9BUSINESS ECONOMICS
2016). This country has one of the most significant economic conditions, all over the world.
At first, GDP growth rate of this country is shown by a line diagram.
Figure 5: GDP growth rate of Australia in U.S. Dollar
Source: (tradingeconomics.com, 2018)
In figure 5, the GDP growth rate of Australian is shown. This growth rate was
fluctuated from the year 2008 to 2012. However, after 2012, the country has faced almost a
stable growth rate. Though afther2016, the country has faced a drastic fall in the GDP for the
first quarter of 2017.
On the other hand, unemployment rate of Australia has fluctuated for last ten years.
At first, the unemployment rate was low. After that, this unemployment rate has increased for
the year 2014 and 2015. However, in 2016, this level has decreased.
Paraphrase This Document
Need a fresh take? Get an instant paraphrase of this document with our AI Paraphraser

10BUSINESS ECONOMICS
Figure 6: Unemployment Rate of Australia
Source: (tradingeconomics.com, 2018)
The unemployment rate of Australia has shown in the figure 6. Form the above figure,
it can be stated that the Australian government has faced an increasing unemployment rate
from the year 2008to 2098. After that, the unemployment rate fluctuated from the year 2010
to 2015. After 2015, this rate has decreased. Hence after 2015, the country has enjoying a
stable unemployment level.
Moreover, inflation rate of Australia will also be seen to analyse the economic
condition of this country.

11BUSINESS ECONOMICS
Figure 7: Inflation Rate of Australia
Source: (tradingeconomics.com, 2018)
It can be stated form the above diagram that the inflation rate is fluctuated over time.
From the year 2012, this inflation rate has increased. However, after that, this rate has been
decreased since last two years. Hence, from 2015, the country is facing a stable rate of
inflation.
Hence, after analysing the GDP growth trend, unemployment rate and inflation rate of
Australia, it can be stated that the country is facing a stable equilibrium condition for the last
3 or 4 years.
China:
After analysing the economic condition of Australia, the economic condition of China
will be discussed. To analyse the market condition of China, data of GDP growth trend,
⊘ This is a preview!⊘
Do you want full access?
Subscribe today to unlock all pages.

Trusted by 1+ million students worldwide
1 out of 18
Related Documents
Your All-in-One AI-Powered Toolkit for Academic Success.
+13062052269
info@desklib.com
Available 24*7 on WhatsApp / Email
Unlock your academic potential
Copyright © 2020–2025 A2Z Services. All Rights Reserved. Developed and managed by ZUCOL.


