Microeconomics Assignment: Free Trade, Taxation, and Welfare

Verified

Added on  2020/05/28

|18
|2638
|54
Homework Assignment
AI Summary
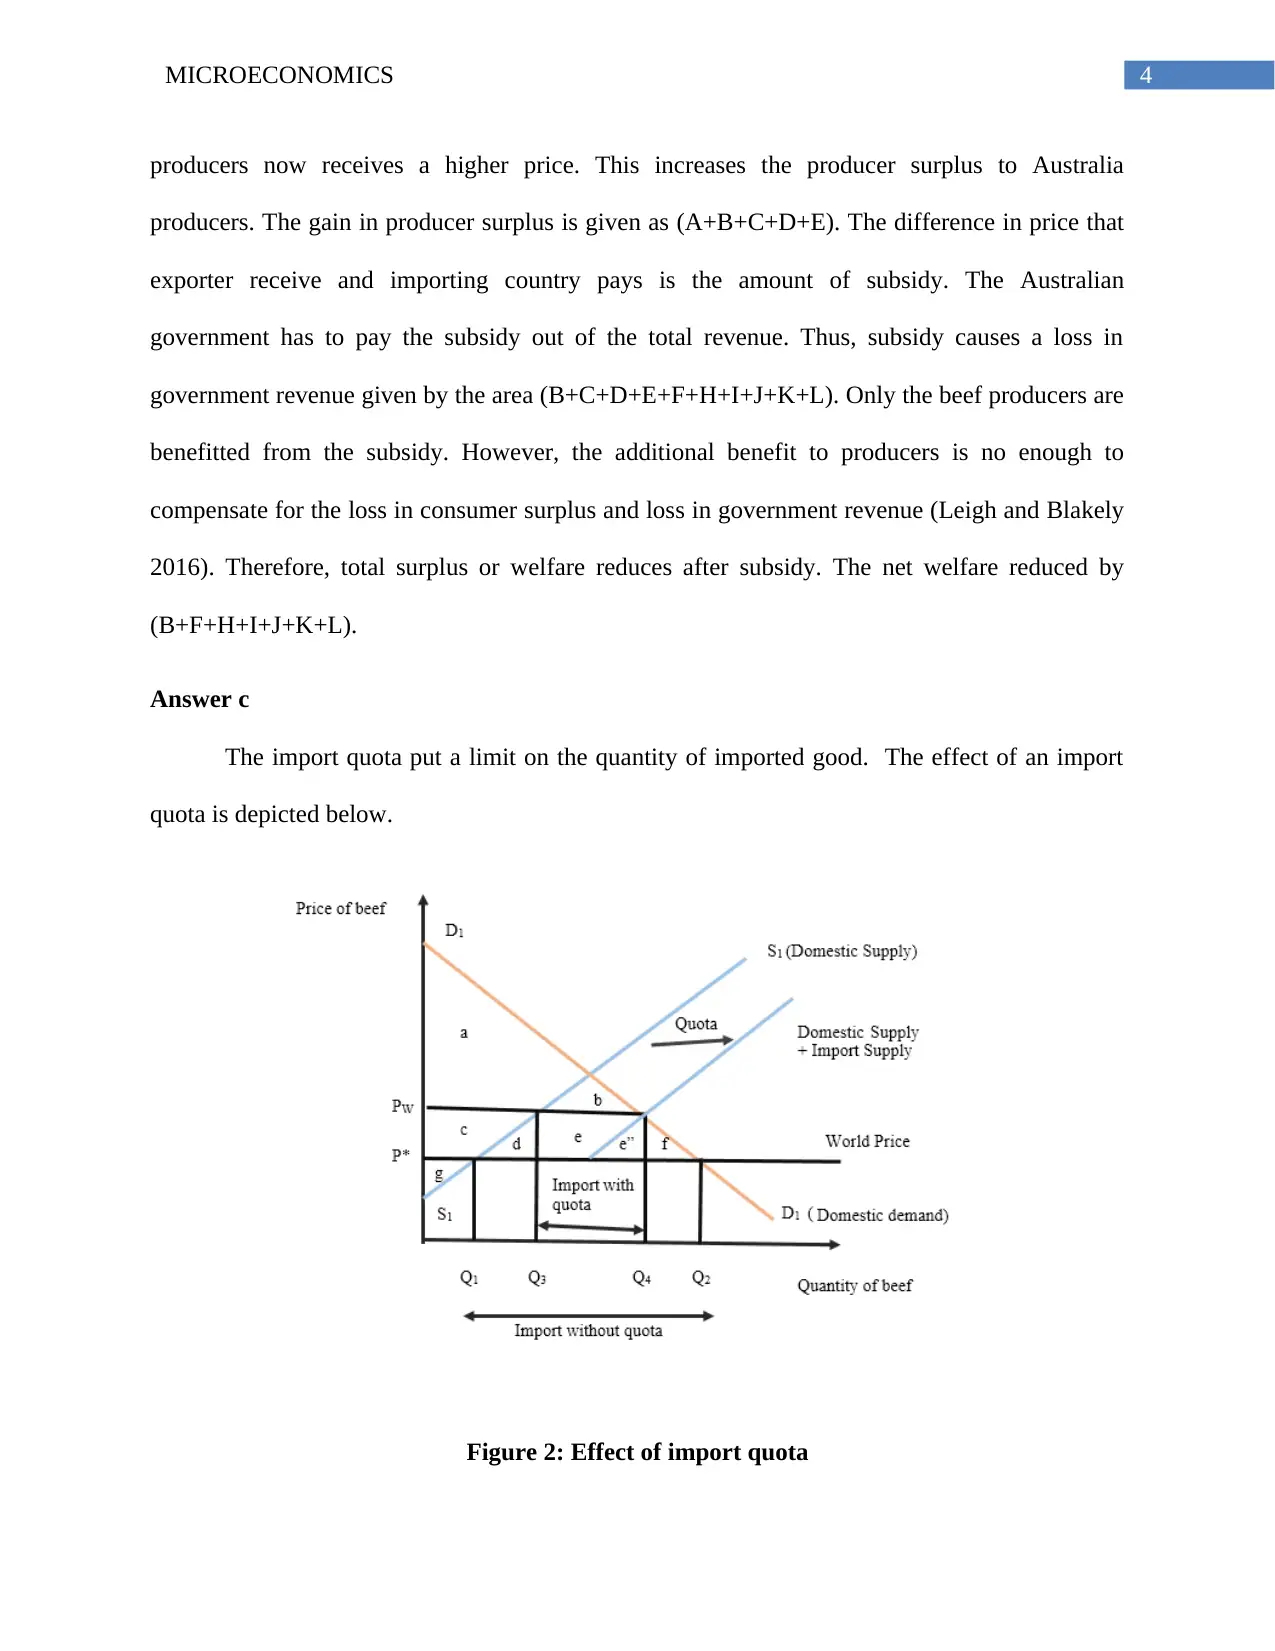
This microeconomics assignment analyzes the effects of free trade agreements, export subsidies, import quotas, and taxation on market outcomes and welfare. The assignment begins by examining the impact of an export subsidy on the Australian beef market, detailing changes in consumer and producer surplus, and overall welfare implications. It then explores the effects of import quotas in the Canadian beef market, including the shifts in supply and demand, and the resulting welfare losses. The assignment also discusses the infant industry and anti-dumping arguments for trade protection. Furthermore, it delves into producer surplus calculations under different market prices and quantities. The assignment then analyzes market equilibrium, consumer surplus, and producer surplus using demand and supply functions. Finally, it examines the impact of a tax on Alcopops, evaluating the effects on both buyers and sellers, considering the elasticity of demand, and assessing the effectiveness of the tax in reducing consumption and achieving policy objectives, including alternative policy measures.
Document Page
Running Head: MICROECONOMICS
Microeconomics
Name of the Student
Name of the University
Author note
tabler-icon-diamond-filled.svg

Paraphrase This Document

Need a fresh take? Get an instant paraphrase of this document with our AI Paraphraser
Document Page
1MICROECONOMICS
Table of Contents
Answer 1..........................................................................................................................................2
Answer a......................................................................................................................................2
Answer b......................................................................................................................................3
Answer c......................................................................................................................................4
Answer d......................................................................................................................................5
Answer 2..........................................................................................................................................6
Answer a......................................................................................................................................6
Answer b......................................................................................................................................7
Answer 3..........................................................................................................................................8
Answer a......................................................................................................................................8
Answer b......................................................................................................................................8
Answer c......................................................................................................................................9
Answer d....................................................................................................................................10
Answer 4........................................................................................................................................11
Answer a....................................................................................................................................11
Answer b....................................................................................................................................14
References......................................................................................................................................16
Document Page
2MICROECONOMICS
Answer 1
` The free trade agreement between Canada and Australia allows transaction between the
two nations without any restriction. Some countries are in favor of trade and support export
competing industries. While others to protect their domestic industries often restricts imports
either by raising price of import with import tariff or by putting an import quota (Feenstra 2015).
Both the policy of an export subsidy and import quota are analyzed with their welfare impacts.
Answer a
The policy of export subsidy offers exporters incentive to raise export. Following figure
describes the effect an export subsidy.
Figure 1: Effect of export Subsidy
(Source: as created by Author)
Document Page
3MICROECONOMICS
The above figure represents the beef market in Australia. The domestic demand curve for
beef is DD while the domestic supply curve is SS. Price of beef in the global market is PW. At
this price, demand of beef in the domestic market is QD0. The domestic suppliers willing to
supply QS0 amount of beef at the price. The supply of beef at the world price exceeds domestic
demand. The rest, (QS0 - QD0) are exported. Now suppose, Australian government want to raise
its beef export. For this, a subsidy of unit s is proposed to be given to the beef producers (Balassa
2014). The immediate effect of subsidy is to increase the price received by domestic producers.
Producers now receives a price of PW1. Domestic consumers now faced with a high price reduce
their demand from QD0 to QD1. Beef producers in Australia receiving a high prices are now
encouraged to produce more. As a result, supply of beef in the domestic market increases from
QS0 to QS1. The reduction in domestic demand combines with an increase in domestic supply
raises export The quantity of beef exported after the export subsidy is (QS1 – QD1). This is how
the quantity of beef exported from Australia to Canada increases when government decides to
provide an export subsidy to the beef sold in the overseas market.
Answer b
The effect of total surplus or welfare will be understood by comparing consumer surplus,
producer surplus and total surplus before and after the subsidy. Before subsidy, consumer in
Australia were getting beef at the world price of PW. At price PW, the consumer surplus received
is given as (A+B+M). After the subsidy, the export of beef raises. The increased export of beef
creates a supply shortage and raises price in the domestic market to PW1. With a high price, the
consumers receive a surplus of M only. The loss in consumer surplus is the area (A+B). The
importing country that is Canada now obtain imported beef at a lower price of PW2 (Blonigen
2016.). The area G adds to the consumer surplus to the importing country. Australian beef
tabler-icon-diamond-filled.svg

Paraphrase This Document

Need a fresh take? Get an instant paraphrase of this document with our AI Paraphraser
Document Page
4MICROECONOMICS
producers now receives a higher price. This increases the producer surplus to Australia
producers. The gain in producer surplus is given as (A+B+C+D+E). The difference in price that
exporter receive and importing country pays is the amount of subsidy. The Australian
government has to pay the subsidy out of the total revenue. Thus, subsidy causes a loss in
government revenue given by the area (B+C+D+E+F+H+I+J+K+L). Only the beef producers are
benefitted from the subsidy. However, the additional benefit to producers is no enough to
compensate for the loss in consumer surplus and loss in government revenue (Leigh and Blakely
2016). Therefore, total surplus or welfare reduces after subsidy. The net welfare reduced by
(B+F+H+I+J+K+L).
Answer c
The import quota put a limit on the quantity of imported good. The effect of an import
quota is depicted below.
Figure 2: Effect of import quota
Document Page
5MICROECONOMICS
(Source: as created by Author)
Figure 2 analyzes Canadian beef market. The domestic demand curve of beef is given by
D1D1. Domestic supply of beef in Canada is given as S1S1. P* is the price prevailed in the world
market. At price P*, demand of beef in Canada is Q2. The Canadian producers at this rice able to
supply only Q1. The excess of domestic demand to supply is the amount of beef imported.
Suppose, government in Canada intends to encourage domestic producers. For this, government
places a restriction on the beef imported from Australia. Suppose, a quota is imposed to limit
import of beef to only (Q3 – Q4). With restricted import, the domestic demand for beef raises.
This increases price of beef in the domestic market and raises domestic supply (Rugman and
Verbeke 2017). Accordingly, the domestic supply curve will shift to the right. The price in the
domestic market is PW. With a higher price consumer surplus now reduces. Consumers suffer a
loss in their surplus by the area (c +d +e’ +e’’+ f). The domestic producers in Canada are
benefited from increased price and demand. The surplus to producers increased from g to g+c.
The area e’+e’’ indicates part of the profit to Australian producers. The welfare loss to the
society is (d + e + e’’+ f).
Answer d
The policy of free trade is not always beneficial for all countries. Industries within the
country often need protection from free trade. Several arguments have made in support of
protectionist policy to free trade. The two common arguments are infant industry argument and
Anti- Dumping argument.
Infant Industry argument
Document Page
6MICROECONOMICS
Infant industry refers to an industry that has just started to evolve. The industry has not
yet reached to the level to compete with foreign producers in the international market. Being at
the initial level of production, the industries face a high operating cost and hence unable to
compete with cheaper export. The argument hold particularly for countries just started their
industrialization (Fine 2016). However, the infant industry argument does not completely oppose
free trade. This advocates support for industries only for a period. Once the industry has
developed completely it should compete freely.
Anti-Dumping argument
Trade protection measures are often considered as anti-dumping measures. Foreign
country often resort to dump commodities to capture market of the trading partners. Therefore,
the domestic producers demand a high tariff to restrict dumping of foreign goods at a low price
than that charged in own country (Bhagwati 2014).
Answer 2
Producer surplus is the total revenue less total variable cost (Kolmar 2017).
Answer a
Given that market price (P) = 40
Quantity (Q) = 2
Therefore, Total Revenue=PriceQuantity
¿ 402
¿ 80
Given the marginal cost total variable cost is obtained as
tabler-icon-diamond-filled.svg

Paraphrase This Document

Need a fresh take? Get an instant paraphrase of this document with our AI Paraphraser
Document Page
7MICROECONOMICS
TVC =
0
Q
MC . dQ
At the output level Q = 2,
TVC =
0
2
30.dQ
¿ [30 Q]0
2
¿ 60
Therefore,
Producer surplus=Total revenueTotal variable cost
¿ 8060
¿ 20
Answer b
Given that market price (P) = 60
Quantity (Q) = 3
Therefore, Total Revenue=PriceQuantity
¿ 603
¿ 180
At the output level Q = 2,
TVC =
0
3
50.dQ
Document Page
8MICROECONOMICS
¿ [50 Q]0
3
¿ 150
Therefore,
Producer surplus=Total revenueTotal variable cost
¿ 180150
¿ 30
Answer 3
Answer a
Given the demand function, QD = 200 – 2P
Inverse demand function=200QD
2
¿ 1000.5QD
Given the supply function, QS = -10 + P
Inverse supply function=10+QS
Document Page
9MICROECONOMICS
Answer b
Answer c
Equilibrium in the market is obtained at a point where the demand and supply curve
intersects (Arrow 2015).
1000.5Q=10+Q( at equlibrium , QD=QS =Q)
¿ , 1.5 Q=90
¿ , Q=60
Price=1000.5 QD
¿ 100(0.560)
¿ 10030
¿ 70
Equilibrium Quantity = 60kg of oranges
tabler-icon-diamond-filled.svg

Paraphrase This Document

Need a fresh take? Get an instant paraphrase of this document with our AI Paraphraser
Document Page
10MICROECONOMICS
Equilibrium price = $70
Answer d
Consumer surplus is indicated as area below demand curve and above the equilibrium
price.
The maximum price that consumers willing to pay is 100.
Consumer surplus= 1
2( 10070 )60
¿ 1
23060
¿ 900
Producer surplus is the benefit to the seller and is the area above the supply curve and
below the equilibrium price .The minimum supply price is 10.
Producer Surplus= 1
2( 7010 )60
Document Page
11MICROECONOMICS
¿ 1
26060
¿ 1800
Total Surplus=Consumer surplus+ Producer surplus
¿ 900+1800
¿ 2700
Answer 4
Answer a
Alcopops are soft drinks that contain some proportion of alcohol. The consumption of
such drinks is not good for health. Government imposes tax on activity to restrict production and
consumption of harmful goods. In order to reduce teenage binge drinking the Australia
government imposes a tax on Alcopops. The tax can be imposed either on buyers or on sellers
(Nicholson and Snyder 2014). The overall effect in both cases are same. The following figures
shows in impact of a tax on Alcopops.
chevron_up_icon
1 out of 18
circle_padding
hide_on_mobile
zoom_out_icon
[object Object]