Microeconomics Assignment: Analyzing Market Structures and Policies

Verified

Added on  2020/05/28

|14
|2100
|43
Homework Assignment
AI Summary
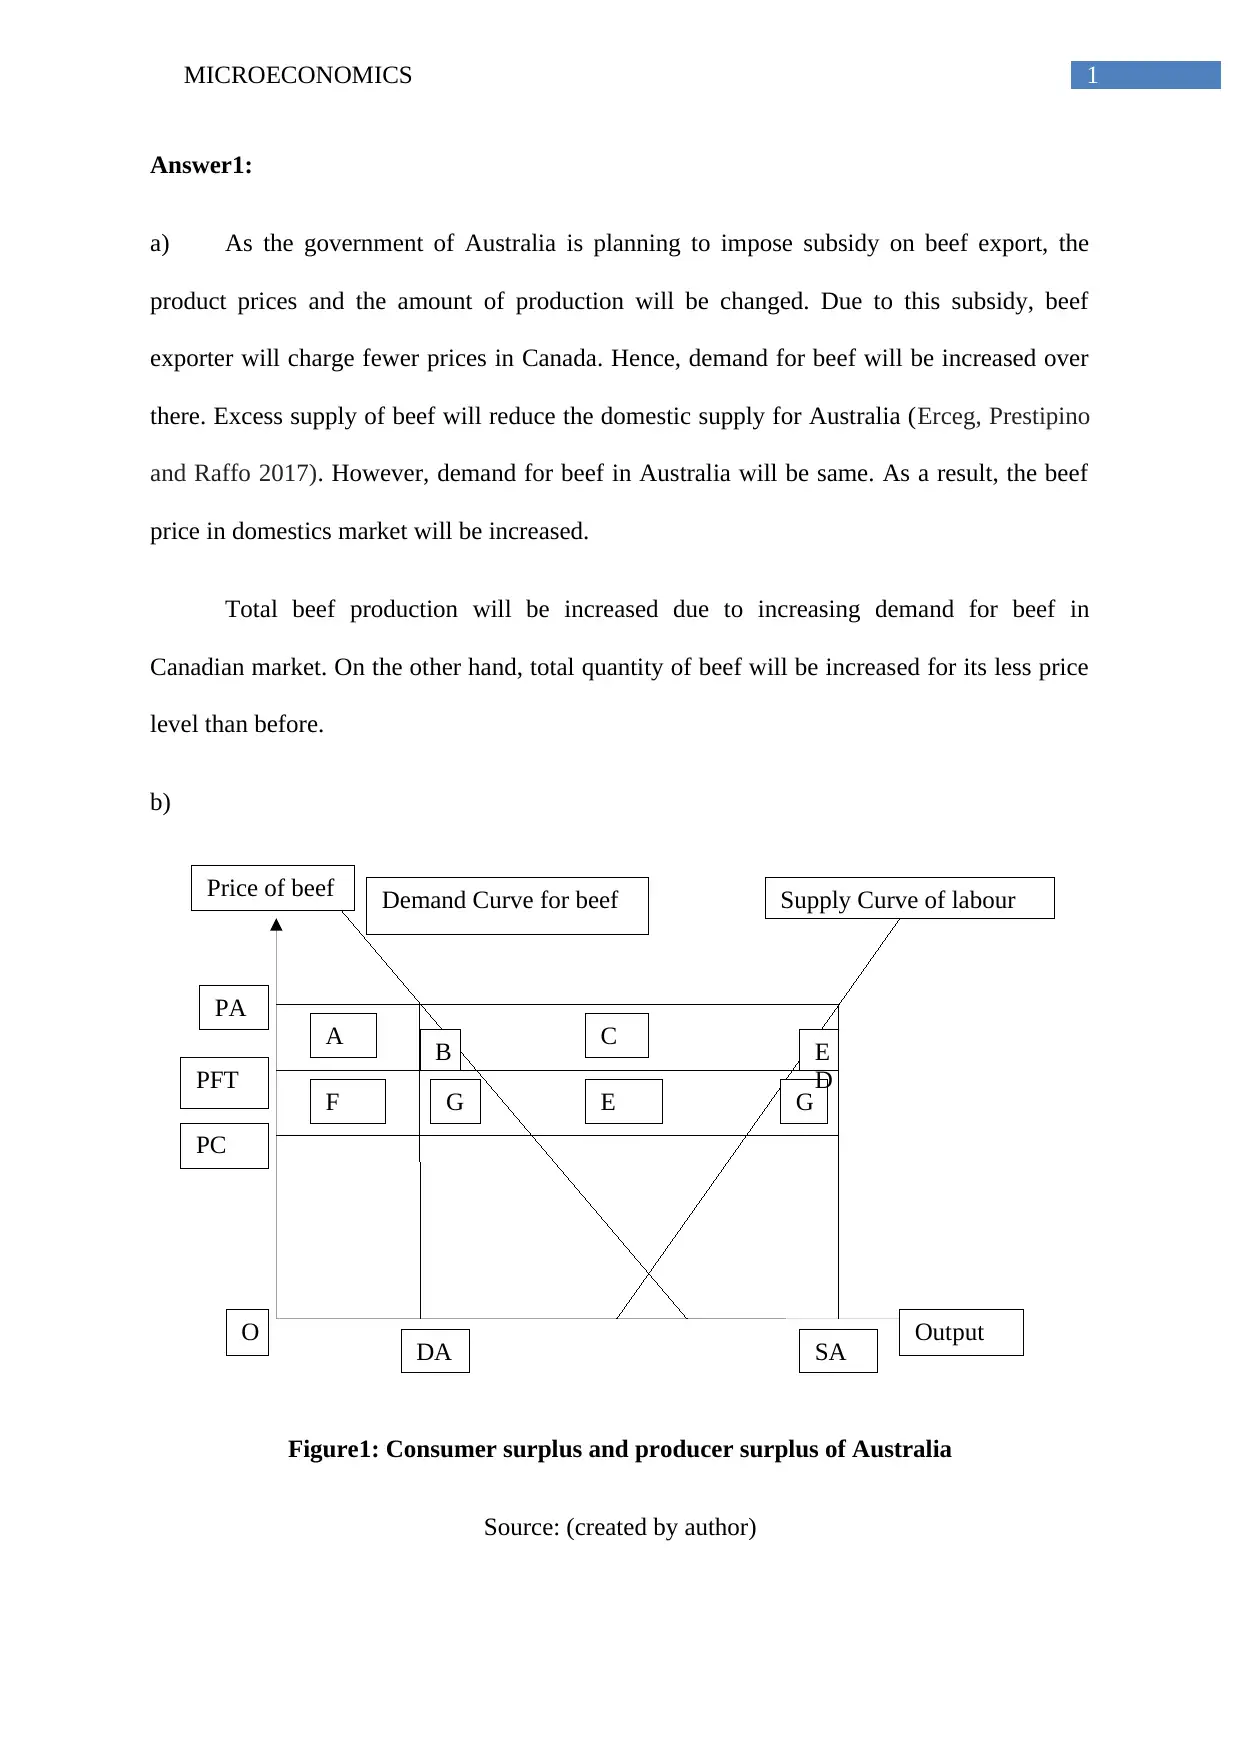
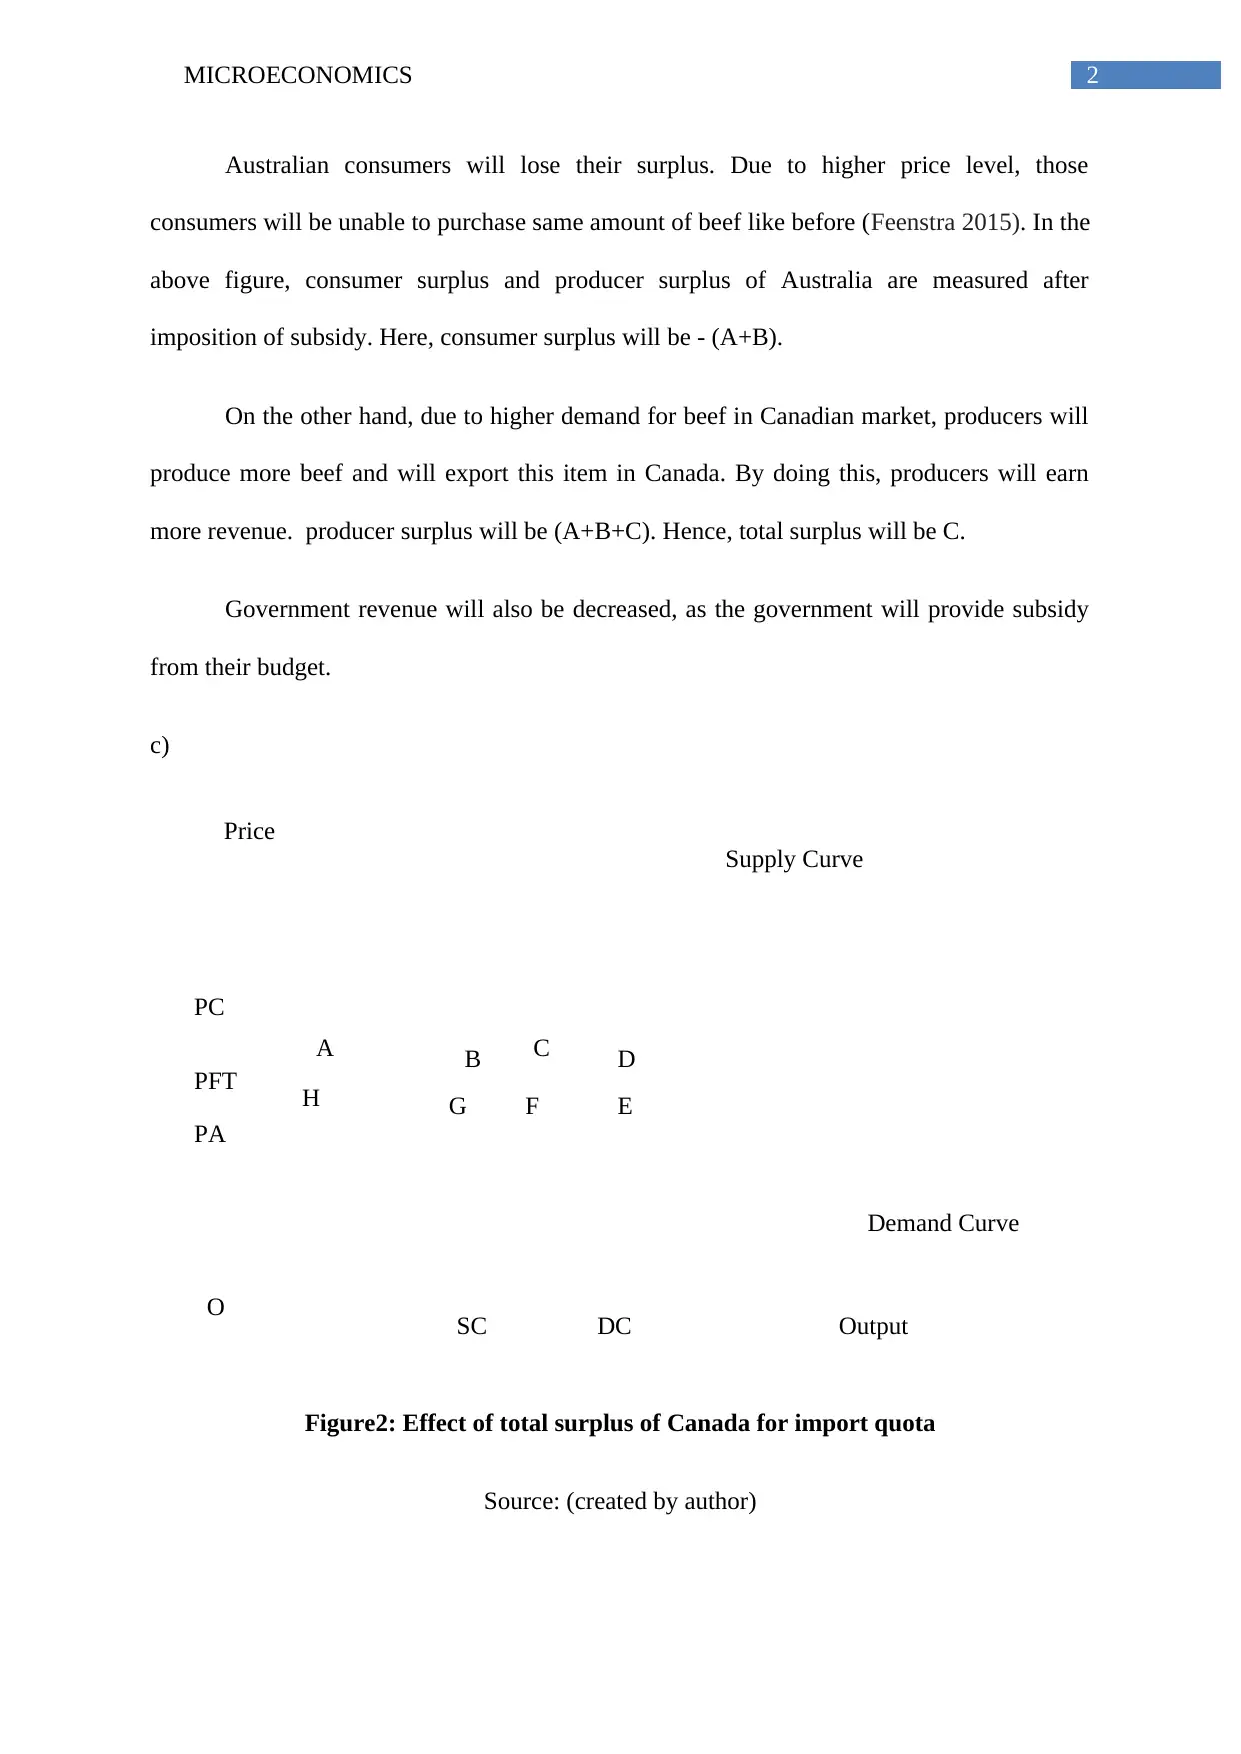
This microeconomics assignment analyzes various economic concepts and policies. It begins by examining the effects of government subsidies on beef exports, including changes in supply, demand, and consumer/producer surplus in both Australia and Canada. The assignment then explores the impact of import quotas on Canada's beef market, detailing the resulting consumer and producer surplus changes and deadweight loss. It also discusses the rationale behind trade protection, including business diversification and the infant industry argument. The assignment further delves into market equilibrium, consumer and producer surplus calculations, and the application of inverse demand and supply curves in a perfectly competitive orange market, including calculations for equilibrium price and quantity. Finally, the assignment examines the impact of taxes on the Alcopops market, analyzing the effects of inelastic demand, tax burdens, and potential government interventions to reduce alcohol consumption among teenagers. The assignment provides detailed diagrams and calculations to support its analysis, referencing relevant economic literature.
Document Page
Running head: MICROECONOMICS
Microeconomics
Name of the university
Name of the student
Author Note
tabler-icon-diamond-filled.svg

Paraphrase This Document

Need a fresh take? Get an instant paraphrase of this document with our AI Paraphraser
Document Page
1MICROECONOMICS
Demand Curve for beef Supply Curve of labourPrice of beef
OutputO
A
F G
B
E
C
G
E
D
PA
PC
PFT
DA SA
Answer1:
a) As the government of Australia is planning to impose subsidy on beef export, the
product prices and the amount of production will be changed. Due to this subsidy, beef
exporter will charge fewer prices in Canada. Hence, demand for beef will be increased over
there. Excess supply of beef will reduce the domestic supply for Australia (Erceg, Prestipino
and Raffo 2017). However, demand for beef in Australia will be same. As a result, the beef
price in domestics market will be increased.
Total beef production will be increased due to increasing demand for beef in
Canadian market. On the other hand, total quantity of beef will be increased for its less price
level than before.
b)
Figure1: Consumer surplus and producer surplus of Australia
Source: (created by author)
Document Page
2MICROECONOMICS
Supply Curve
Demand Curve
PFT
PC
PA
O
A
H G F E
DCB
SC DC
Price
Output
Australian consumers will lose their surplus. Due to higher price level, those
consumers will be unable to purchase same amount of beef like before (Feenstra 2015). In the
above figure, consumer surplus and producer surplus of Australia are measured after
imposition of subsidy. Here, consumer surplus will be - (A+B).
On the other hand, due to higher demand for beef in Canadian market, producers will
produce more beef and will export this item in Canada. By doing this, producers will earn
more revenue. producer surplus will be (A+B+C). Hence, total surplus will be C.
Government revenue will also be decreased, as the government will provide subsidy
from their budget.
c)
Figure2: Effect of total surplus of Canada for import quota
Source: (created by author)
Document Page
3MICROECONOMICS
After imposition of quota, import of beef will be restricted and as a result. Moreover,
price of beef will be higher (Erceg, Prestipino and Raffo 2017). Hence, beef consumers of
Canada will lose their surplus. From the above diagram, consumer surplus can be measured.
The amount of surplus is - (A+B+C+D).
On the other hand, beef producers of Canada will produce more beef and will sell this
in Canadian market. Hence, the amount of producer surplus will be A.
Beef importer of Canada will face lose. By implementing quota system, the
government will reduce the amount of beef import. In figure, this can be seen by (B+G)
amount. Moreover, the amount of dead-weight loss will be (D+E+G+B+C+F).
d)
Business Diversification:
The government of a country apply trade protection to increase business
diversification. Under free trade, a country generally wants to produce and export those
goods for which it has comparative advantage (Schuknecht 2017). Therefore, the country
becomes specialised for this particular product. However, it will increase an unbalance
economics structure for this country. Under trade protection a country can get enough
opportunity to diversify their economic structure.
Infant Industry Argument:
The government of a country can protect its start-up or growing up companies by
applying trade protection. Due to high level of cost structure and appropriate production
method, those companies cannot compete with their foreign competitors (Tarr 2017). By
applying trade protection, the government can protect those infant industries.
tabler-icon-diamond-filled.svg

Paraphrase This Document

Need a fresh take? Get an instant paraphrase of this document with our AI Paraphraser
Document Page
4MICROECONOMICS
Answer2:
a) Under a perfectly competitive market condition, marginal cost (MC) of a product and
its price level become equal. When quantity (Q) =2, the producer wants to supply his output
at price 30 units. However, the market for this 2 unit of output is 40 units. Hence, producer
surplus will be (40-30) = 10 units.
b)
Under the same market condition, the producer wants to sell his 3 units of output at
price 50 units. However, the market price is 60 units. Hence, the producer will also enjoy a
producer surplus by (60-50) =10 units. Hence, in both situations, the amount of producer
surplus is same.
Document Page
5MICROECONOMICS
Answer3:
Under a perfectly competitive orange market, the given demand functions is:
QD = 200 -2P (1)
The supply function of this orange market is:
QS = -10 + P (2)
Where, P= price in dollars ($) and Q= the quantity in kilograms.
a)
Inverse demand curve: Inverse demand function shows an opposite an inverse relation
between price and quantity demanded (Varian 2014 ). In this relation, price becomes
dependent variable and quantity demanded becomes independent variable.
Inverse Supply curve: Inverse supply curve also represents an inverse relation between price
and quantity supplied (Varian 2014). Like an inverse demand equation, the dependent
variable is price and independent variable is quantity.
However, to plot inverse demand and supply curve, both axes remain same like
normal demand and supply curve. On the horizontal axis, level of output demanded or
supplied is determined and on the vertical axis, price level is determined.
Document Page
6MICROECONOMICS
Output
Price
O
Inverse demand curve
Output
Price
Inverse Supply Curve
O
b)
In the below diagram, inverse demand curve is drawn based on above discussed
concept.
Figure3: Inverse Demand curve of a country
Source: (created by author)
In the below diagram, an inverse supply curve is shown.
Figure4: Inverse supply curve of a country
Source: (created by author)
tabler-icon-diamond-filled.svg

Paraphrase This Document

Need a fresh take? Get an instant paraphrase of this document with our AI Paraphraser
Document Page
7MICROECONOMICS
60
70
Inverse Supply Curve
Inverse Demand Curve
Output
Price
Consumer Surplus
Producer Surplus
100
10
O
In the following figure, equilibrium level of output and price level are determined.
Figure5: Equilibrium condition, consumer surplus and total surplus
Source: (created by author)
c)
To calculate equilibrium level of price and output, total demand function and total
supply function will be equated with each other. Given demand and supply functions are:
QD = 200 -2P… (1)
QS = -10 + P… (2)
By equilibrium condition: QD=QS
200-2P = -10 + P
2P+P= 200+10
Document Page
8MICROECONOMICS
3P=210
P=210/3
P=70
Therefore, the equilibrium price level of orange is $70.
Putting this price value in demand equation, equilibrium quantity of orange can be
obtained.
QD= 200-2*70
QD= 200-140
QD= 60
Hence, here equilibrium amount of orange is 60.
d)
At $ 70 price level, consumer will obtain 60 units of orange. However, consumer can
pay more amounts to get one unit of orange. When quantity is zero, the price level for
demanding orange will be calculated (Varian 2014). This will show the maximum amount of
price level that a consumer can willingly pay for one unit of orange.
Hence, from demand functions:
2P= 200-0
2P= 200
P=100
Document Page
9MICROECONOMICS
Now, to calculate the consumer surplus, the area formula of triangle will be required.
This formula is: 1/2 * height* base.
Consumer Surplus = 1/2 * (100-70)*60 = 30*60= 1800
Therefore, the amount of consumer surplus is 1800 unit.
On the other hand, producer surplus will also be calculated by this area formula of
triangle. When, there is no supply, a producer will want to charge $10 for his output.
Hence, from the supply function:
P = QS + 10
P= 0+10
P=10
Producer Surplus= 1/2 * (70-10)*60 = 60*60= 3600.
tabler-icon-diamond-filled.svg

Paraphrase This Document

Need a fresh take? Get an instant paraphrase of this document with our AI Paraphraser
Document Page
10MICROECONOMICS
Answer4:
a)
Being an alcoholic drink, teenagers have become addicted to Alcopops. Hence, in this
scenario, this drink is an inelastic product. Therefore, by imposing tax, the government could
not reduce it consumption level. On the other side, consumers till buy Alcopops with its
higher prices (Cao et al. 2015). As a result, total revenue of the government will be increased
by collecting increasing amount of tax from Alcopops. However, the amount of revenue was
collected 6% than predicted revenue. This is because of black market for Alcopops.
Teenagers will illegally try to consume this drink. Hence, the government cannot collect
revenues from expected sectors. Hence, as a government this result is surprising. But the
government can also predict a black market condition due to this tax system.
The effect of implementing tax on Alcopops can be seen in the below diagram. Here,
aggregate demand curve and supply curve of Alcopops are shown. As tax is imposed, the
aggregate supply curve of Alcopops will be shifted leftward. Moreover, the demand curve of
Alcopops will be steeper. After imposition of tax, the new price level will be P1. However,
consumers will try to buy Alcopops below than this price.
Document Page
11MICROECONOMICS
Price
O Output
Demand curve
Supply curve
Supply + Tax
Q1 Q0
P1
P0
Figure 8: Demand and supply effect after imposition of tax
Source: (created by author)
b) The burden will bear the huge burden of Alcopops. As it is an inelastic good,
consumer will not reduce their demand for this product. On the other hand, due to imposition
of tax, price of Alcopops has been increased (Stiglitz and Rosengard 2015). Teenagers are
buying same amount of this harmful product with higher price.
The economic outcome for this tax is efficient as it increases government revenue.
However, it cannot control Alcopops consumption.
c) Without imposing a tax, the government can take various actions to reduce alcohol
consumptions among teenagers. The government can organise various campaigns in various
schools and colleges to spread awareness and negative effects for consuming Alcopops.
Moreover, the government can organise various meetings and trainings procedures to train
teachers and family members (Chainey and Stephens 2016). Moreover, a monitoring body is
chevron_up_icon
1 out of 14
circle_padding
hide_on_mobile
zoom_out_icon
[object Object]