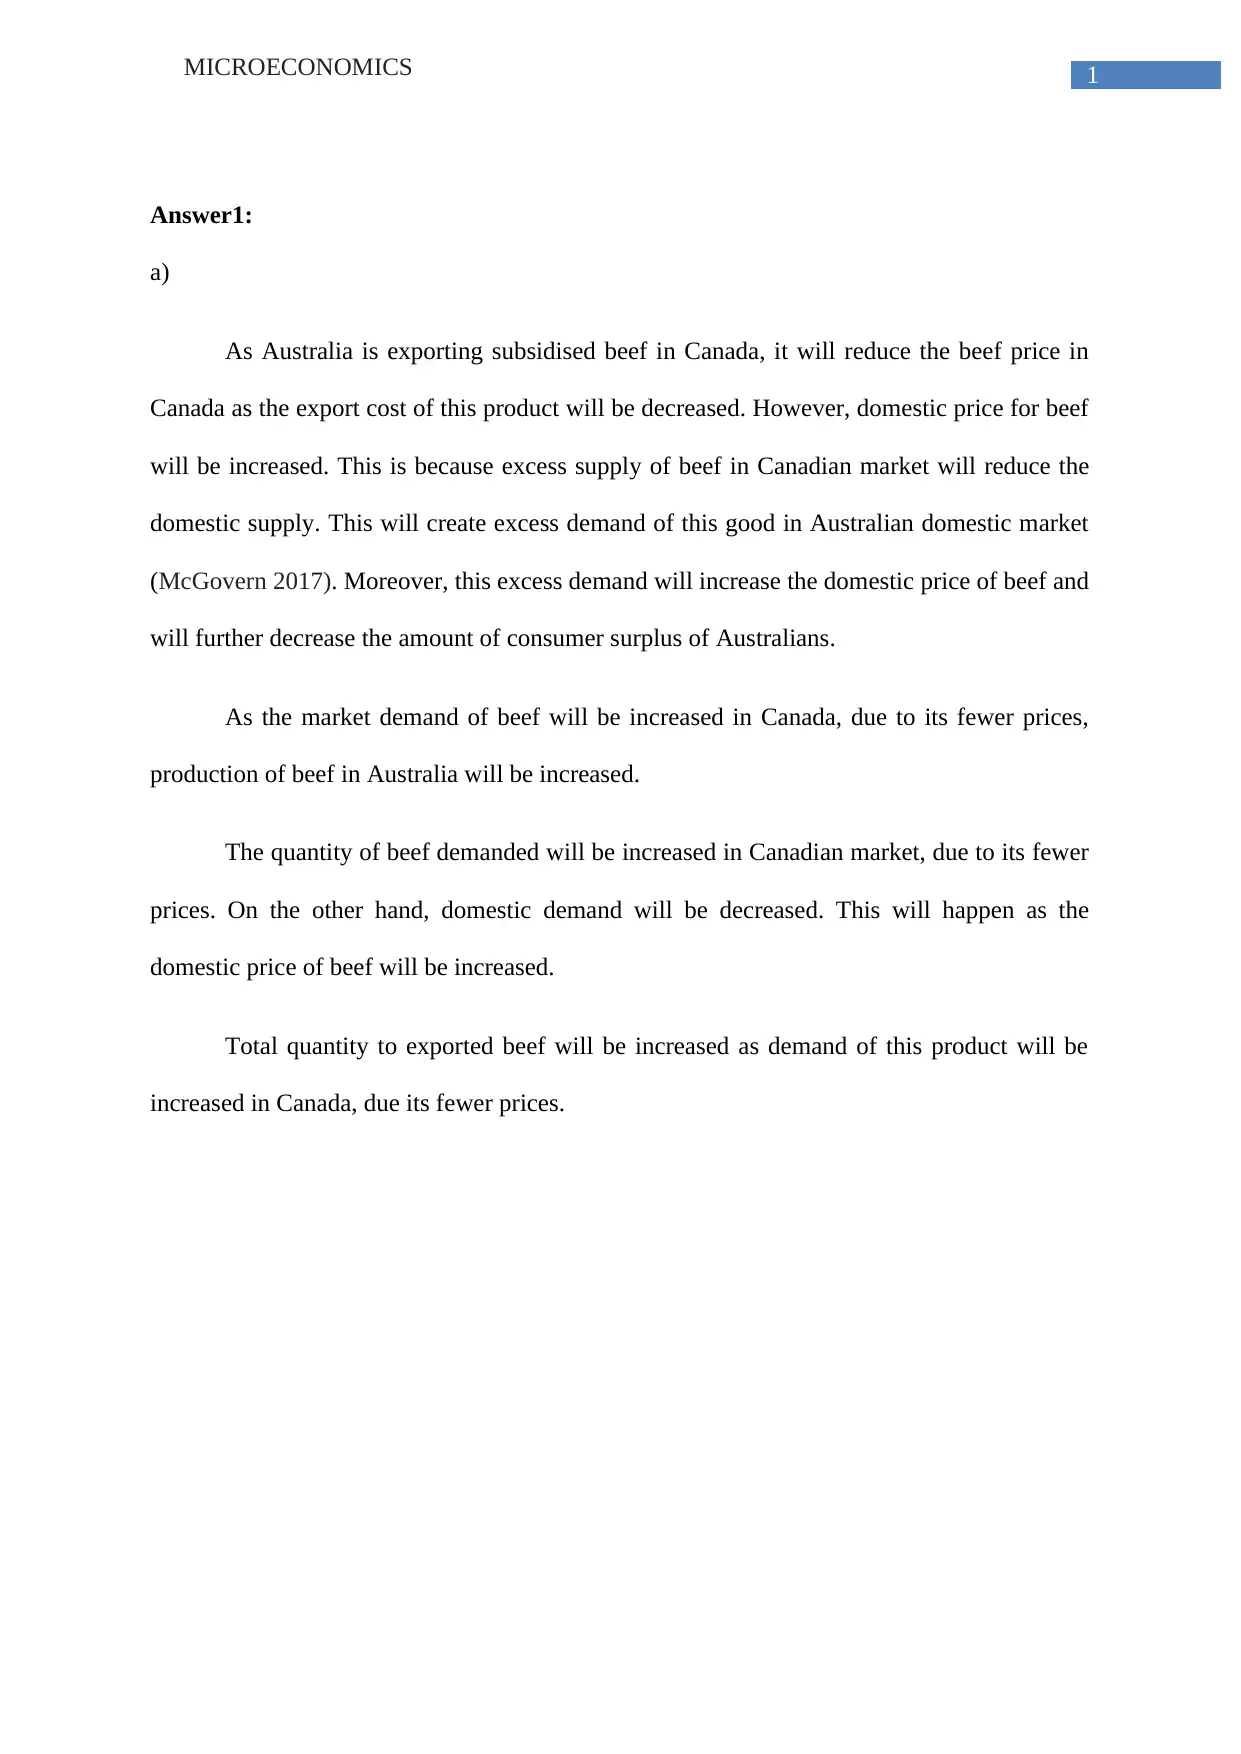
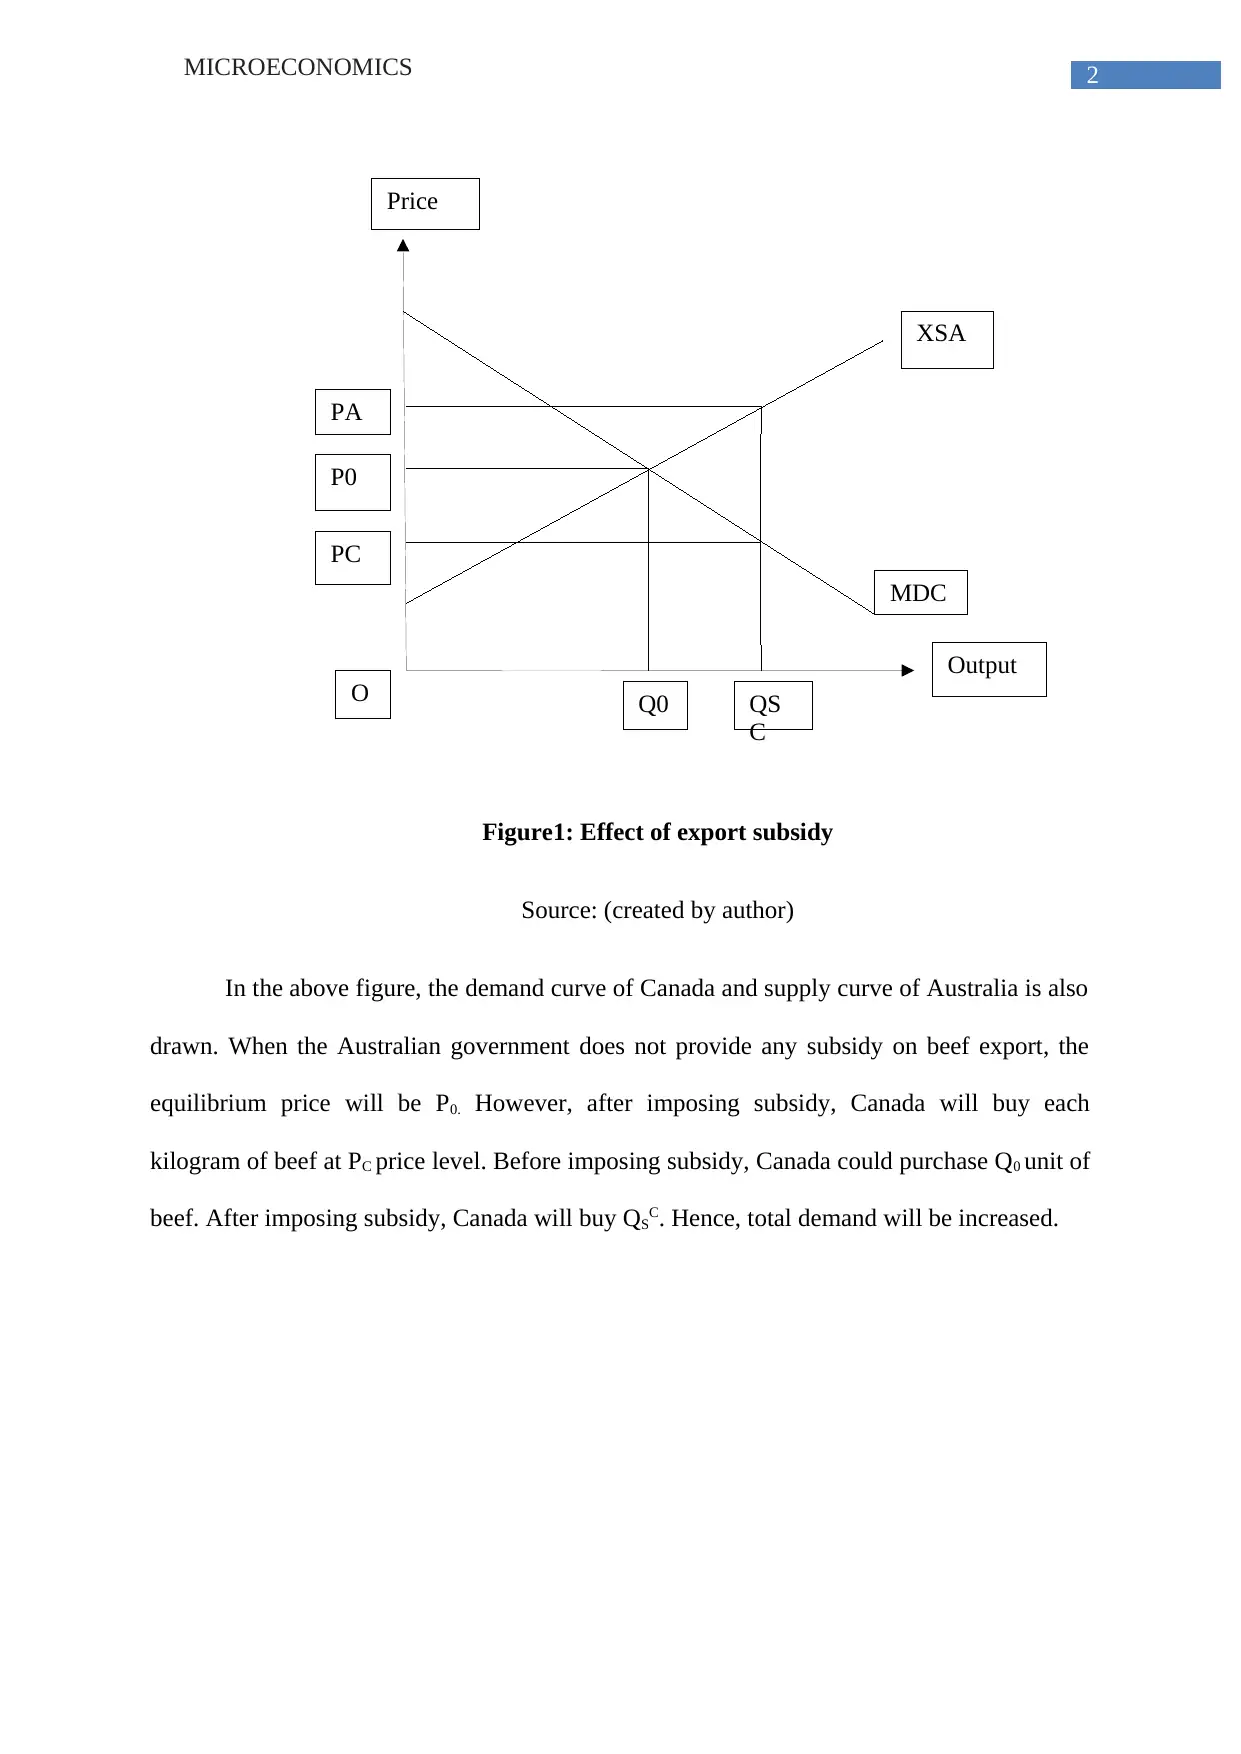
Microeconomics Assignment on Trade Protection and Market Analysis

Verified

Added on  2020/05/28

|19
|3683
|71
Homework Assignment
AI Summary
This microeconomics assignment delves into several key concepts, including the effects of export subsidies and import quotas, specifically focusing on the beef trade between Australia and Canada. It examines how subsidies impact market prices, consumer and producer surplus, and overall welfare. The assignment also explores the role of import quotas in restricting trade and their consequences on domestic and international markets. Furthermore, it discusses trade protection policies, such as the infant industry argument and business diversification, and their implications for economic development. The assignment then moves on to a numerical problem involving a competitive firm's production costs and marginal costs, analyzing producer surplus. Finally, it presents a market analysis problem, requiring the calculation of inverse demand and supply curves, equilibrium price and quantity, and consumer and producer surplus in the orange market, providing a comprehensive overview of microeconomic principles.
Document Page
Running head: MICROECONOMICS
Microeconomics
Name of the university
Name of the student
Author Note
tabler-icon-diamond-filled.svg

Paraphrase This Document

Need a fresh take? Get an instant paraphrase of this document with our AI Paraphraser
Document Page
1MICROECONOMICS
Answer1:
a)
As Australia is exporting subsidised beef in Canada, it will reduce the beef price in
Canada as the export cost of this product will be decreased. However, domestic price for beef
will be increased. This is because excess supply of beef in Canadian market will reduce the
domestic supply. This will create excess demand of this good in Australian domestic market
(McGovern 2017). Moreover, this excess demand will increase the domestic price of beef and
will further decrease the amount of consumer surplus of Australians.
As the market demand of beef will be increased in Canada, due to its fewer prices,
production of beef in Australia will be increased.
The quantity of beef demanded will be increased in Canadian market, due to its fewer
prices. On the other hand, domestic demand will be decreased. This will happen as the
domestic price of beef will be increased.
Total quantity to exported beef will be increased as demand of this product will be
increased in Canada, due its fewer prices.
Document Page
2MICROECONOMICS
Output
Price
Q0
P0
MDC
XSA
PC
PA
QS
C
O
Figure1: Effect of export subsidy
Source: (created by author)
In the above figure, the demand curve of Canada and supply curve of Australia is also
drawn. When the Australian government does not provide any subsidy on beef export, the
equilibrium price will be P0. However, after imposing subsidy, Canada will buy each
kilogram of beef at PC price level. Before imposing subsidy, Canada could purchase Q0 unit of
beef. After imposing subsidy, Canada will buy QSC. Hence, total demand will be increased.
Document Page
3MICROECONOMICS
Demand Curve
Supply Curve
Price
Output
O
A
B C
D
E
F
G
H
PA
PC
PFT
DA SA
b)
Figure2: Total surplus of Australia
Source: (created by author)
In the above diagram, supply curve and demand curve of beef in Australia is shown.
Here, PFT represents the equilibrium price level at a free trade situation. At this free trade
price level, excess demand of Canada will be equal to excess supply of Australia. However,
after imposing export subsidy, beef price of Australia will be increased. This is shown by PA
in the above diagram. Increased beef price of Canada is shown by PC.
The amount of consumer surplus for Australia will be - (A+D). It means consumer
surplus of Australian citizens will be decreased after imposition of export subsidy.
As beef price will be increased in the Australian domestic market, beef producers will
earn surplus revenue. International demand for beef will also be increased. The amount of
producer surplus will be (A+D+F).
tabler-icon-diamond-filled.svg

Paraphrase This Document

Need a fresh take? Get an instant paraphrase of this document with our AI Paraphraser
Document Page
4MICROECONOMICS
Total surplus of a county can be obtained by adding both consumer surplus and
market surplus (Roesler and Szentes 2017). Hence, total surplus will be represented by only
F, that is, (A+D+F) – (A+D) = F.
The government of Australia will pay subsidy to export beef. Government will pay
this subsidy from its budget. It will indicate a loss for this government. Hence, the
government revenue will also be in negative, that is, - (C+D+E+F+G+H).
c)
Import quotas are helping a country for restricting the amount of imported goods.
Here, Canada imposes an import quota on beef to restrict the amount that will be imported
from Australia. If the price level of beef remains same as before, it will increase the demand
for this product in Canadian market (Matusz and Tarr 2017). Due to this excess amount of
demand, price of beef will be increased. Hence, by imposing this quota, Canada will increase
the price level for this product. Moreover, it will further help domestic beef producers of
Canada to produce more output.
On the other hand, restricted beef supply in Canadian market will increase the supply
level of this product in Australia (Demir and Sepli 2017). Due to this increasing supply of
beef, price level will be decreased. This lower price level of beef will discourage beef
suppliers to produce more beef. Due this low level of beef production in Australia, export
supply will be decreased.
Document Page
5MICROECONOMICS
Supply Curve
Demand Curve
PFT
PC
PA
O
A
B C D E
FGH
SC DC
Price
Output
Figure3: Effect on import quota
Source: (created by author)
Due to imposition of quota, consumers of Canada will lose its consumer surplus
(Buongiorno, Johnston and Zhu 2017). Moreover, the price of substitute products of beef will
also be high in this country. Here, the amount of negative consumer surplus is - (A+H+G+F).
Beef producers of Canada will enjoy an increasing well-being due to this quota
system. Here the amount of producer surplus will be A.
Beef importers of Canada will face difficulties. As quota system will increase the beef
price in Canada, demand will be decreased. As a result, those importers will not import more
beefs. They will lose their import business for beef.
Document Page
6MICROECONOMICS
Dead-weight loss indicates the amount of welfare loss of a country. In Canada, dead-
weight loss will be occurring due to imposition of quota system. Here, dead-weight loss of
Canada will be (F+E+C+H+G+D).
d)
Trade protection refers a policy that the government of a country applies to protect its
domestic business environment (Schuknecht 2017). There are some governmental tools to
implement trade protections.
Infant Industry Argument:
Infant industry argument is an important concept for developing countries and for
some developed countries, as well. At the initial stage of production, the cost structure is of
this industry is high. It cannot compete with strong foreign exporters and domestic importers
(Jensen 2017). Those infant industries need more market space and consumers to develop
their business. Hence, those infant industries need more governmental support to survive.
tabler-icon-diamond-filled.svg

Paraphrase This Document

Need a fresh take? Get an instant paraphrase of this document with our AI Paraphraser
Document Page
7MICROECONOMICS
Price
Output
P0
P1
O Q0 Q1
LAC
Figure4: Cost structure of an infant industry
Source: created by author)
In the above figure, long-run cost (LAC) curve of an infant industry is shown.
Initially, this industry will produce fewer outputs with higher price level. In figure, this price
level and output level are shown by P0 and Q0, respectively. If the government of this
country imposes an infant industry policy, then those firms will produce higher quantities of
output than before. This new price level will be P1 and output level will be Q1.
Business Diversification:
Trade protection helps a country to diversify its industrial organisations. Due to
excessive specialisation, a country can face an unbalanced economic structure. The country
becomes depended on other countries. However, by implementing trade protection policy, a
country can minimise its risk level as it will reduce the level of specialisation for this country
Document Page
8MICROECONOMICS
(Packham, Papenbrock, Schwendner and Woebbeking 2017). Under this system, a country
can improve its entire business organisations and can be self-sufficient in future.
Answer2:
Quantity (Q) Marginal Cost (MC)
1 20
2 30
3 50
4 80
Table1: Production and marginal cost
a) In table1, a competitive firm’s per unit output and its marginal cost or price is shown. The
firm is willing to sell per unit of output at this price level. Hence, for 2 units of output, the
firm will charge 30 unit of price. However, for 2 units of output, market price is 40. Hence,
the firm will enjoy (40-30) = 10 units of extra revenue. These extra 10 units of price is called
producer’s surplus.
b) The producer is willing to charge 50 unit of price for 3 units of output. However, the
market price for 3 units of output is 60. Hence, the producer is getting extra (60-50) = 10
units of price. These extra 10 units of price is called producer surplus.
Answer3:
The demand function of an orange market is: QD = 200 -2P
Moreover, the supply function of this orange market is: QS = -10 + P
Where, P represents price in dollars ($) and Q represents the quantity in kilograms.
Document Page
9MICROECONOMICS
a) Inverse demand curve: Inverse demand function is an opposite function of demand
equation. Here, dependent variable is price and independent variable is quantity, which is
demanded (Sun and Nie 2015). In other words, in an inverse demand function, quantity is a
function of price.
Hence, inverse demand function is shown below.
QD = 200 -2P
QD + 2P = 200
2P= 200 – QD
P = 200/2 –QD/2
P = 100 – QD/2
Inverse Supply curve: Inverse supply function is an opposite function of exact supply
equation. Here, dependent variable is price and independent variable is quantity, which will
be supplied (Varian 2014). In other words, in an inverse supply function, quantity is a
function of price.
Inverse supply function is calculated below.
QS = -10 + P
P = QS + 10
b) There is no such graphical difference between a normal demand curve and an inverse
demand curve. For an inverse demand curve, price is measured on the vertical axis and output
is measured on the horizontal axis (Varian 2014). This inverse demand curve will also be
tabler-icon-diamond-filled.svg

Paraphrase This Document

Need a fresh take? Get an instant paraphrase of this document with our AI Paraphraser
Document Page
10MICROECONOMICS
Output
Price
O
Inverse demand curve
downward slopping to represent the negative relationship between price and output
demanded.
Figure5: Inverse Demand curve
Source: (created by author)
The supply curve for a normal supply equation and an inverse supply equation is
same. For an inverse supply curve, price is measured on the vertical axis and output is
measured on the horizontal axis. This inverse supply curve will also be upward rising with
positive slope. It will represent the positive relationship between price and output supplied.
Document Page
11MICROECONOMICS
Output
Price
Inverse Supply Curve
O
60
70
Inverse Supply Curve
Inverse Demand Curve
Output
Price
Consumer Surplus
Producer Surplus
100
10
O
Figure6: Inverse supply curve
Source: (created by author)
Equilibrium quantity of price and orange can be seen by the following diagram.
chevron_up_icon
1 out of 19
circle_padding
hide_on_mobile
zoom_out_icon
[object Object]