Server Availability Monitoring Tools: A Comparative Analysis
VerifiedAdded on 2023/01/19
|15
|2119
|62
Report
AI Summary
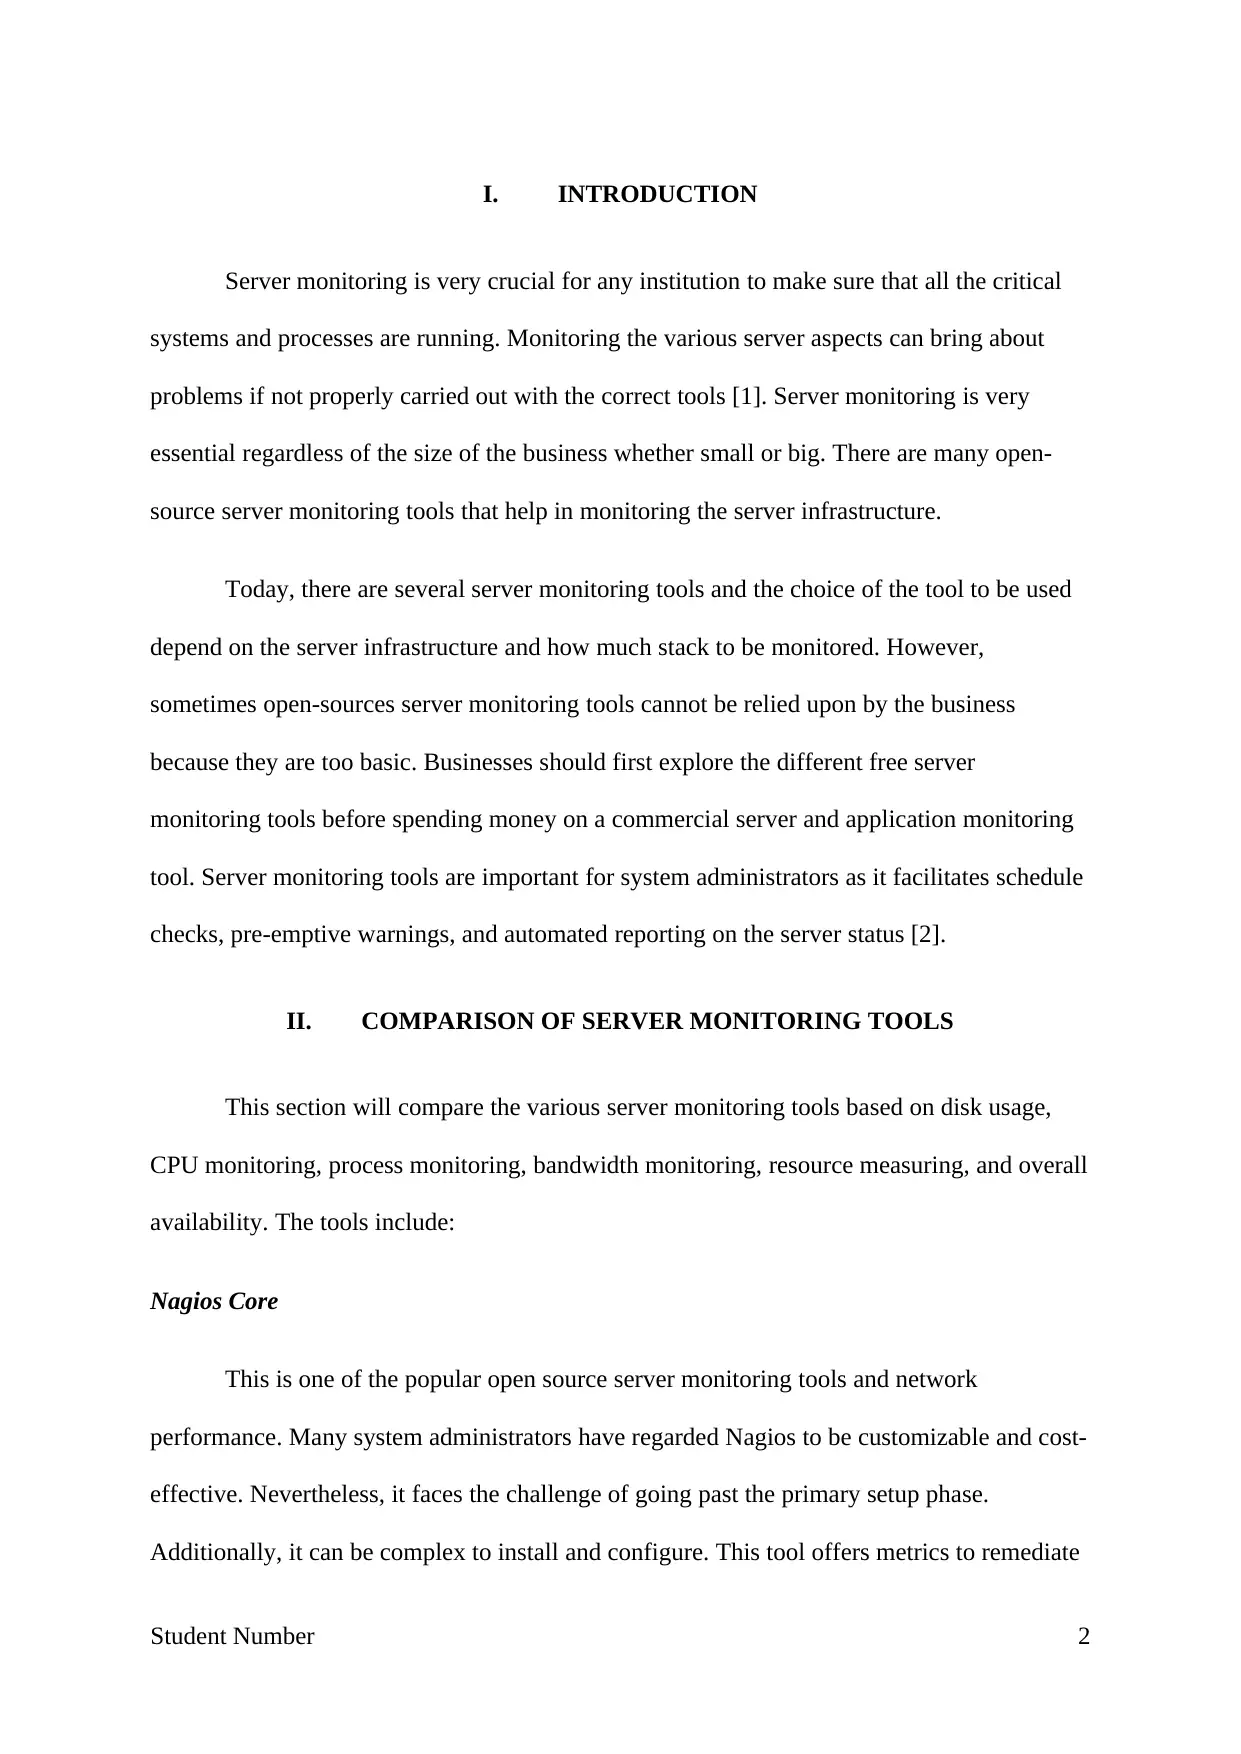
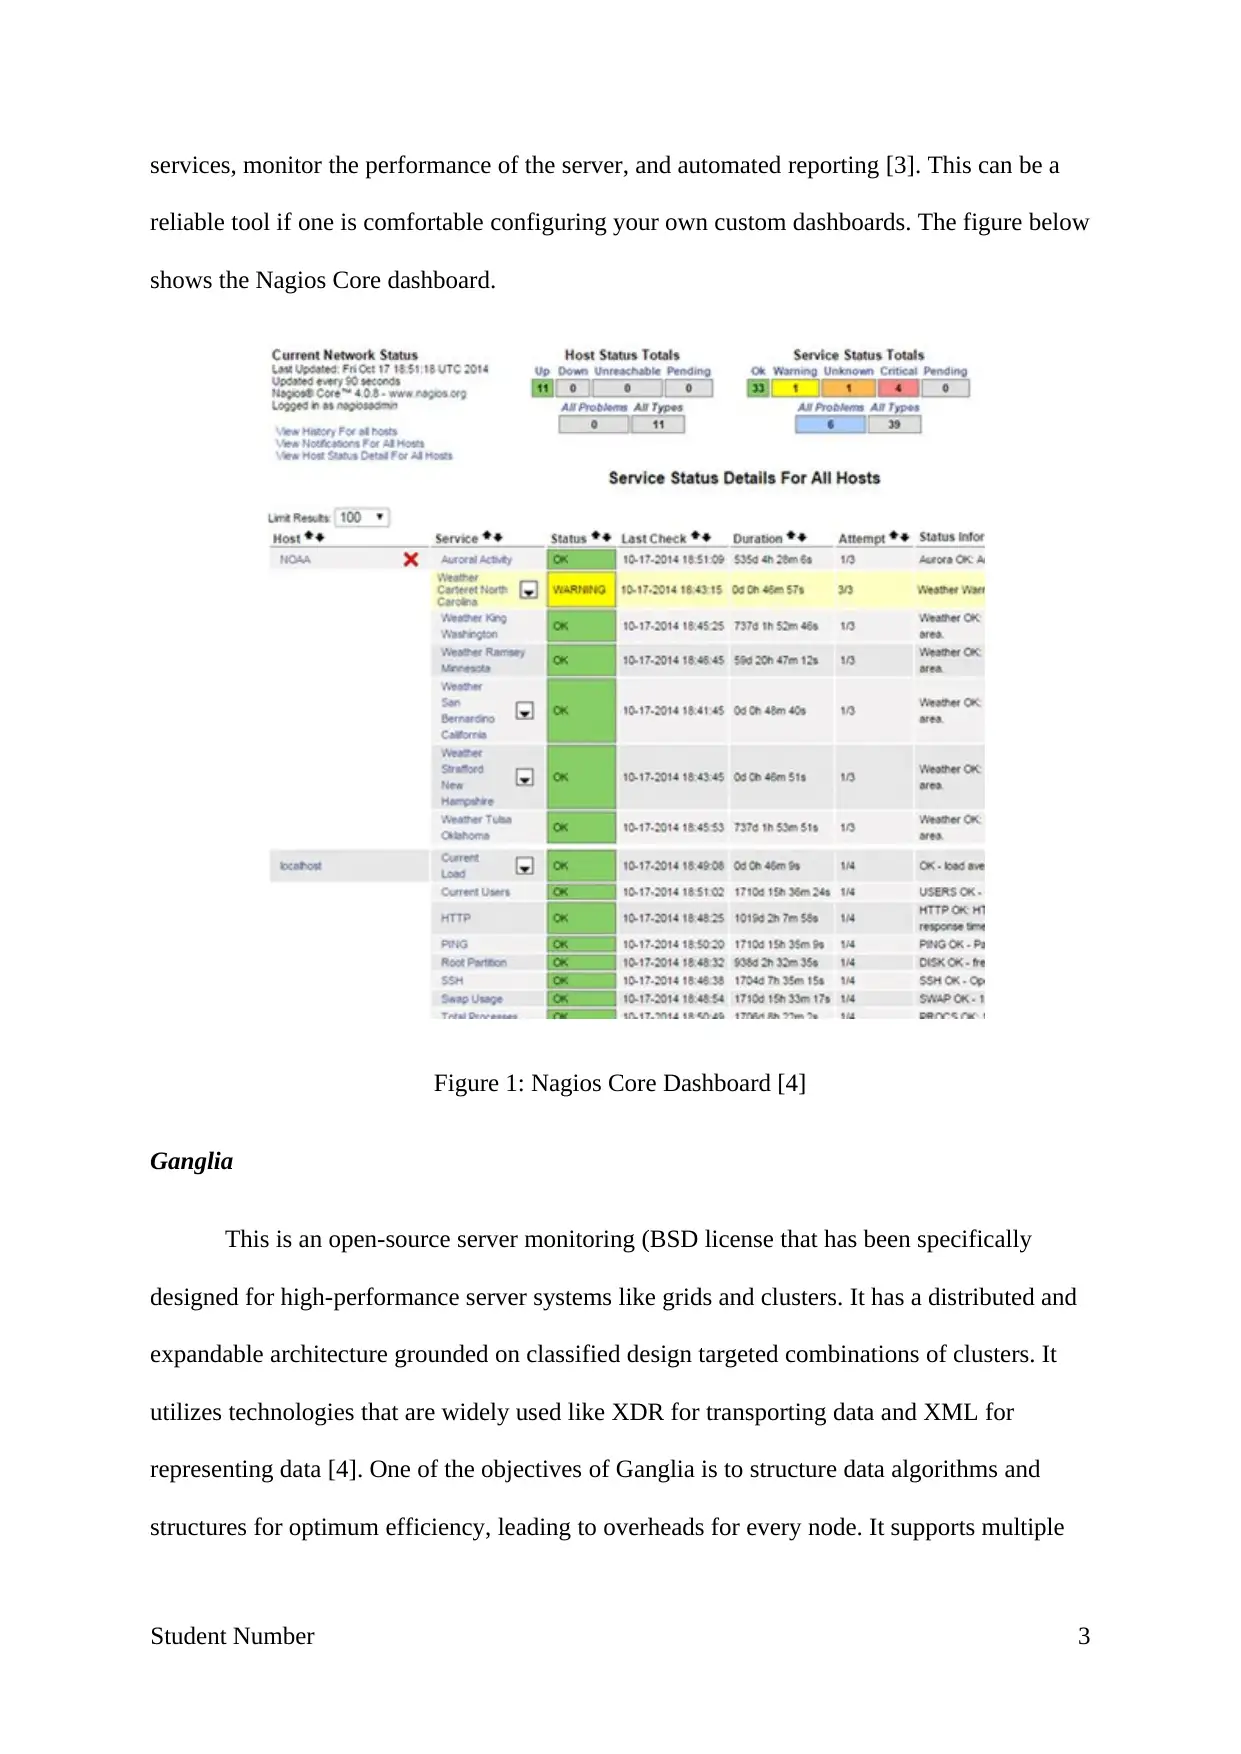
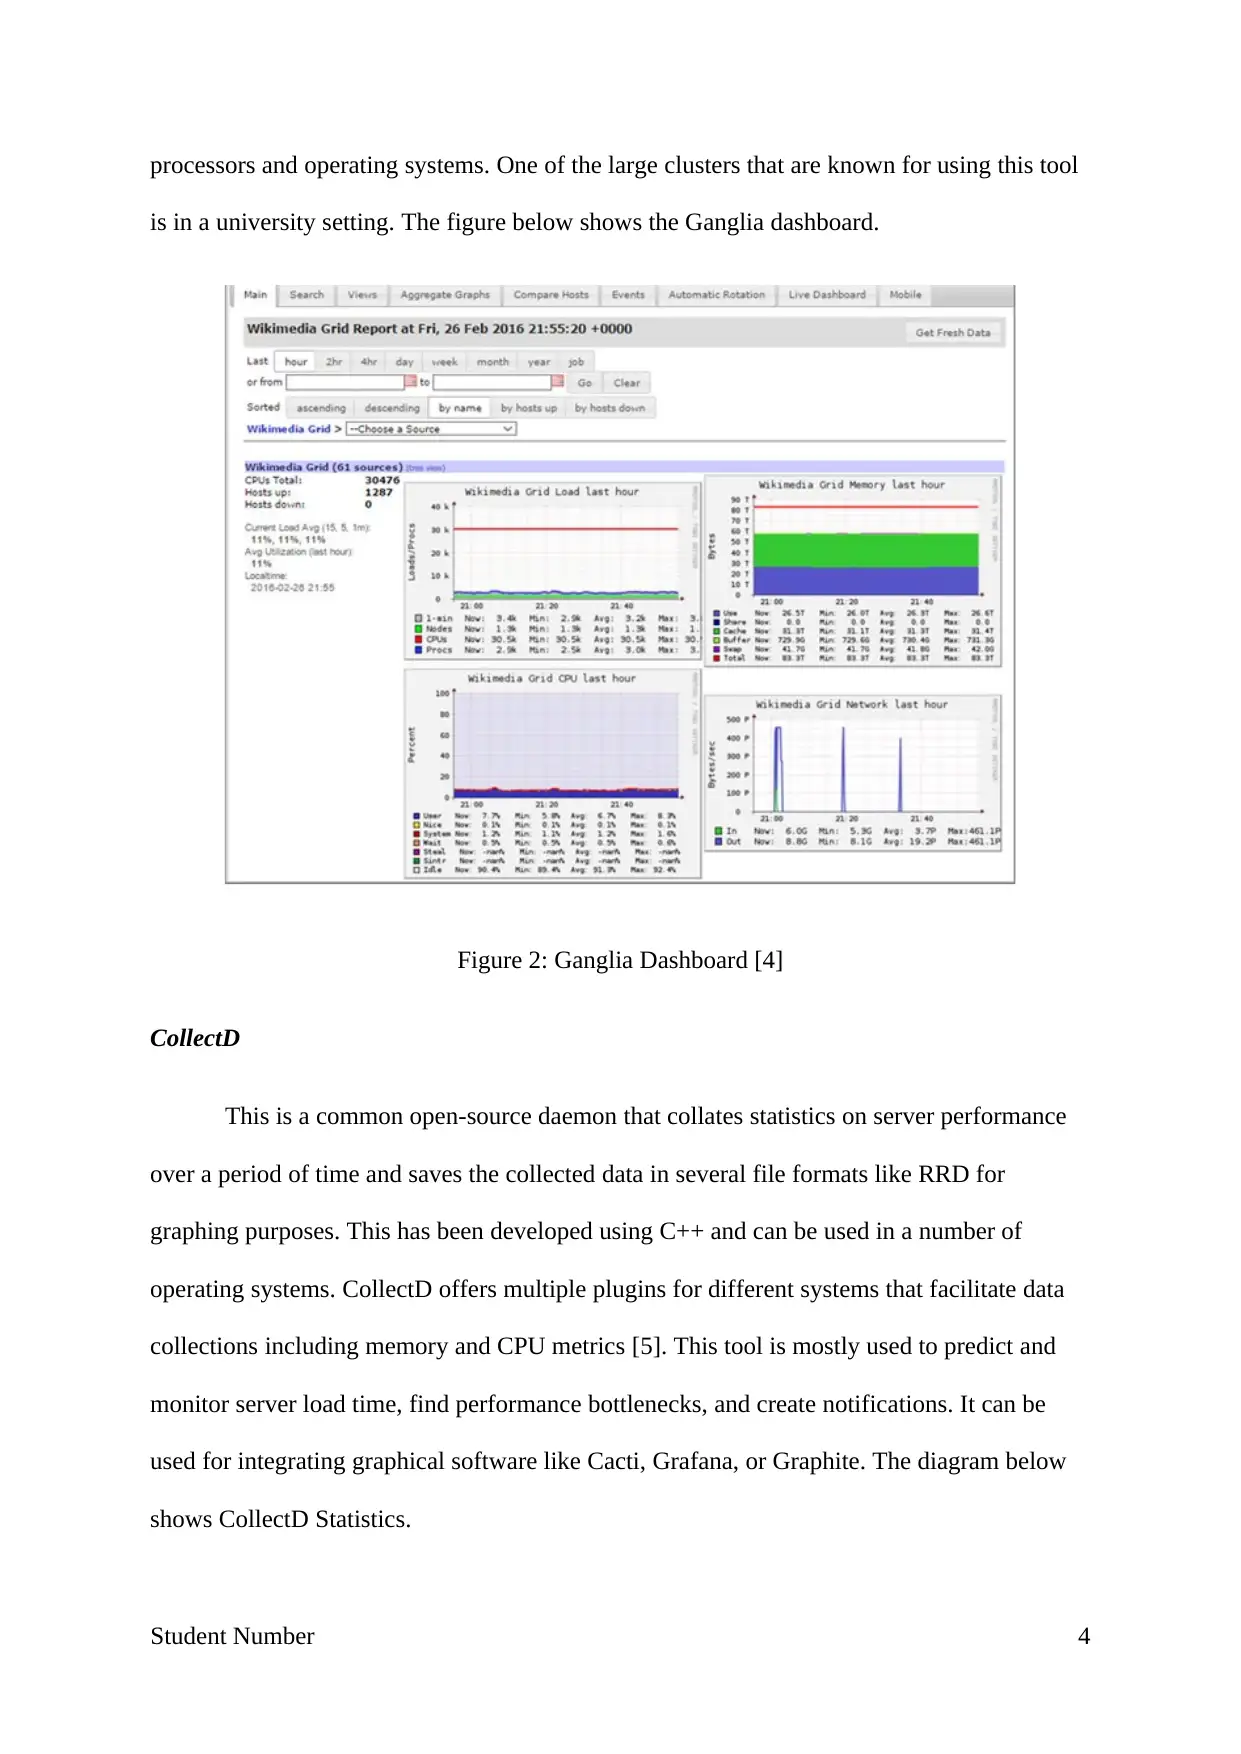
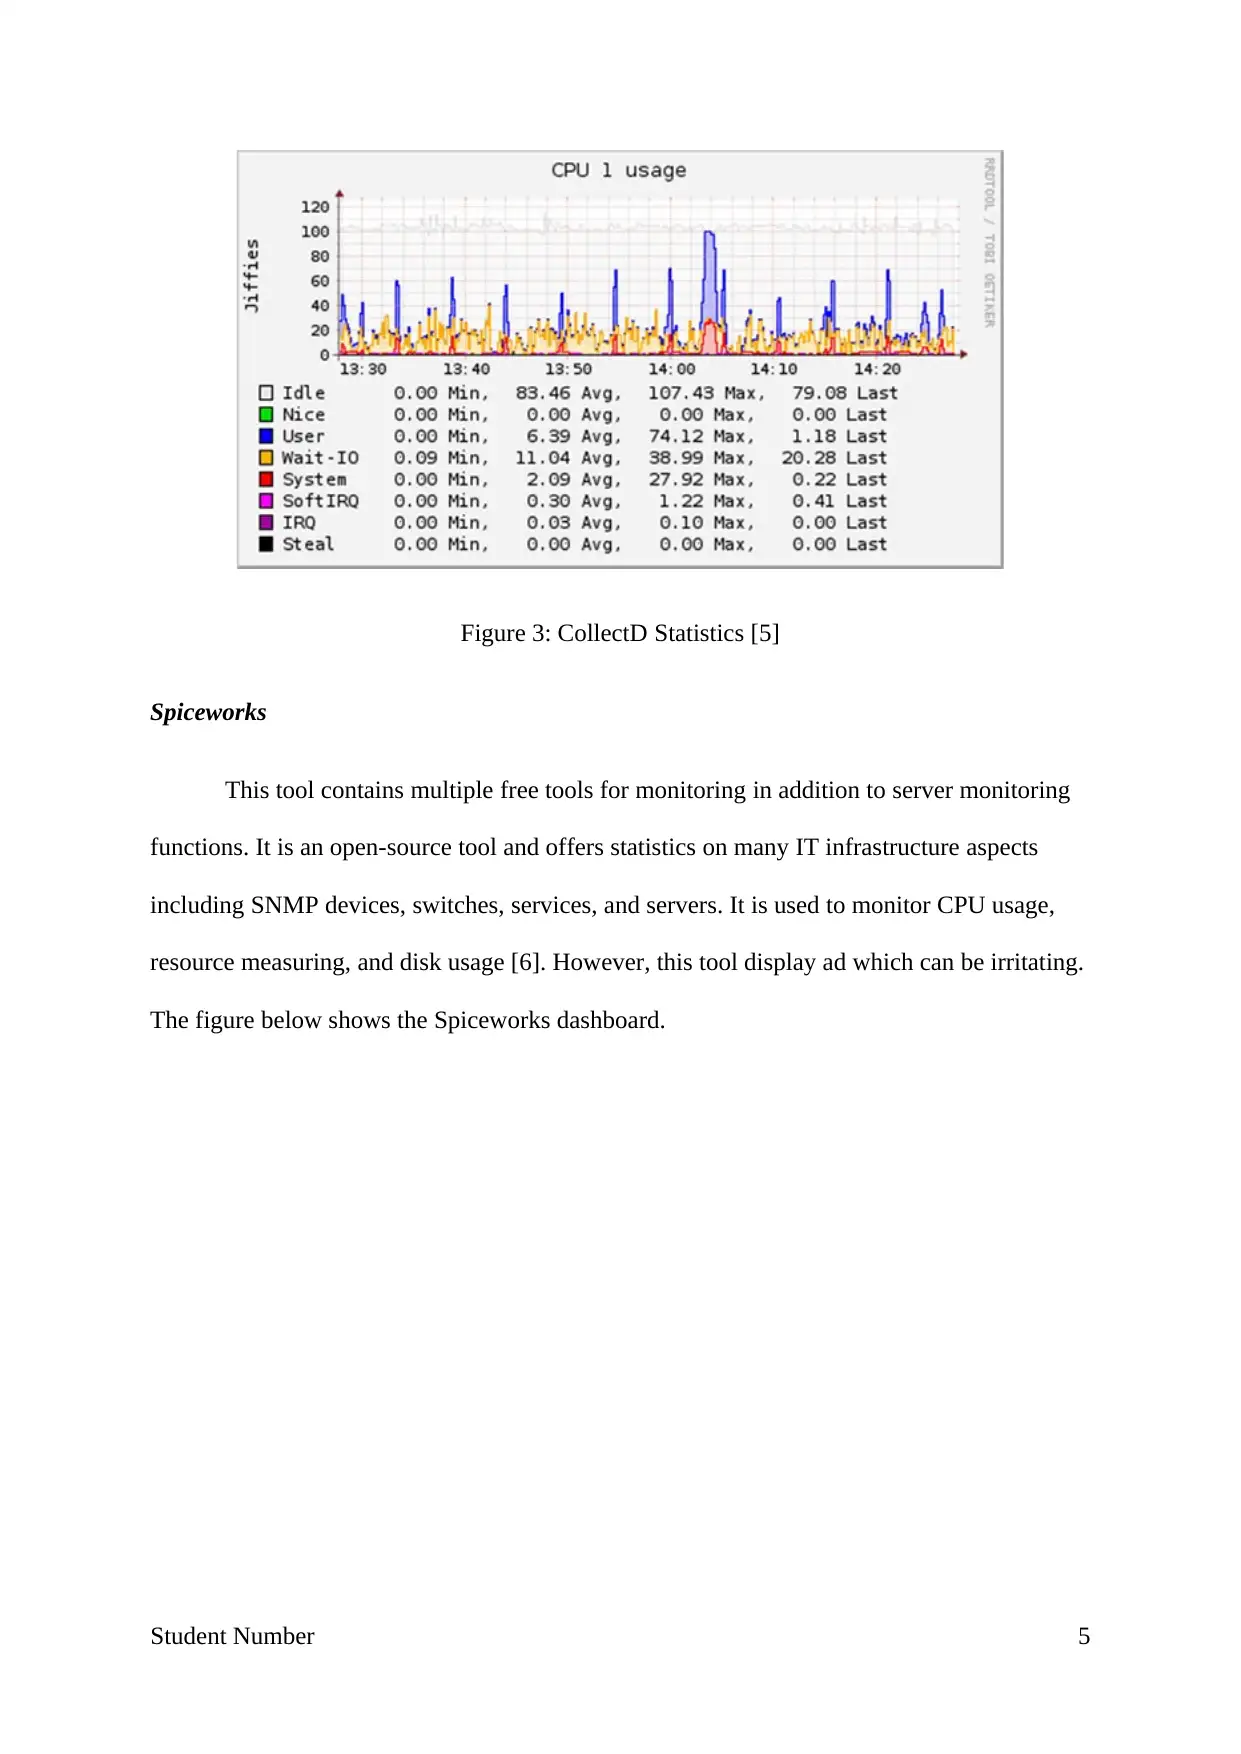
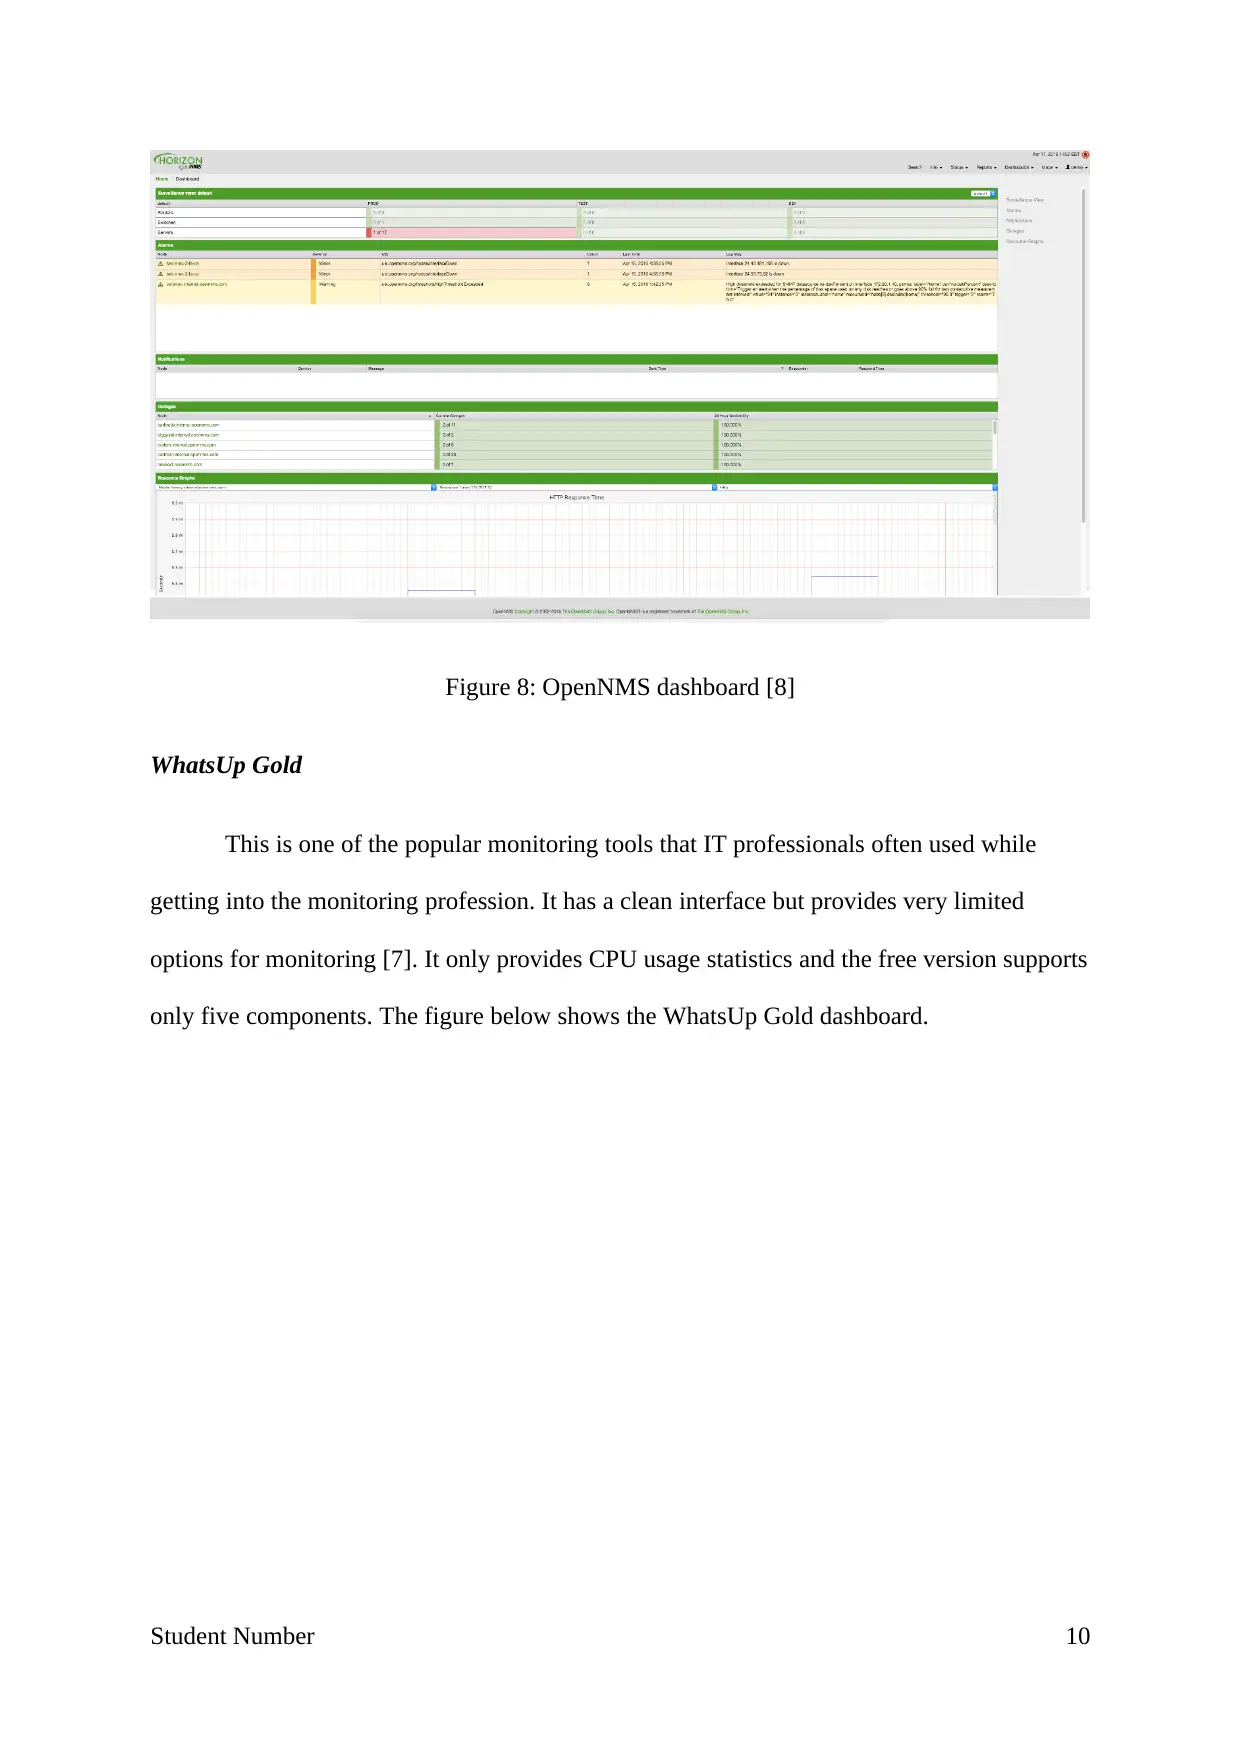
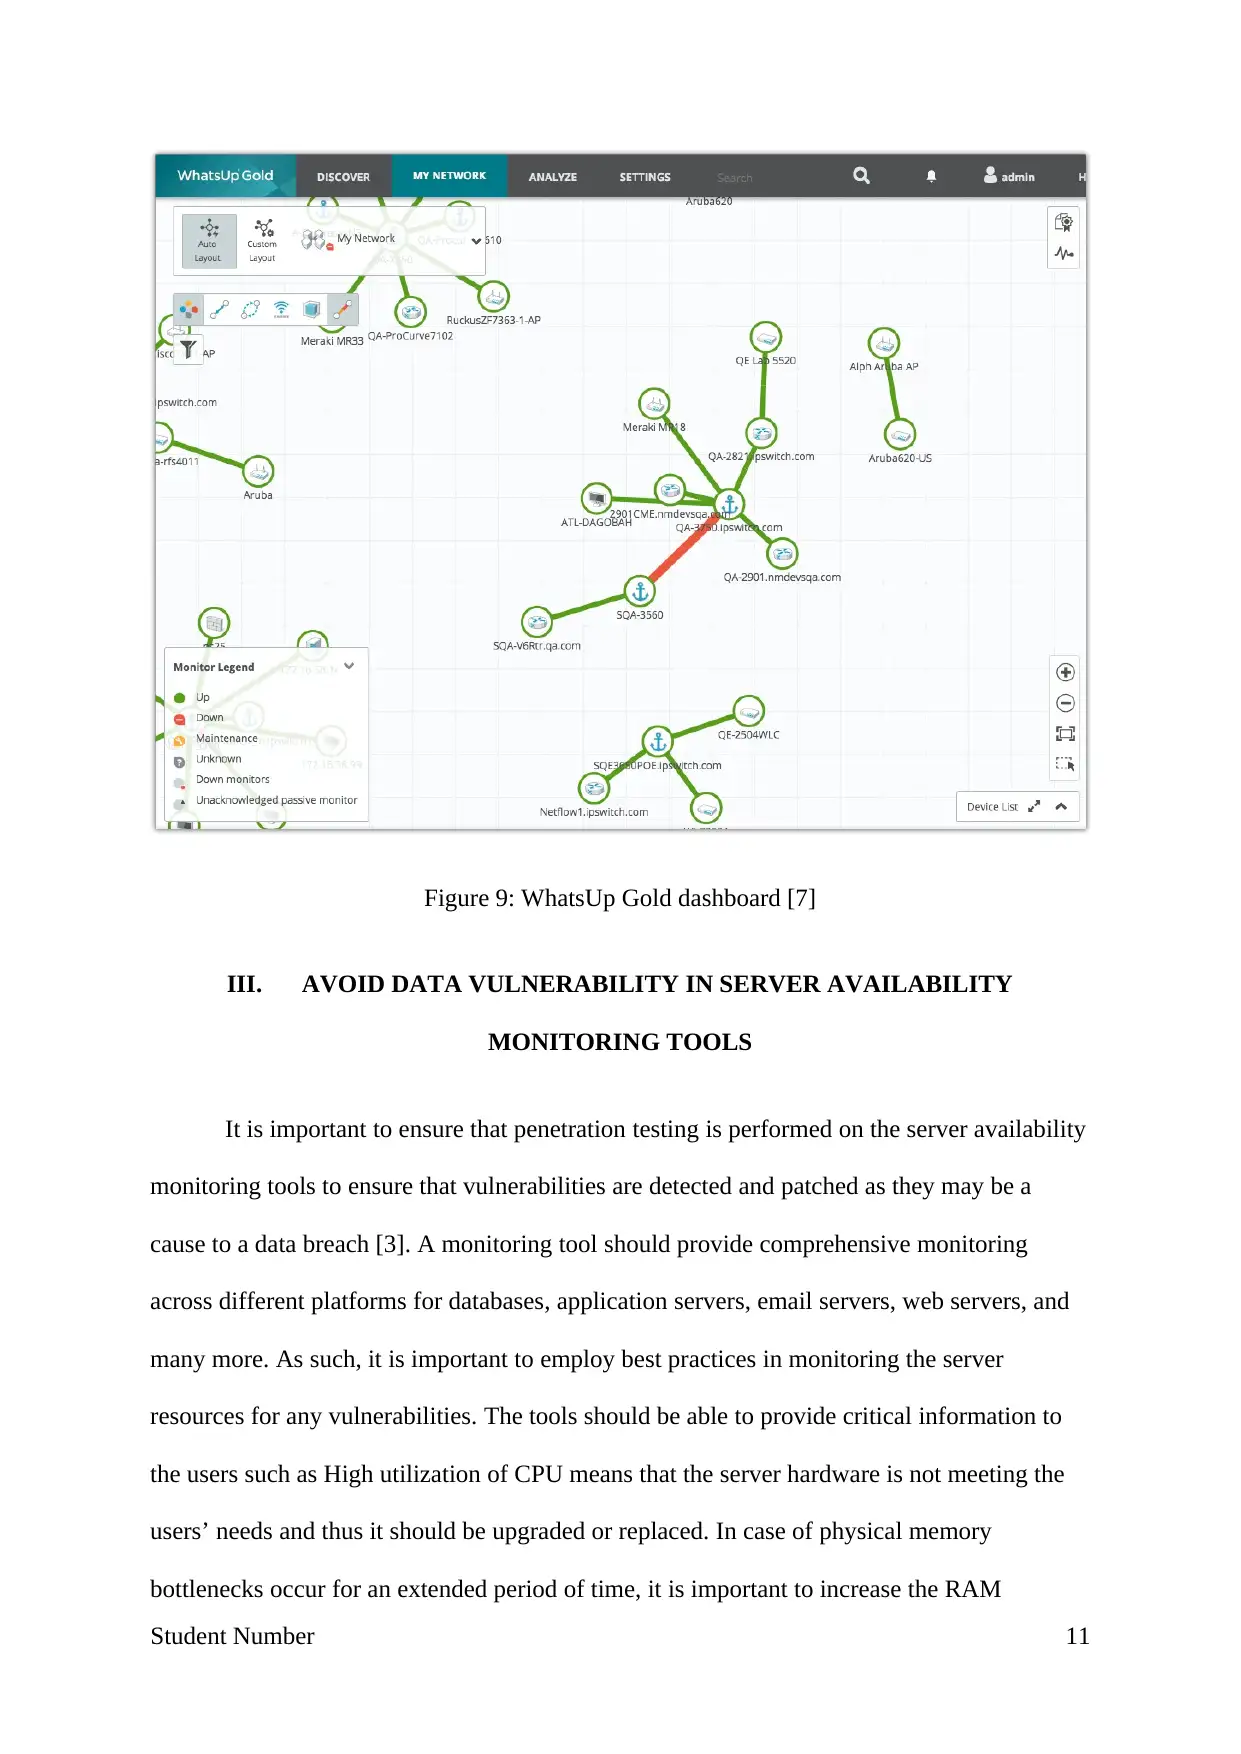
This report provides a comparative analysis of various open-source server monitoring tools. It begins with an introduction highlighting the importance of server monitoring for businesses of all sizes and the role of these tools in ensuring system availability and performance. The report then compares tools such as Nagios Core, Ganglia, CollectD, Spiceworks, Cacti, Zabbix, Icinga, OpenNMS, and WhatsUp Gold, evaluating their features based on disk usage, CPU monitoring, process monitoring, bandwidth monitoring, resource measuring, and overall availability. The report further discusses data vulnerability and the architecture of server availability monitoring, emphasizing the importance of penetration testing and comprehensive monitoring across different platforms. It also addresses the impact of failure prediction on server availability monitoring and concludes by reiterating the significance of server monitoring tools for smooth IT operations. The report includes relevant figures and references to support the analysis.

Server Monitoring tools
Name
Institutional Affiliation
Student Number 1
Name
Institutional Affiliation
Student Number 1
Secure Best Marks with AI Grader
Need help grading? Try our AI Grader for instant feedback on your assignments.

I. INTRODUCTION
Server monitoring is very crucial for any institution to make sure that all the critical
systems and processes are running. Monitoring the various server aspects can bring about
problems if not properly carried out with the correct tools [1]. Server monitoring is very
essential regardless of the size of the business whether small or big. There are many open-
source server monitoring tools that help in monitoring the server infrastructure.
Today, there are several server monitoring tools and the choice of the tool to be used
depend on the server infrastructure and how much stack to be monitored. However,
sometimes open-sources server monitoring tools cannot be relied upon by the business
because they are too basic. Businesses should first explore the different free server
monitoring tools before spending money on a commercial server and application monitoring
tool. Server monitoring tools are important for system administrators as it facilitates schedule
checks, pre-emptive warnings, and automated reporting on the server status [2].
II. COMPARISON OF SERVER MONITORING TOOLS
This section will compare the various server monitoring tools based on disk usage,
CPU monitoring, process monitoring, bandwidth monitoring, resource measuring, and overall
availability. The tools include:
Nagios Core
This is one of the popular open source server monitoring tools and network
performance. Many system administrators have regarded Nagios to be customizable and cost-
effective. Nevertheless, it faces the challenge of going past the primary setup phase.
Additionally, it can be complex to install and configure. This tool offers metrics to remediate
Student Number 2

services, monitor the performance of the server, and automated reporting [3]. This can be a
reliable tool if one is comfortable configuring your own custom dashboards. The figure below
shows the Nagios Core dashboard.
Figure 1: Nagios Core Dashboard [4]
Ganglia
This is an open-source server monitoring (BSD license that has been specifically
designed for high-performance server systems like grids and clusters. It has a distributed and
expandable architecture grounded on classified design targeted combinations of clusters. It
utilizes technologies that are widely used like XDR for transporting data and XML for
representing data [4]. One of the objectives of Ganglia is to structure data algorithms and
structures for optimum efficiency, leading to overheads for every node. It supports multiple
Student Number 3

processors and operating systems. One of the large clusters that are known for using this tool
is in a university setting. The figure below shows the Ganglia dashboard.
Figure 2: Ganglia Dashboard [4]
CollectD
This is a common open-source daemon that collates statistics on server performance
over a period of time and saves the collected data in several file formats like RRD for
graphing purposes. This has been developed using C++ and can be used in a number of
operating systems. CollectD offers multiple plugins for different systems that facilitate data
collections including memory and CPU metrics [5]. This tool is mostly used to predict and
monitor server load time, find performance bottlenecks, and create notifications. It can be
used for integrating graphical software like Cacti, Grafana, or Graphite. The diagram below
shows CollectD Statistics.
Student Number 4
Secure Best Marks with AI Grader
Need help grading? Try our AI Grader for instant feedback on your assignments.

Figure 3: CollectD Statistics [5]
Spiceworks
This tool contains multiple free tools for monitoring in addition to server monitoring
functions. It is an open-source tool and offers statistics on many IT infrastructure aspects
including SNMP devices, switches, services, and servers. It is used to monitor CPU usage,
resource measuring, and disk usage [6]. However, this tool display ad which can be irritating.
The figure below shows the Spiceworks dashboard.
Student Number 5

Figure 4: Spiceworks dashboard [6]
Cacti
This is a front-end graphical tool for server data, and can also be used for the
collection of data. It utilizes an external script to gather data in a cron job that serves metrics
to be stored in a MySQL database. Cacti make use of RRDTool which is a free data graphing
and logging tool for storing collected data and has the ability to produce any kind of graph for
any set of data [7]. It monitors how the server is utilizing, disk usage, bandwidth usage, and
overall performance. Moreover, it has the ability to monitor all types of devices. The figure
below shows the Cacti dashboard.
Student Number 6

Figure 5: Cacti dashboard [7]
Zabbix
Zabbix has been developed using PHP and is a business class solution that is equipped
fully with multiple essential features and has a version for commercial purposes. This tool
allows the administrators to monitor response time and uptime of server services and remote
services like HTTP and SMTP [6]. It also provides statistics such as network utilization, disk,
and CPU usage. Additionally, it provides other hardware statistics such as fan speed,
temperature among other aspects.
Student Number 7
Paraphrase This Document
Need a fresh take? Get an instant paraphrase of this document with our AI Paraphraser

Figure 6: Zabbix Dashboard [6]
Icinga
Initially, Icinga was developed as Nagios’ fork, but it was upgraded through the
addition of more new features as time went by. For instance, it provides a REST API and
more database connectors. This tool has the capacity to collect data on disk usage and CPU
load time across the servers and other devices like routers and switches [5]. The figure below
illustrates the Icinga dashboard.
Student Number 8

Figure 7: Icinga dashboard [5]
OpenNMS
This is an open source monitoring software that has an option for commercial support.
The free version can only support a single user login, up to 10 devices, and basic server
monitoring capabilities such as CPU load time and disk usage [8]. The figure below shows
the OpenNMS dashboard.
Student Number 9

Figure 8: OpenNMS dashboard [8]
WhatsUp Gold
This is one of the popular monitoring tools that IT professionals often used while
getting into the monitoring profession. It has a clean interface but provides very limited
options for monitoring [7]. It only provides CPU usage statistics and the free version supports
only five components. The figure below shows the WhatsUp Gold dashboard.
Student Number 10
Secure Best Marks with AI Grader
Need help grading? Try our AI Grader for instant feedback on your assignments.

Figure 9: WhatsUp Gold dashboard [7]
III. AVOID DATA VULNERABILITY IN SERVER AVAILABILITY
MONITORING TOOLS
It is important to ensure that penetration testing is performed on the server availability
monitoring tools to ensure that vulnerabilities are detected and patched as they may be a
cause to a data breach [3]. A monitoring tool should provide comprehensive monitoring
across different platforms for databases, application servers, email servers, web servers, and
many more. As such, it is important to employ best practices in monitoring the server
resources for any vulnerabilities. The tools should be able to provide critical information to
the users such as High utilization of CPU means that the server hardware is not meeting the
users’ needs and thus it should be upgraded or replaced. In case of physical memory
bottlenecks occur for an extended period of time, it is important to increase the RAM
Student Number 11

capacity [1]. The should be also comprehensive application monitoring to identify any rogue
applications that are accessing or overloading the server. Such applications may be trying to
exploit the server resources at the expense of authorized applications and users.
IV. SERVER AVAILABILITY MONITORING ARCHITECTURE
A typical server availability monitoring software has a number of components. Some
of these monitoring tools have architectures that are fully integrated, and a systems
administrator only needs to install one software to begin [4]. However, it is essential to note
that some tools may require installation of individual components that are managed
separately including analytics server, database, user console, and a polling engine.
Deployment of such architecture will affect several factors of how server availability
monitoring tools function and scale. Some tools can monitor as few as 5 devices while others
can be used to monitor thousands of devices [7]. Furthermore, a systems administrator might
identify variability when it comes to the granularity of the server monitoring tool, that is, how
frequently do the tool pool server services for metrics.
V. IMPACT OF FAILURE PREDICTION ON SERVER AVAILABILITY
MONITORING
Failure prediction of server availability monitoring could cause devastating effects.
This is because one will not be able to identify the status of the different servers and it may
lead to denial of service attacks (DoS) which can be extremely disastrous as they can cause
complete service unavailability for an extended period of time [8]. Monitoring tools provide
the systems administrators with the ability to identify and isolate such attacks before they
happened, but when the tools fail to predict it would be difficult to identify such attacks. Such
Student Number 12

risks can be avoided by having strong and reliable monitoring tools that enforces SMTP
authentication, reverse DNS, and mail relay [1].
VI. CONCLUSION
In conclusion, every business enterprise has different requirements for server
monitoring. The needs of a small business are different from the needs of a bigger company.
Nevertheless, the importance of server monitoring tools cannot be ruled out for any business
set up to ensure a smooth flow of operations that depends on IT infrastructure. The paper has
only discussed a few server monitoring tools, but there exist more tools that are more reliable
than the ones discussed in the paper.
Student Number 13
Paraphrase This Document
Need a fresh take? Get an instant paraphrase of this document with our AI Paraphraser

VII. REFERENCES
[1]J. Hernantes, G. Gallardo and N. Serrano, "IT Infrastructure-Monitoring
Tools", IEEE Software, vol. 32, no. 4, pp. 88-93, 2015. Available:
10.1109/ms.2015.96 [Accessed 19 April 2019].
[2]J. Frank and L. Belka, "Low Cost Environment Monitoring Server –
Wireshield", Proceedings of TDWG, vol. 1, p. e20427, 2017. Available:
10.3897/tdwgproceedings.1.20427.
[3]H. Yang, D. Lee and S. Yoo, "A study on stable web server system using
virtualization technology against attacks", Multimedia Tools and Applications,
vol. 74, no. 16, pp. 6381-6390, 2014. Available: 10.1007/s11042-014-2109-9.
[4]J. Cox, "Best Server Monitoring Software & Tools List for Hardware &
Performance", ITT Systems, 2019. [Online]. Available:
https://www.ittsystems.com/server-monitoring-tools/. [Accessed: 19- Apr-
2019].
[5]W. Craig, "10 Free Tools to Monitor the Health of Your Server", WebFX Blog,
2016. [Online]. Available: https://www.webfx.com/blog/web-design/free-
server-monitoring-tools/. [Accessed: 19- Apr- 2019].
[6]J. Melnick, "Top 10 Best Windows Server Monitoring Software
Tools", Blog.netwrix.com, 2018. [Online]. Available:
Student Number 14

https://blog.netwrix.com/2018/10/02/top-10-best-windows-server-monitoring-
software-tools/. [Accessed: 19- Apr- 2019].
[7]M. Wilson, "Best Server Monitoring Tools & Software for Windows and Linux
of 2019", PC & Network Downloads - PCWDLD.com, 2019. [Online].
Available: https://www.pcwdld.com/best-server-monitoring-tools-software-
windows-linux. [Accessed: 19- Apr- 2019].
[8]s. Dnsstuff, "Top FREE Server Monitoring Tools in 2019 -
DNSstuff", DNSstuff, 2019. [Online]. Available:
https://www.dnsstuff.com/free-server-monitoring-tools. [Accessed: 19- Apr-
2019].
[9]M. Vardanyan, "11 Top Server Management & Monitoring Software - Monitis
Blog", Monitis Blog, 2019. [Online]. Available:
https://www.monitis.com/blog/11-top-server-management-monitoring-
software/. [Accessed: 19- Apr- 2019].
Student Number 15
1 out of 15
Related Documents

Your All-in-One AI-Powered Toolkit for Academic Success.
+13062052269
info@desklib.com
Available 24*7 on WhatsApp / Email
Unlock your academic potential
© 2024 | Zucol Services PVT LTD | All rights reserved.