Business Decision Making Report: Murano Restaurant Data Analysis
VerifiedAdded on 2020/01/28
|25
|4293
|353
Report
AI Summary
This report provides a comprehensive analysis of business decision-making, focusing on the case of Murano restaurant. It begins by outlining a plan for collecting both primary and secondary data, including survey methodologies and questionnaire design. The report then delves into the summarization of secondary data using representative values, analyzing results to draw valid conclusions. Statistical techniques such as measures of dispersion, quartile, percentile, and correlation coefficients are employed to evaluate the restaurant's performance. Furthermore, the report demonstrates the use of spreadsheets for producing graphs and creating trend lines to assess future growth. It also covers the preparation of a PowerPoint presentation for effective information dissemination, and the creation of a formal business report. Finally, the report addresses the application of appropriate information processing tools, project planning, and the utilization of financial tools to support informed decision-making, culminating in a conclusion that synthesizes the findings and recommendations.
Business
Decision
Making
Decision
Making
Paraphrase This Document
Need a fresh take? Get an instant paraphrase of this document with our AI Paraphraser
Table of Contents
INTRODUCTION......................................................................................................................1
TASK 1......................................................................................................................................1
1.1 Developing plan for the collection of data.......................................................................1
1.2 Designing methodology for survey and determine suitable sample for the study...........2
1.3 Framing questionnaire......................................................................................................3
2.1 Summarization of secondary data by using representative values...................................6
2.2 Analyzing results for drawing valid conclusion about results.........................................7
2.3 Measures of dispersion and its use in decision making...................................................9
2.4 Assessment of quartile, percentile and correlation co-efficient.......................................9
TASK 3....................................................................................................................................10
3.1 Producing graphs by using spread sheets.......................................................................11
3.2 Creating a trend line for evaluating future growth and performance.............................11
3.3 Preparation of power point for the effectual disclosure and dissemination of
information...........................................................................................................................12
3.4 Producing a formal business report................................................................................18
4.1 Use appropriate information processing tools for decision making...............................18
4.2 Preparation of project plan and determination of critical path.......................................19
4.3 Using financial tools for decision making.....................................................................20
Conclusion of the entire report:................................................................................................22
REFERENCES.........................................................................................................................23
INTRODUCTION
In the present times, business entity has to take effectual financial and non-financial
decisions that directly aid in the growth as well as profitability aspect of firm. In this regard,
manager must have ability to make proper assessment of market trend as well as needs, wants
and expectation level of the customers. Along with this, now several statistical and financial
tools are available that can be used by managers for decision making. Hence, by making
appropriate decisionfirm can get the desired level of outcome or success. The present report
is based on Murano which provide customers with the amazing dining experience. In this, the
present report will describe the manner in which researcher can gather data for conducting
investigation. Further, report will develop understanding about the manner in which
techniques of statistics such as mean, mode and median assists in making suitable decision
through summarization. Besides this, report will also provide deeper insight about how
techniques of investment appraisal assist in making selection of suitable proposal.
TASK 1
1.1 Developing plan for the collection of data
By considering the trend of tourism in London and growth of restaurant sector
business entity of Murano has taken decision in relation to opening of restaurant. With the
motive to reduce the level of risk restaurant owner is planning to conduct research which in
turn helps in getting information about market and target market. Thus, by keeping such
aspects in mind scholar has undertaken both primary and secondary data methods are as
follows:
Primary data collection and plan: It implies for the data which is obtained by the researcher
through the means of observation, focus group, interview etc. (Ramnarayanan, Berenson and
Oppenheim, 2016). Hence, in this, researcher makes his own efforts for the collection of data
in accordance with the research issue or purpose.
Selection of method: In the first step, researcher selects type of method which he
needs to undertake for the collection of data. Hence, in this, researcher has taken
decision to collect data through the means of survey. It is the most effectual methods
⊘ This is a preview!⊘
Do you want full access?
Subscribe today to unlock all pages.
Trusted by 1+ million students worldwide
which in turn help in the collecting suitable information about the issue within the
suitable time frame.
Framing questionnaire: For survey, questionnaire is the prior requirement which
scholar has to frame for the collection of data (Siegel, 2016). Hence, in the second
stage, researcher prepares questionnaire by including both close and open ended
questions. Hence, scholar will develop questionnaire by considering the main four
aspects product, price, place and promotion.
Determination of sample size: At this stage, scholar will assess sample to conduct
survey in an effectual way. Thus, by using purposive sampling technique 20
customers of Murano.
Sending questionnaire and collection of data: Once sample has been selected
thereafter researcher will send questionnaire to the customers of Murano.
Hence, by taking into consideration all the above mentioned stages researcher would
become able to gather primary data.
Secondary data collection and planning: Data which is readily available for the research
purpose and decision making is known as secondary source (Jaggia and et.al. 2016).
Government reports, organizational studies and outcomes, journals as well as scholarly
articles are the most common means that can be undertaken by scholar for the collection of
secondary data. In this, researcher will make analysis of government report to get information
about the ratio or level of inbound and outbound tourists. This in turn also helps in assessing
the growth and customer preferences in relation to restaurant sector. Hence, researcher will
also make evaluation of the scholarly to identify the factors that havehigh level of impact on
customer decision making.
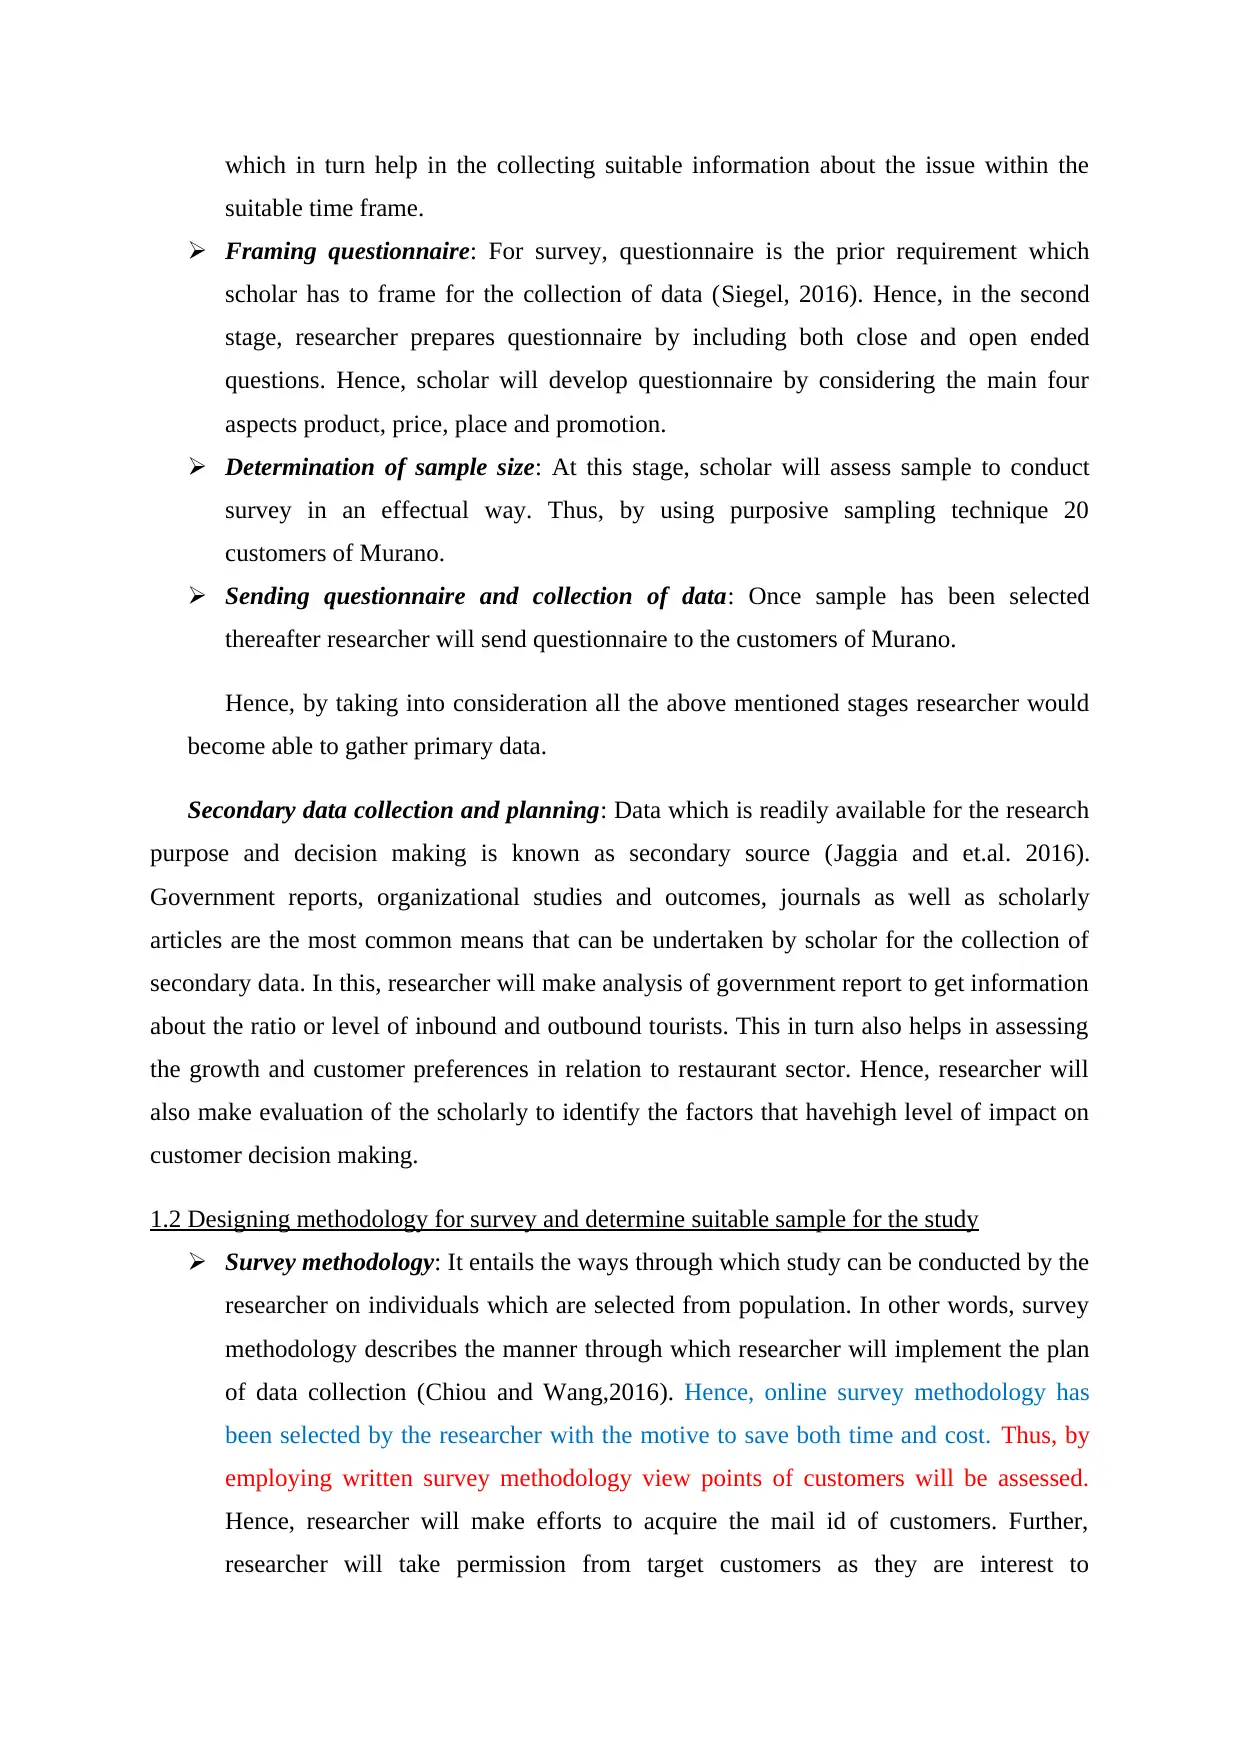
1.2 Designing methodology for survey and determine suitable sample for the study
Survey methodology: It entails the ways through which study can be conducted by the
researcher on individuals which are selected from population. In other words, survey
methodology describes the manner through which researcher will implement the plan
of data collection (Chiou and Wang,2016). Hence, online survey methodology has
been selected by the researcher with the motive to save both time and cost. Thus, by
employing written survey methodology view points of customers will be assessed.
Hence, researcher will make efforts to acquire the mail id of customers. Further,
researcher will take permission from target customers as they are interest to
suitable time frame.
Framing questionnaire: For survey, questionnaire is the prior requirement which
scholar has to frame for the collection of data (Siegel, 2016). Hence, in the second
stage, researcher prepares questionnaire by including both close and open ended
questions. Hence, scholar will develop questionnaire by considering the main four
aspects product, price, place and promotion.
Determination of sample size: At this stage, scholar will assess sample to conduct
survey in an effectual way. Thus, by using purposive sampling technique 20
customers of Murano.
Sending questionnaire and collection of data: Once sample has been selected
thereafter researcher will send questionnaire to the customers of Murano.
Hence, by taking into consideration all the above mentioned stages researcher would
become able to gather primary data.
Secondary data collection and planning: Data which is readily available for the research
purpose and decision making is known as secondary source (Jaggia and et.al. 2016).
Government reports, organizational studies and outcomes, journals as well as scholarly
articles are the most common means that can be undertaken by scholar for the collection of
secondary data. In this, researcher will make analysis of government report to get information
about the ratio or level of inbound and outbound tourists. This in turn also helps in assessing
the growth and customer preferences in relation to restaurant sector. Hence, researcher will
also make evaluation of the scholarly to identify the factors that havehigh level of impact on
customer decision making.
1.2 Designing methodology for survey and determine suitable sample for the study
Survey methodology: It entails the ways through which study can be conducted by the
researcher on individuals which are selected from population. In other words, survey
methodology describes the manner through which researcher will implement the plan
of data collection (Chiou and Wang,2016). Hence, online survey methodology has
been selected by the researcher with the motive to save both time and cost. Thus, by
employing written survey methodology view points of customers will be assessed.
Hence, researcher will make efforts to acquire the mail id of customers. Further,
researcher will take permission from target customers as they are interest to
Paraphrase This Document
Need a fresh take? Get an instant paraphrase of this document with our AI Paraphraser
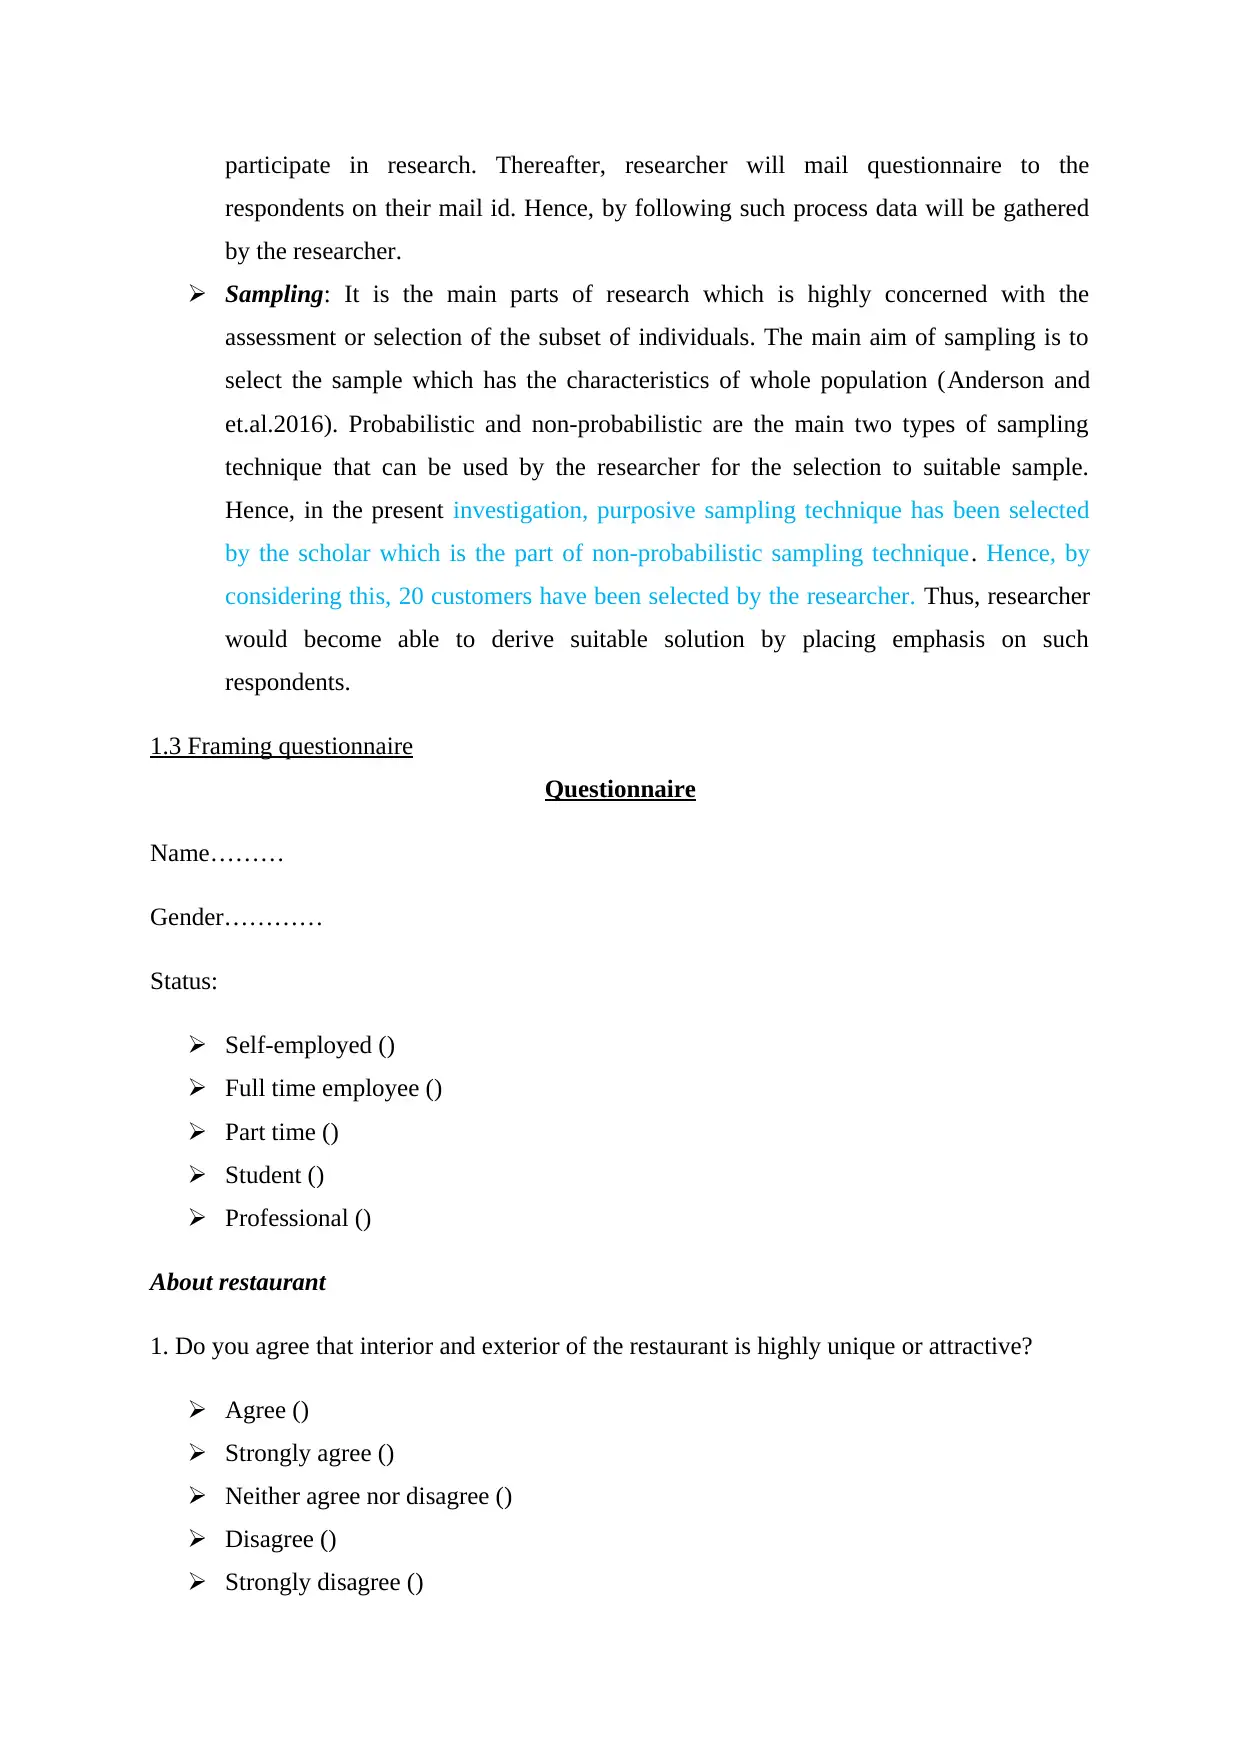
participate in research. Thereafter, researcher will mail questionnaire to the
respondents on their mail id. Hence, by following such process data will be gathered
by the researcher.
Sampling: It is the main parts of research which is highly concerned with the
assessment or selection of the subset of individuals. The main aim of sampling is to
select the sample which has the characteristics of whole population (Anderson and
et.al.2016). Probabilistic and non-probabilistic are the main two types of sampling
technique that can be used by the researcher for the selection to suitable sample.
Hence, in the present investigation, purposive sampling technique has been selected
by the scholar which is the part of non-probabilistic sampling technique. Hence, by
considering this, 20 customers have been selected by the researcher. Thus, researcher
would become able to derive suitable solution by placing emphasis on such
respondents.
1.3 Framing questionnaire
Questionnaire
Name………
Gender…………
Status:
Self-employed ()
Full time employee ()
Part time ()
Student ()
Professional ()
About restaurant
1. Do you agree that interior and exterior of the restaurant is highly unique or attractive?
Agree ()
Strongly agree ()
Neither agree nor disagree ()
Disagree ()
Strongly disagree ()
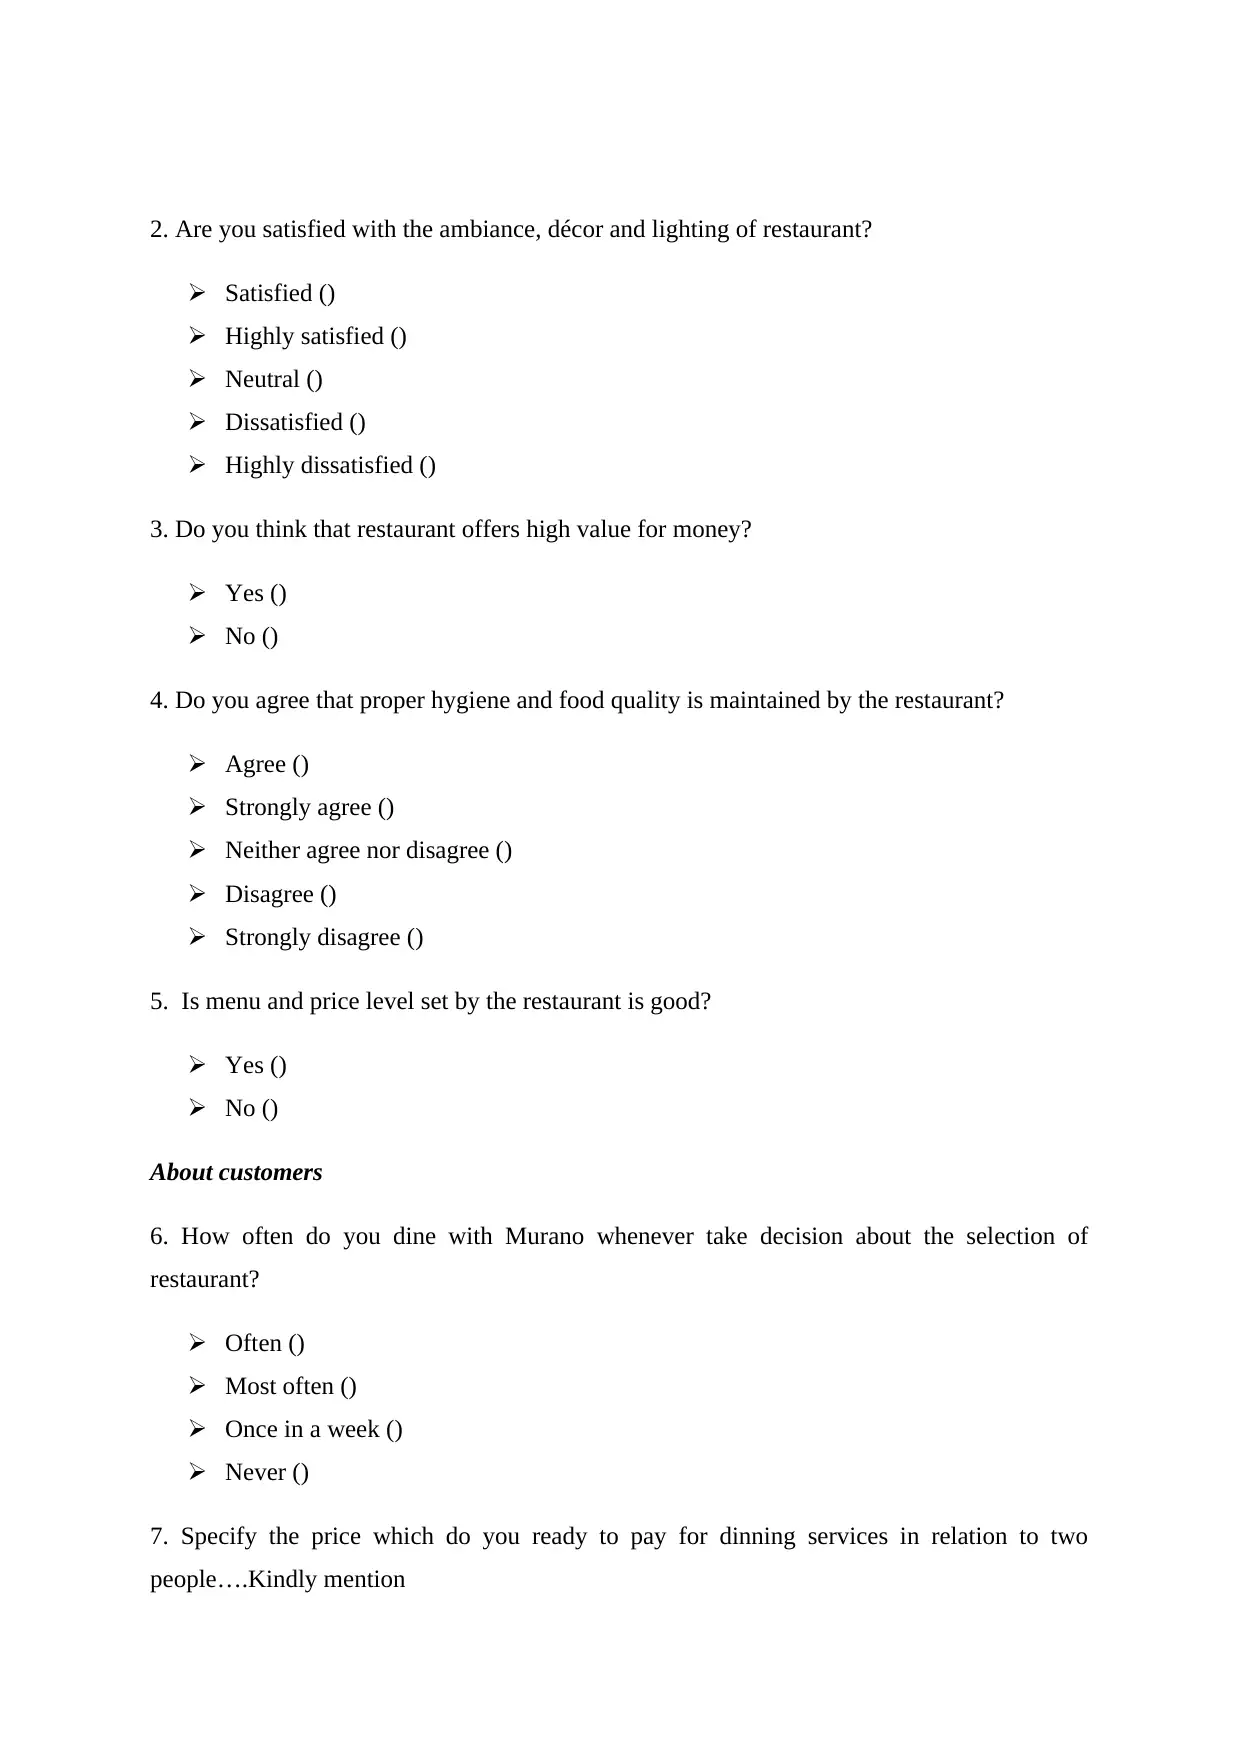
2. Are you satisfied with the ambiance, décor and lighting of restaurant?
Satisfied ()
Highly satisfied ()
Neutral ()
Dissatisfied ()
Highly dissatisfied ()
3. Do you think that restaurant offers high value for money?
Yes ()
No ()
4. Do you agree that proper hygiene and food quality is maintained by the restaurant?
Agree ()
Strongly agree ()
Neither agree nor disagree ()
Disagree ()
Strongly disagree ()
5. Is menu and price level set by the restaurant is good?
Yes ()
No ()
About customers
6. How often do you dine with Murano whenever take decision about the selection of
restaurant?
Often ()
Most often ()
Once in a week ()
Never ()
7. Specify the price which do you ready to pay for dinning services in relation to two
people….Kindly mention
⊘ This is a preview!⊘
Do you want full access?
Subscribe today to unlock all pages.
Trusted by 1+ million students worldwide

8. From the below mentioned elements quality of services and food quality fall in which
category?
Excellent ()
Better ()
Good ()
Average ()
9. How do you get information about the dinning services of Murano?
Television ()
Newspaper ()
Social networking sites ()
Friends ()
Family members ()
10. Do you agree that waiting time has high level of impact on your satisfaction and loyalty
aspect?
Yes ()
No ()
11. Would you prefer to visit restaurant again in the near future?
Yes ()
No ()
About personnel
Kindly state your level of agreement with the below mentioned statements
Particulars Agree Strongly
agree
Neutral Disagree Strongly
disagree
Personnel of
restaurant
are highly
skilled and
efficient
They
Paraphrase This Document
Need a fresh take? Get an instant paraphrase of this document with our AI Paraphraser
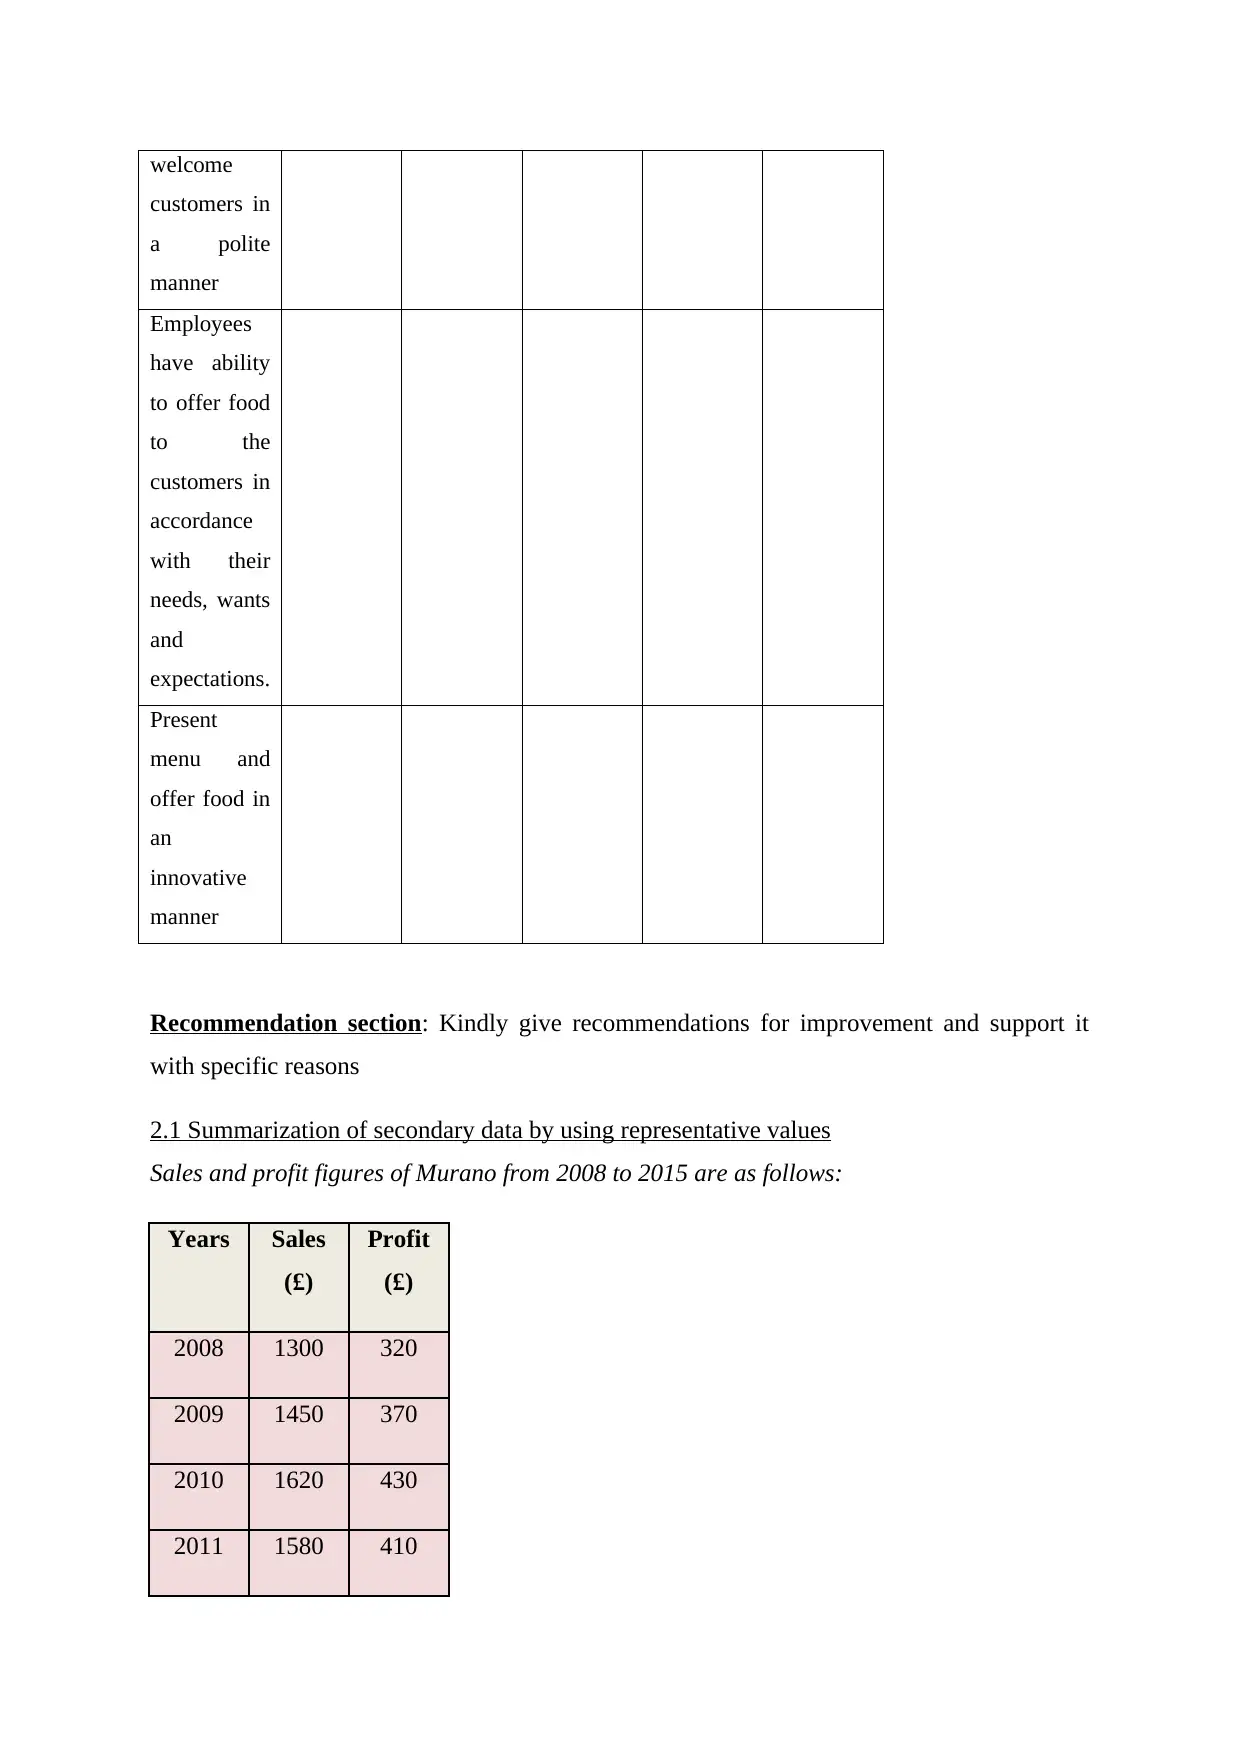
welcome
customers in
a polite
manner
Employees
have ability
to offer food
to the
customers in
accordance
with their
needs, wants
and
expectations.
Present
menu and
offer food in
an
innovative
manner
Recommendation section: Kindly give recommendations for improvement and support it
with specific reasons
2.1 Summarization of secondary data by using representative values
Sales and profit figures of Murano from 2008 to 2015 are as follows:
Years Sales
(£)
Profit
(£)
2008 1300 320
2009 1450 370
2010 1620 430
2011 1580 410
customers in
a polite
manner
Employees
have ability
to offer food
to the
customers in
accordance
with their
needs, wants
and
expectations.
Present
menu and
offer food in
an
innovative
manner
Recommendation section: Kindly give recommendations for improvement and support it
with specific reasons
2.1 Summarization of secondary data by using representative values
Sales and profit figures of Murano from 2008 to 2015 are as follows:
Years Sales
(£)
Profit
(£)
2008 1300 320
2009 1450 370
2010 1620 430
2011 1580 410
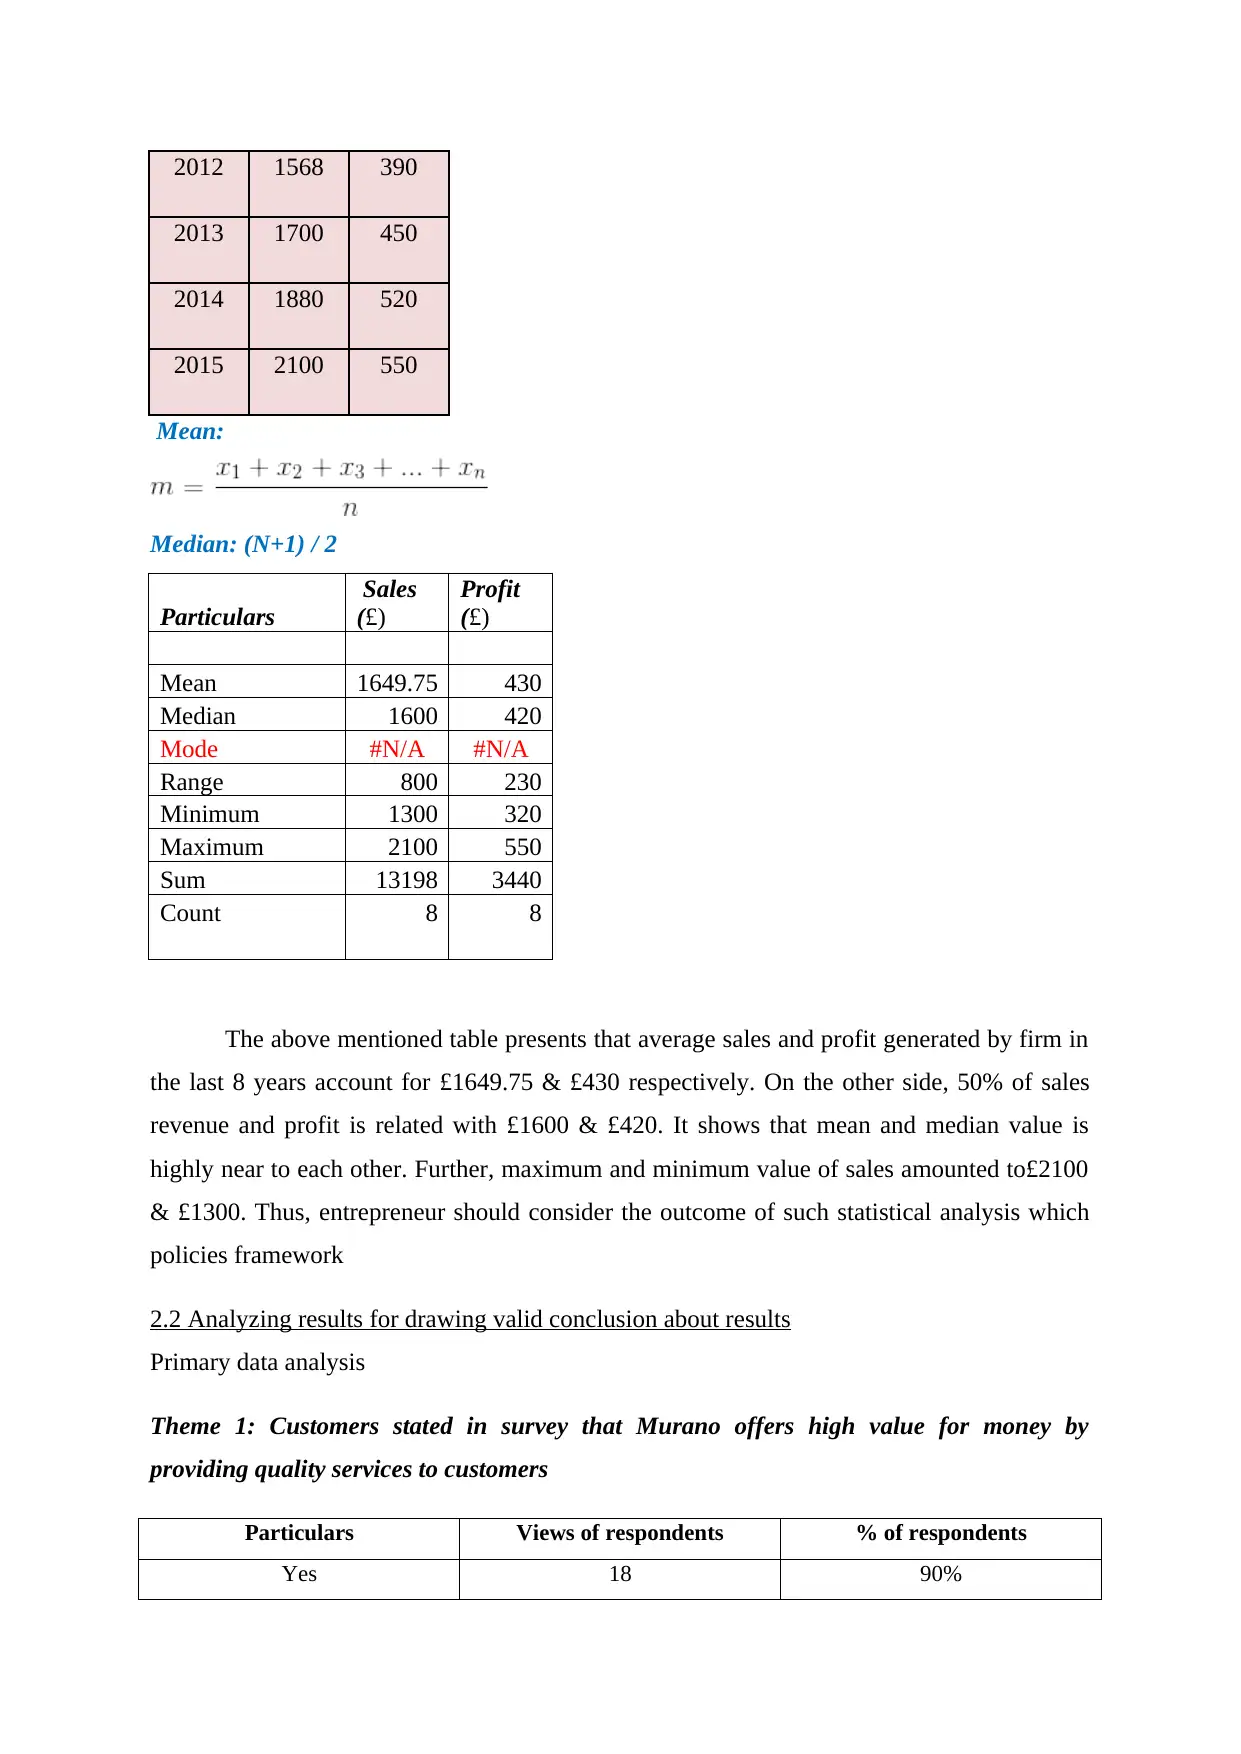
2012 1568 390
2013 1700 450
2014 1880 520
2015 2100 550
Mean:
Median: (N+1) / 2
Particulars
Sales
(£)
Profit
(£)
Mean 1649.75 430
Median 1600 420
Mode #N/A #N/A
Range 800 230
Minimum 1300 320
Maximum 2100 550
Sum 13198 3440
Count 8 8
The above mentioned table presents that average sales and profit generated by firm in
the last 8 years account for £1649.75 & £430 respectively. On the other side, 50% of sales
revenue and profit is related with £1600 & £420. It shows that mean and median value is
highly near to each other. Further, maximum and minimum value of sales amounted to£2100
& £1300. Thus, entrepreneur should consider the outcome of such statistical analysis which
policies framework
2.2 Analyzing results for drawing valid conclusion about results
Primary data analysis
Theme 1: Customers stated in survey that Murano offers high value for money by
providing quality services to customers
Particulars Views of respondents % of respondents
Yes 18 90%
⊘ This is a preview!⊘
Do you want full access?
Subscribe today to unlock all pages.
Trusted by 1+ million students worldwide
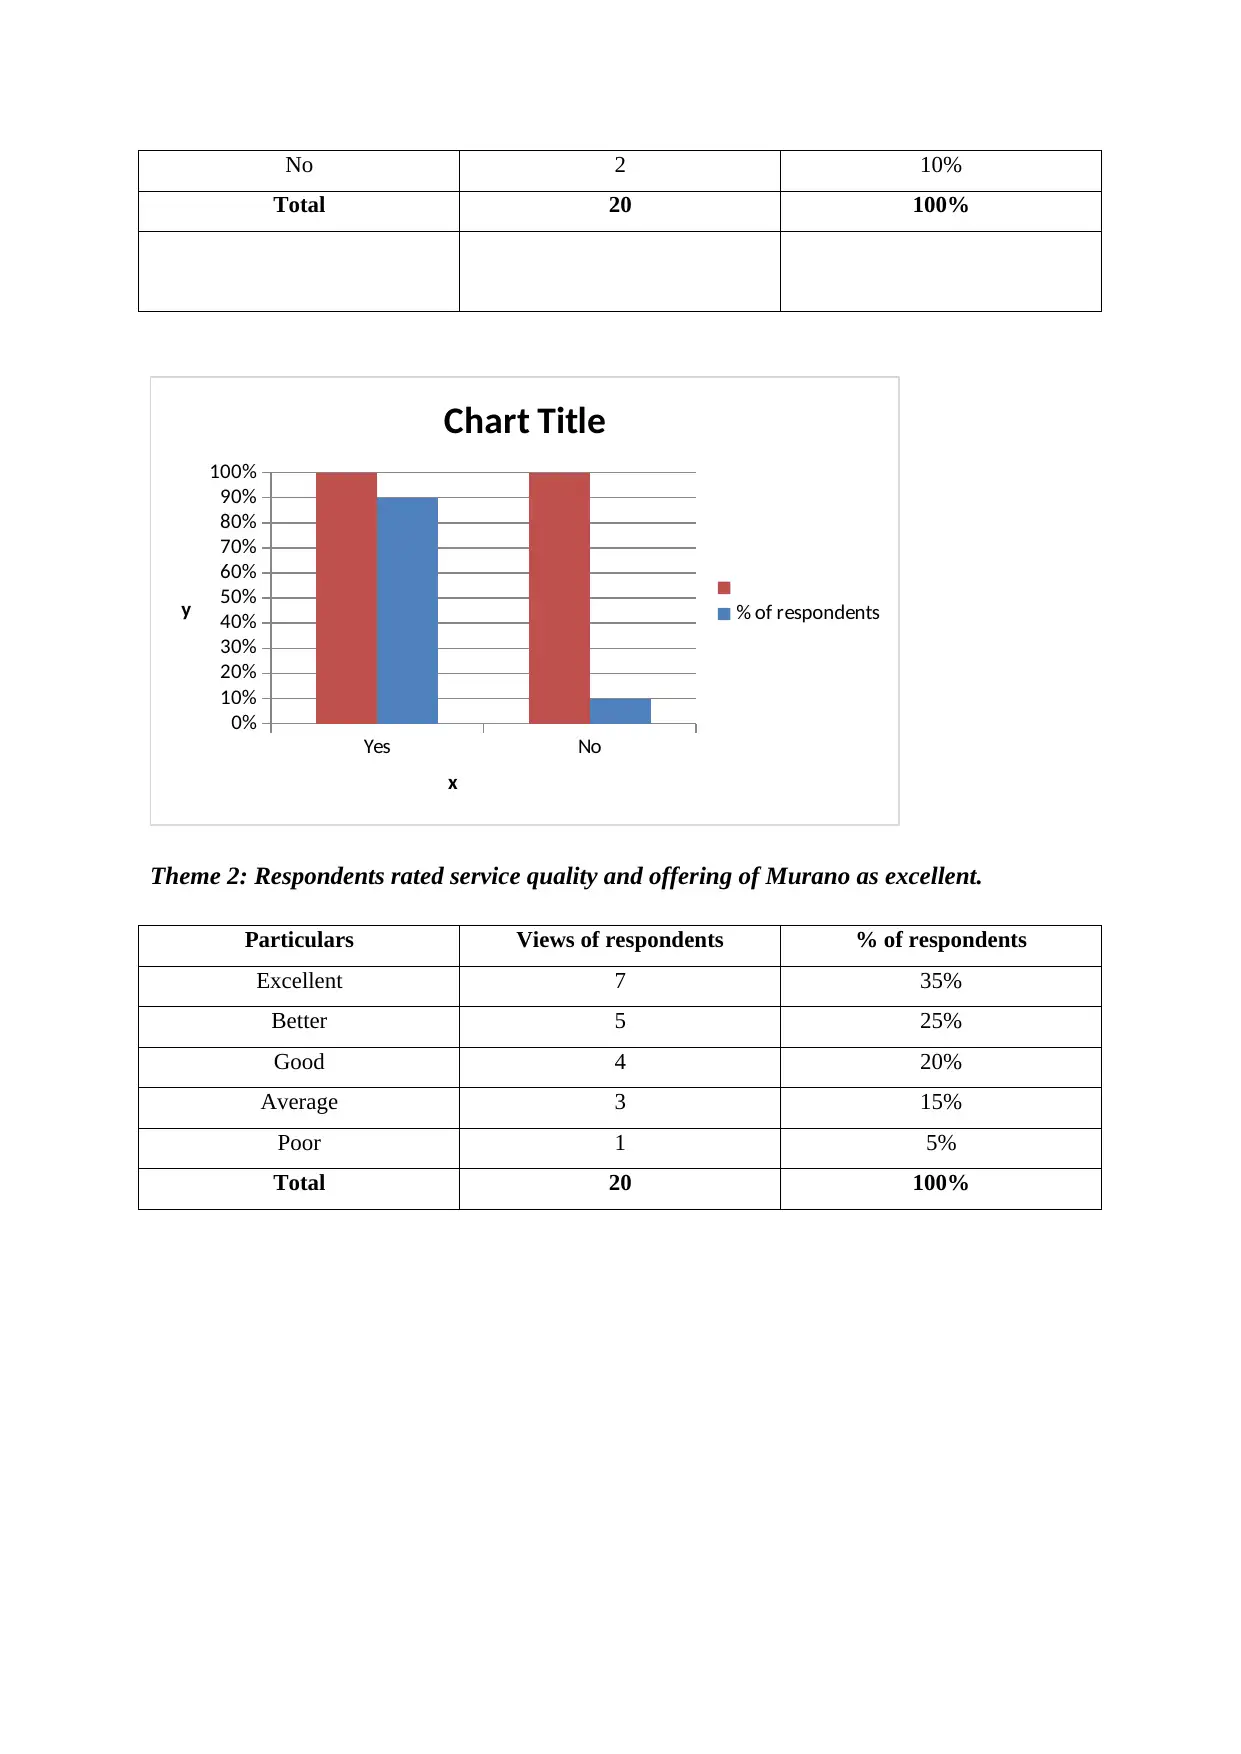
No 2 10%
Total 20 100%
Yes No
0%
10%
20%
30%
40%
50%
60%
70%
80%
90%
100%
Chart Title
% of respondents
x
y
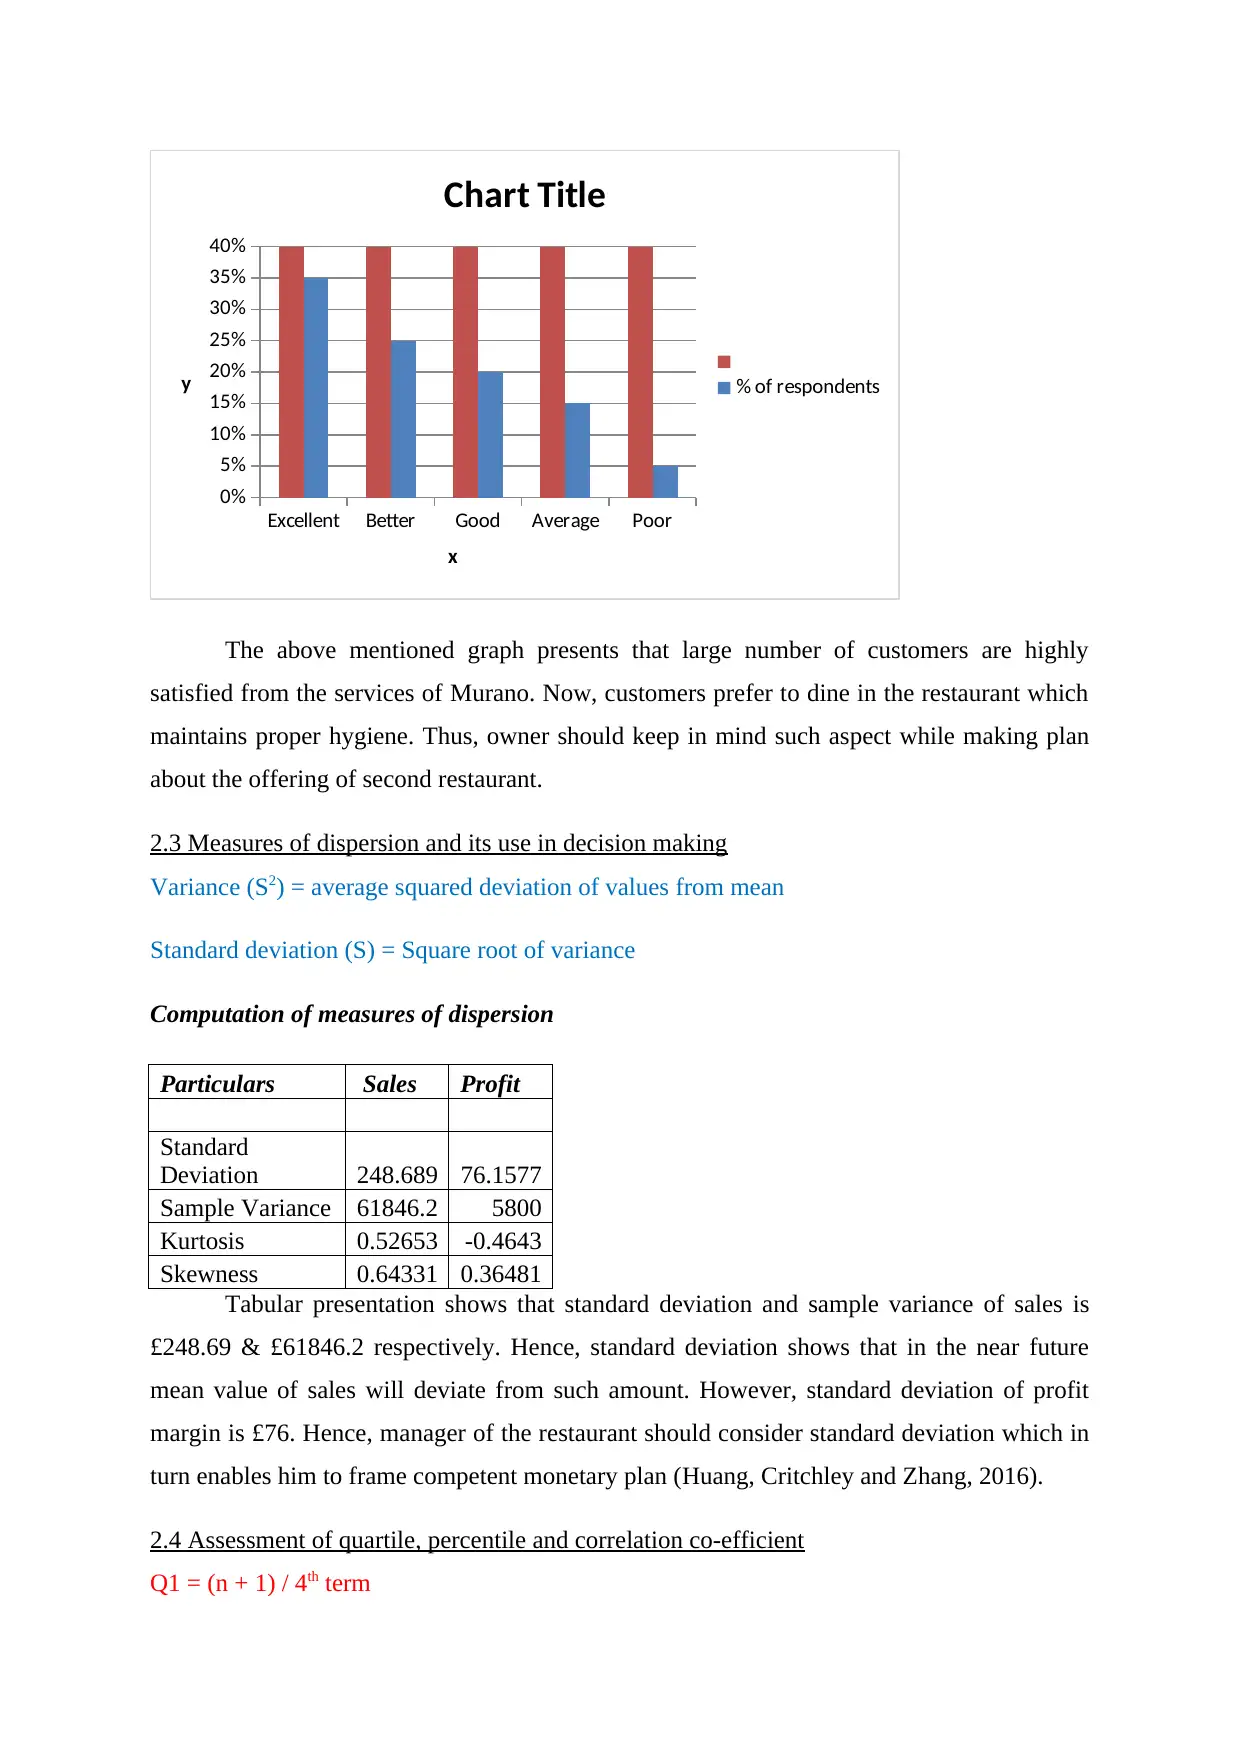
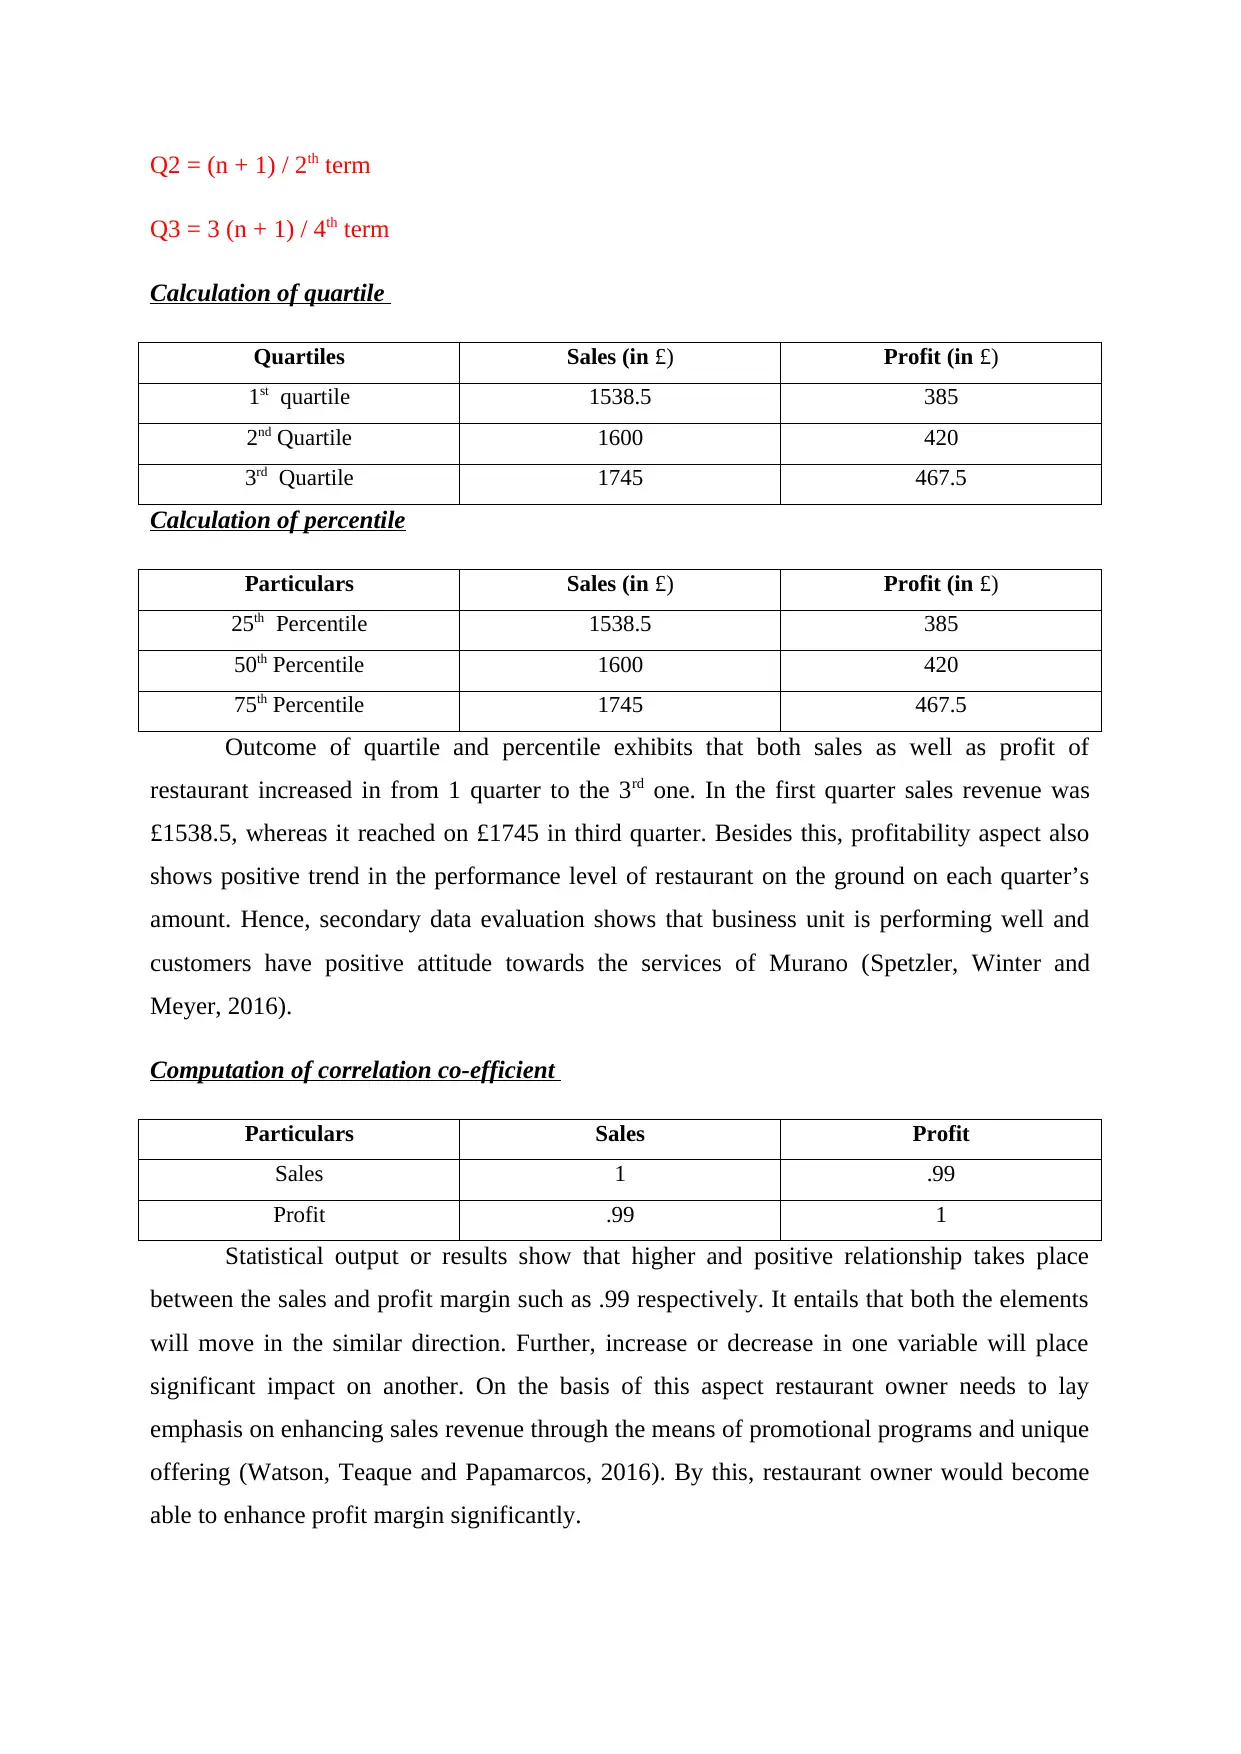
Theme 2: Respondents rated service quality and offering of Murano as excellent.
Particulars Views of respondents % of respondents
Excellent 7 35%
Better 5 25%
Good 4 20%
Average 3 15%
Poor 1 5%
Total 20 100%
Total 20 100%
Yes No
0%
10%
20%
30%
40%
50%
60%
70%
80%
90%
100%
Chart Title
% of respondents
x
y
Theme 2: Respondents rated service quality and offering of Murano as excellent.
Particulars Views of respondents % of respondents
Excellent 7 35%
Better 5 25%
Good 4 20%
Average 3 15%
Poor 1 5%
Total 20 100%
Paraphrase This Document
Need a fresh take? Get an instant paraphrase of this document with our AI Paraphraser
Excellent Better Good Average Poor
0%
5%
10%
15%
20%
25%
30%
35%
40%
Chart Title
% of respondents
x
y
The above mentioned graph presents that large number of customers are highly
satisfied from the services of Murano. Now, customers prefer to dine in the restaurant which
maintains proper hygiene. Thus, owner should keep in mind such aspect while making plan
about the offering of second restaurant.
2.3 Measures of dispersion and its use in decision making
Variance (S2) = average squared deviation of values from mean
Standard deviation (S) = Square root of variance
Computation of measures of dispersion
Particulars Sales Profit
Standard
Deviation 248.689 76.1577
Sample Variance 61846.2 5800
Kurtosis 0.52653 -0.4643
Skewness 0.64331 0.36481
Tabular presentation shows that standard deviation and sample variance of sales is
£248.69 & £61846.2 respectively. Hence, standard deviation shows that in the near future
mean value of sales will deviate from such amount. However, standard deviation of profit
margin is £76. Hence, manager of the restaurant should consider standard deviation which in
turn enables him to frame competent monetary plan (Huang, Critchley and Zhang, 2016).
2.4 Assessment of quartile, percentile and correlation co-efficient
Q1 = (n + 1) / 4th term
Q2 = (n + 1) / 2th term
Q3 = 3 (n + 1) / 4th term
Calculation of quartile
Quartiles Sales (in £) Profit (in £)
1st quartile 1538.5 385
2nd Quartile 1600 420
3rd Quartile 1745 467.5
Calculation of percentile
Particulars Sales (in £) Profit (in £)
25th Percentile 1538.5 385
50th Percentile 1600 420
75th Percentile 1745 467.5
Outcome of quartile and percentile exhibits that both sales as well as profit of
restaurant increased in from 1 quarter to the 3rd one. In the first quarter sales revenue was
£1538.5, whereas it reached on £1745 in third quarter. Besides this, profitability aspect also
shows positive trend in the performance level of restaurant on the ground on each quarter’s
amount. Hence, secondary data evaluation shows that business unit is performing well and
customers have positive attitude towards the services of Murano (Spetzler, Winter and
Meyer, 2016).
Computation of correlation co-efficient
Particulars Sales Profit
Sales 1 .99
Profit .99 1
Statistical output or results show that higher and positive relationship takes place
between the sales and profit margin such as .99 respectively. It entails that both the elements
will move in the similar direction. Further, increase or decrease in one variable will place
significant impact on another. On the basis of this aspect restaurant owner needs to lay
emphasis on enhancing sales revenue through the means of promotional programs and unique
offering (Watson, Teaque and Papamarcos, 2016). By this, restaurant owner would become
able to enhance profit margin significantly.
⊘ This is a preview!⊘
Do you want full access?
Subscribe today to unlock all pages.
Trusted by 1+ million students worldwide
1 out of 25
Related Documents


Your All-in-One AI-Powered Toolkit for Academic Success.
+13062052269
info@desklib.com
Available 24*7 on WhatsApp / Email
![[object Object]](/_next/static/media/star-bottom.7253800d.svg)
Unlock your academic potential
Copyright © 2020–2026 A2Z Services. All Rights Reserved. Developed and managed by ZUCOL.