Financial Performance Analysis: Investment Report on NCC-Gulf Cement
VerifiedAdded on 2020/04/15
|10
|3194
|32
Report
AI Summary
This investment report provides a comprehensive financial analysis of NCC-Gulf Cement Company, focusing on key liquidity ratios and their implications. The report examines various ratios including day’s sales in receivables, accounts receivable turnover, accounts receivable turnover in days, day’s sales in inventory, inventory turnover, inventory turnover in days, operating cycle, working capital ratio, current ratio, acid-test ratio, and cash ratio. Each ratio is calculated and compared across a six-year period (2011-2016), with comparisons made to industry averages to assess the company's financial health and performance. The analysis highlights trends, identifies strengths and weaknesses, and offers insights into the company's ability to manage its assets, liabilities, and overall financial stability. The report concludes with an evaluation of the company's liquidity position and its capacity to meet short-term obligations.
Running head: INVESTMENT REPORT
Investment Report
University Name
Student Name
Authors’ Note
Investment Report
University Name
Student Name
Authors’ Note
Paraphrase This Document
Need a fresh take? Get an instant paraphrase of this document with our AI Paraphraser
2
INVESTMENT REPORT
An analysis of company’s’ liquidity ratios along with sales and net income
Financial statement analysis can be considered as a process of selection, evaluation and
interpretation of financial data, together with other relevant information, in a bid to design an
evaluation of a company’s present as well as future financial condition and overall financial
performance.
Day’s sales in receivables: As rightly indicated by Ehiedu (2014), day’s sales in particularly
accounts receivables also referred to as the total number of days of firm’s receivables, reflects
average number of days it requires to pull together firm’s accounts receivable. Enumeration
for ascertainment of day’s sales in accounts receivables involves division of total days in a
year (that is 365 days) by the accounts receivable turnover ratio for a particular year. In this
case a lower ratio indicates a favourable condition as it implies firms can collect cash earlier
more frequently from their customers and can utilize the cash for various other operations.
The day’s sales in receivables is registered to be 104 in 2011, 126 in 2012, 91 in 2013, 77 in
2014, 74 in 2015 and 95 in 2016. The day’s sales in receivables have decreased considerably
during the year 2016 as compared to the base period 2011, although it has increased in
comparison to year ago period. Also, the average is registered to be 94.66 that are lower than
the industrial average. Therefore, it reflects a favourable financial condition for the firm.
Accounts Receivable Turnover: Accounts receivable turnover can be regarded as the
efficiency ratio that enumerates the number of times a specific business can transform
accounts receivable of a firm into cash particularly during a specific period. In a way, this
ratio can be considered as a liquidity ratio that can reflect the extent of efficiency of a
company at acquiring its credit sales from their clientele (Mohanram et al., 2017). In this
case, higher ratio implies that corporations are amassing their receivables more frequently all
through the year. As enumerated in the case of NCC-Gulf Cement Company P.S.C, the
accounts receivable turnover was observed to be 3.50 in 2011, 3.183 in 2012, 3.41 in 2013,
3
INVESTMENT REPORT
4.62 in 2014, 4.459 in 2015, 4.146 in 2016. The receivable turnover ratio has increased in the
year 2016 as compared to the base period 2011 although it reflects a downward deflection in
2016 as compared to the year ago period. On the whole, the average can be calculated to 3.89
that is over and above the industry average of 3.09. Thus, it can be hereby inferred that
accountable receivable turnover ratio reveals a favourable liquidity condition of the firm
NCC-Gulf Cement Company P.S.C.
Accounts Receivable Turnover in Days: Accounts receivable turnover can be considered as
the total number of times every year that a specific business amasses average accounts
receivable. This ratio replicates the degree of efficiency of the firm in collecting all the credit
sales granted from their customers. Essentially, shorter days implies that the firm can collect
their receivables in lesser time (Cortesi et al., 2015). Accounts Receivable Turnover in Days
for the firm NCC-Gulf Cement Company P.S.C is recorded to be 104 in 2011, 115 in 2012,
107 in 2013, 79 in 2014, 82 in 2015 and 88 in 2016. The recorded figures show that the
Accounts Receivable Turnover in Days of NCC-Gulf Cement Company P.S.C has decreased
during 2016 as compared to the base period 2011. Also, the average for the period recorded
to be 95.78 is lower than the industrial average of 298. 08. Therefore, this reveals a sound
liquidity condition for the firm in terms of Accounts Receivable Turnover in Days.
Day’s Sales in Inventory: Day’s sales in calculation of inventory enumerate the total
number of days a company will take to market all it inventory. Lower days of inventory
outstanding can be considered to be more desirable than comparatively higher ratio (Titman
et al., 2017). The recorded figures for day’s sales in inventory is registered to be 125 in 2011,
143 in 2012, 160 in 2013, 152 in 2014, 147 in 2015 and 143 in 2016. The figures recorded
shows that day’s sale in inventory has declined during the year 2016 as compared to the year
ago period, although it has increased in comparison to the base period 2011. However, the
average is recorded to be 145.07 that is much above the industry average. Thus, it can be
⊘ This is a preview!⊘
Do you want full access?
Subscribe today to unlock all pages.
Trusted by 1+ million students worldwide
4
INVESTMENT REPORT
hereby inferred that day’s sale in inventory replicates an unfavourable financial condition of
the firm NCC-Gulf Cement Company P.S.C. as it reveals that the company is taking
considerably longer period to sell its inventory in comparison to the industry.
Inventory Turnover: Inventory turnover can be considered to be an efficiency ratio that
reflects the way company can effectively manage inventory by means of comparing costs of
goods sold with average inventory for a specific period. As this is a dimension of how
effectively a corporation can control their merchandise, so it is essential to have a higher turn
(Weygandt et al., 2015). The inventory turnover was registered to be 2.93 in 2011, 2.64 in
2012, 2.35 in 2013, 2.38 in 2014. 2.25 in 2015 and 2.39 in 2016. The recorded figure shows
that the ratio has increased in 2016 as compared to the year ago period, reflecting augmented
financial health, although the same has decreased in comparison to the base period 2011. In
addition to this, the average inventory turnover recorded for the 6 year period that stands at
2.49 is much below the industry average of 14. 35 thereby replicate an undesirable financial
condition for the firm.
Inventory Turnover in Days: The inventory turnover in days enumerates the total number
of days a business concern will take to marker all its inventories (Pirie et al., 2015).
Essentially, this calculation reflects the liquidity of company’s inventory. In itself, shorter
days implies that the firm can convert their inventory into cash in lesser time. Along the same
time, it can be said the inventory of the firm is extraordinarily liquid and consequently flow
of cash is also better. The inventory turnover in days for the firm NCC-Gulf Cement
Company P.S.C. is registered to be 125 in 2011, 138 in 2012, 156 in 2013, 154 in 2014, 162
in 2015 and 153 in 2016. The recorded figure for the same has declined in 2016 as compared
to the year ago period 2016 though it has considerably increased gradually throughout the 6
year period and as compared to the base period 2011. Also, the average figure is recorded to
Paraphrase This Document
Need a fresh take? Get an instant paraphrase of this document with our AI Paraphraser
5
INVESTMENT REPORT
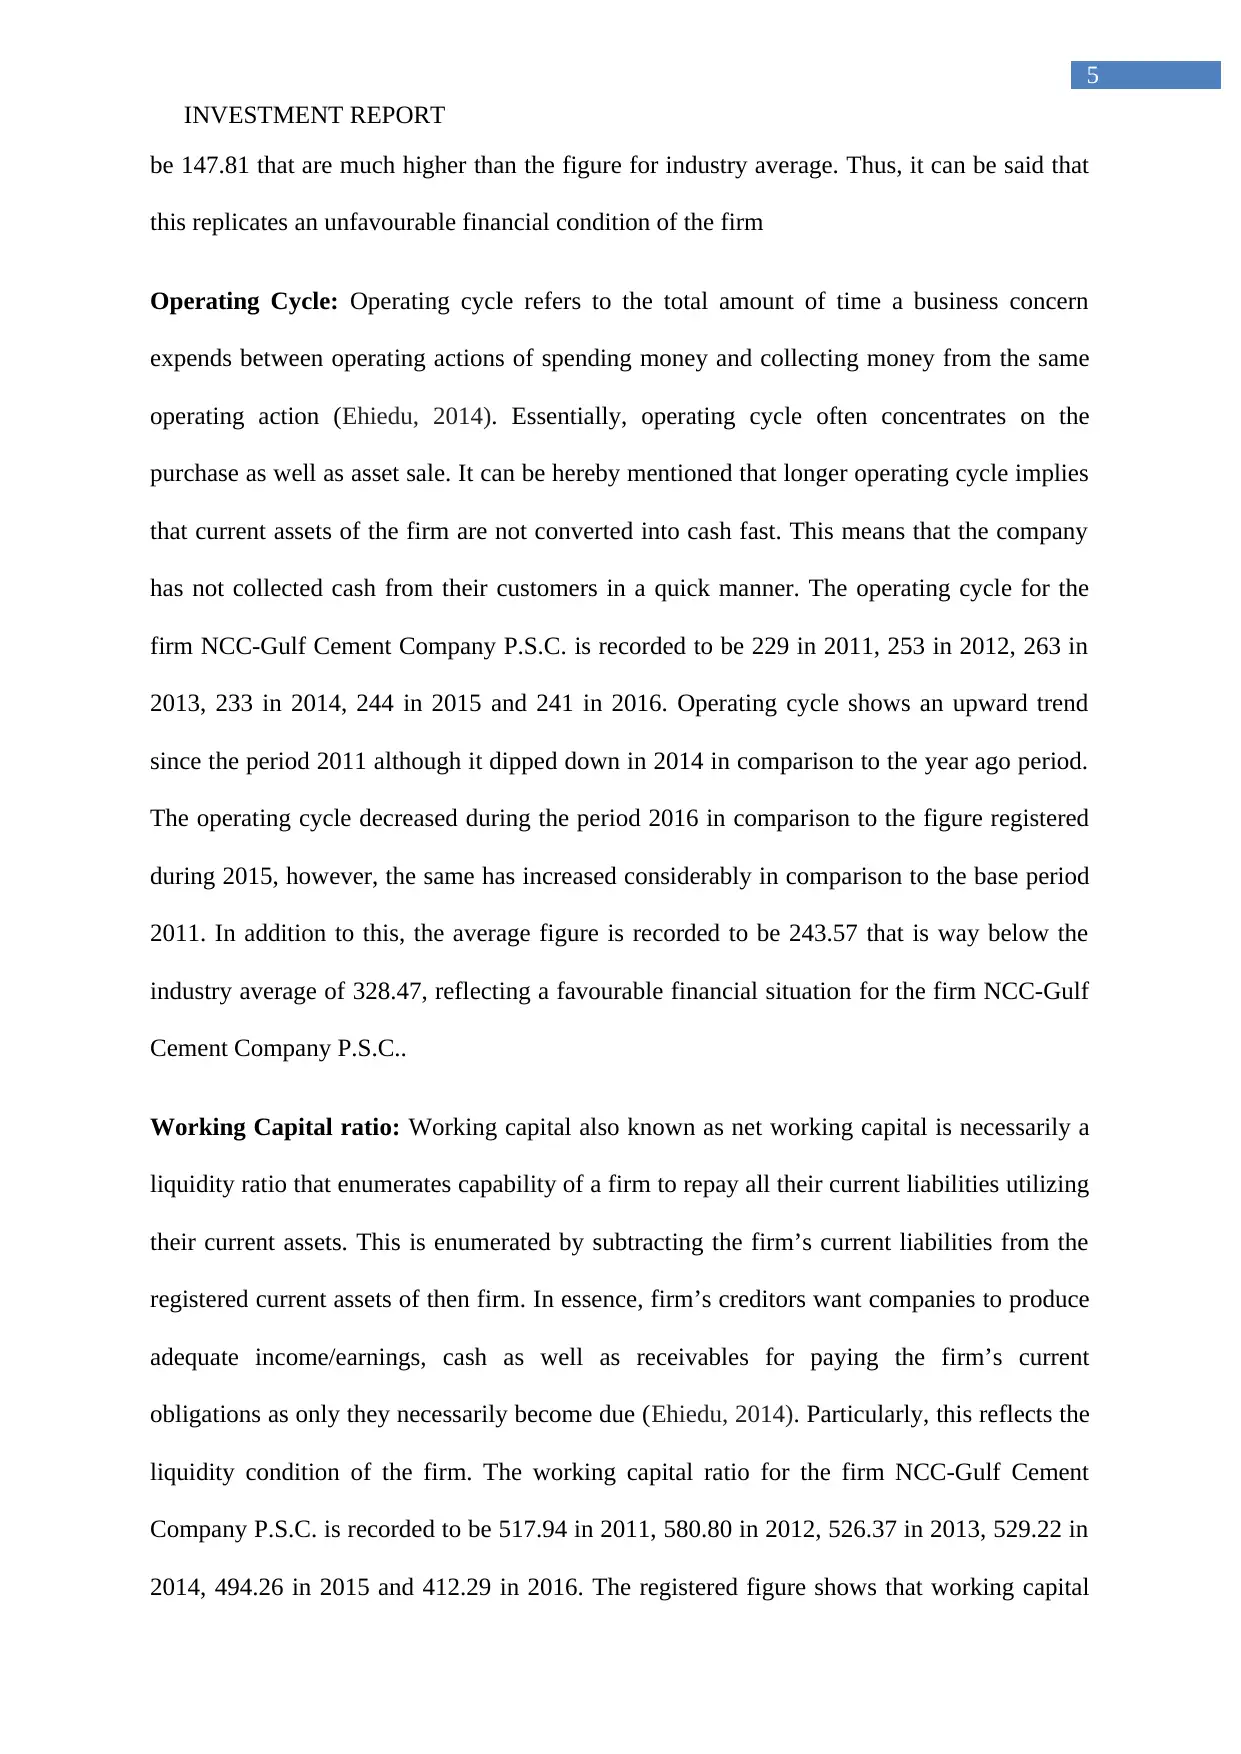
be 147.81 that are much higher than the figure for industry average. Thus, it can be said that
this replicates an unfavourable financial condition of the firm
Operating Cycle: Operating cycle refers to the total amount of time a business concern
expends between operating actions of spending money and collecting money from the same
operating action (Ehiedu, 2014). Essentially, operating cycle often concentrates on the
purchase as well as asset sale. It can be hereby mentioned that longer operating cycle implies
that current assets of the firm are not converted into cash fast. This means that the company
has not collected cash from their customers in a quick manner. The operating cycle for the
firm NCC-Gulf Cement Company P.S.C. is recorded to be 229 in 2011, 253 in 2012, 263 in
2013, 233 in 2014, 244 in 2015 and 241 in 2016. Operating cycle shows an upward trend
since the period 2011 although it dipped down in 2014 in comparison to the year ago period.
The operating cycle decreased during the period 2016 in comparison to the figure registered
during 2015, however, the same has increased considerably in comparison to the base period
2011. In addition to this, the average figure is recorded to be 243.57 that is way below the
industry average of 328.47, reflecting a favourable financial situation for the firm NCC-Gulf
Cement Company P.S.C..
Working Capital ratio: Working capital also known as net working capital is necessarily a
liquidity ratio that enumerates capability of a firm to repay all their current liabilities utilizing
their current assets. This is enumerated by subtracting the firm’s current liabilities from the
registered current assets of then firm. In essence, firm’s creditors want companies to produce
adequate income/earnings, cash as well as receivables for paying the firm’s current
obligations as only they necessarily become due (Ehiedu, 2014). Particularly, this reflects the
liquidity condition of the firm. The working capital ratio for the firm NCC-Gulf Cement
Company P.S.C. is recorded to be 517.94 in 2011, 580.80 in 2012, 526.37 in 2013, 529.22 in
2014, 494.26 in 2015 and 412.29 in 2016. The registered figure shows that working capital
INVESTMENT REPORT
be 147.81 that are much higher than the figure for industry average. Thus, it can be said that
this replicates an unfavourable financial condition of the firm
Operating Cycle: Operating cycle refers to the total amount of time a business concern
expends between operating actions of spending money and collecting money from the same
operating action (Ehiedu, 2014). Essentially, operating cycle often concentrates on the
purchase as well as asset sale. It can be hereby mentioned that longer operating cycle implies
that current assets of the firm are not converted into cash fast. This means that the company
has not collected cash from their customers in a quick manner. The operating cycle for the
firm NCC-Gulf Cement Company P.S.C. is recorded to be 229 in 2011, 253 in 2012, 263 in
2013, 233 in 2014, 244 in 2015 and 241 in 2016. Operating cycle shows an upward trend
since the period 2011 although it dipped down in 2014 in comparison to the year ago period.
The operating cycle decreased during the period 2016 in comparison to the figure registered
during 2015, however, the same has increased considerably in comparison to the base period
2011. In addition to this, the average figure is recorded to be 243.57 that is way below the
industry average of 328.47, reflecting a favourable financial situation for the firm NCC-Gulf
Cement Company P.S.C..
Working Capital ratio: Working capital also known as net working capital is necessarily a
liquidity ratio that enumerates capability of a firm to repay all their current liabilities utilizing
their current assets. This is enumerated by subtracting the firm’s current liabilities from the
registered current assets of then firm. In essence, firm’s creditors want companies to produce
adequate income/earnings, cash as well as receivables for paying the firm’s current
obligations as only they necessarily become due (Ehiedu, 2014). Particularly, this reflects the
liquidity condition of the firm. The working capital ratio for the firm NCC-Gulf Cement
Company P.S.C. is recorded to be 517.94 in 2011, 580.80 in 2012, 526.37 in 2013, 529.22 in
2014, 494.26 in 2015 and 412.29 in 2016. The registered figure shows that working capital
6
INVESTMENT REPORT
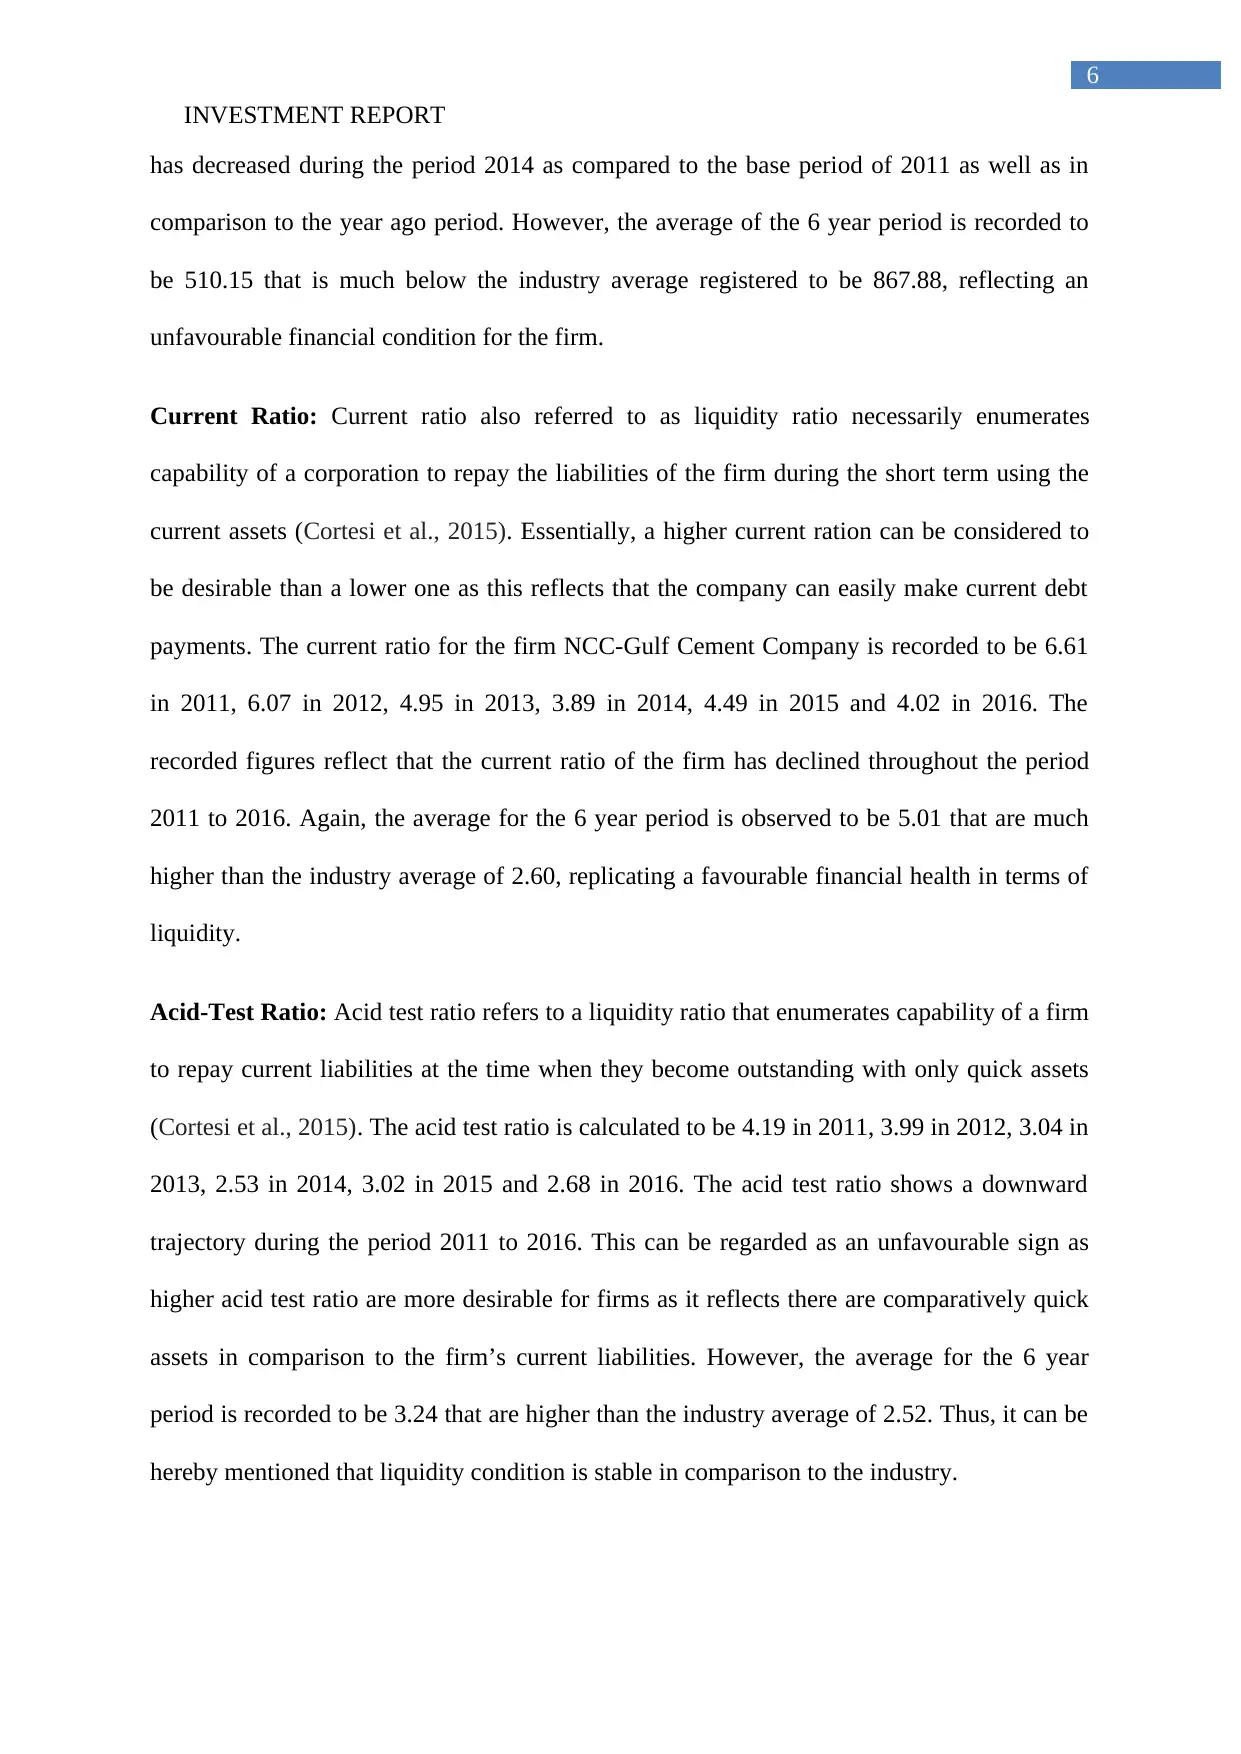
has decreased during the period 2014 as compared to the base period of 2011 as well as in
comparison to the year ago period. However, the average of the 6 year period is recorded to
be 510.15 that is much below the industry average registered to be 867.88, reflecting an
unfavourable financial condition for the firm.
Current Ratio: Current ratio also referred to as liquidity ratio necessarily enumerates
capability of a corporation to repay the liabilities of the firm during the short term using the
current assets (Cortesi et al., 2015). Essentially, a higher current ration can be considered to
be desirable than a lower one as this reflects that the company can easily make current debt
payments. The current ratio for the firm NCC-Gulf Cement Company is recorded to be 6.61
in 2011, 6.07 in 2012, 4.95 in 2013, 3.89 in 2014, 4.49 in 2015 and 4.02 in 2016. The
recorded figures reflect that the current ratio of the firm has declined throughout the period
2011 to 2016. Again, the average for the 6 year period is observed to be 5.01 that are much
higher than the industry average of 2.60, replicating a favourable financial health in terms of
liquidity.
Acid-Test Ratio: Acid test ratio refers to a liquidity ratio that enumerates capability of a firm
to repay current liabilities at the time when they become outstanding with only quick assets
(Cortesi et al., 2015). The acid test ratio is calculated to be 4.19 in 2011, 3.99 in 2012, 3.04 in
2013, 2.53 in 2014, 3.02 in 2015 and 2.68 in 2016. The acid test ratio shows a downward
trajectory during the period 2011 to 2016. This can be regarded as an unfavourable sign as
higher acid test ratio are more desirable for firms as it reflects there are comparatively quick
assets in comparison to the firm’s current liabilities. However, the average for the 6 year
period is recorded to be 3.24 that are higher than the industry average of 2.52. Thus, it can be
hereby mentioned that liquidity condition is stable in comparison to the industry.
INVESTMENT REPORT
has decreased during the period 2014 as compared to the base period of 2011 as well as in
comparison to the year ago period. However, the average of the 6 year period is recorded to
be 510.15 that is much below the industry average registered to be 867.88, reflecting an
unfavourable financial condition for the firm.
Current Ratio: Current ratio also referred to as liquidity ratio necessarily enumerates
capability of a corporation to repay the liabilities of the firm during the short term using the
current assets (Cortesi et al., 2015). Essentially, a higher current ration can be considered to
be desirable than a lower one as this reflects that the company can easily make current debt
payments. The current ratio for the firm NCC-Gulf Cement Company is recorded to be 6.61
in 2011, 6.07 in 2012, 4.95 in 2013, 3.89 in 2014, 4.49 in 2015 and 4.02 in 2016. The
recorded figures reflect that the current ratio of the firm has declined throughout the period
2011 to 2016. Again, the average for the 6 year period is observed to be 5.01 that are much
higher than the industry average of 2.60, replicating a favourable financial health in terms of
liquidity.
Acid-Test Ratio: Acid test ratio refers to a liquidity ratio that enumerates capability of a firm
to repay current liabilities at the time when they become outstanding with only quick assets
(Cortesi et al., 2015). The acid test ratio is calculated to be 4.19 in 2011, 3.99 in 2012, 3.04 in
2013, 2.53 in 2014, 3.02 in 2015 and 2.68 in 2016. The acid test ratio shows a downward
trajectory during the period 2011 to 2016. This can be regarded as an unfavourable sign as
higher acid test ratio are more desirable for firms as it reflects there are comparatively quick
assets in comparison to the firm’s current liabilities. However, the average for the 6 year
period is recorded to be 3.24 that are higher than the industry average of 2.52. Thus, it can be
hereby mentioned that liquidity condition is stable in comparison to the industry.
⊘ This is a preview!⊘
Do you want full access?
Subscribe today to unlock all pages.
Trusted by 1+ million students worldwide
7
INVESTMENT REPORT
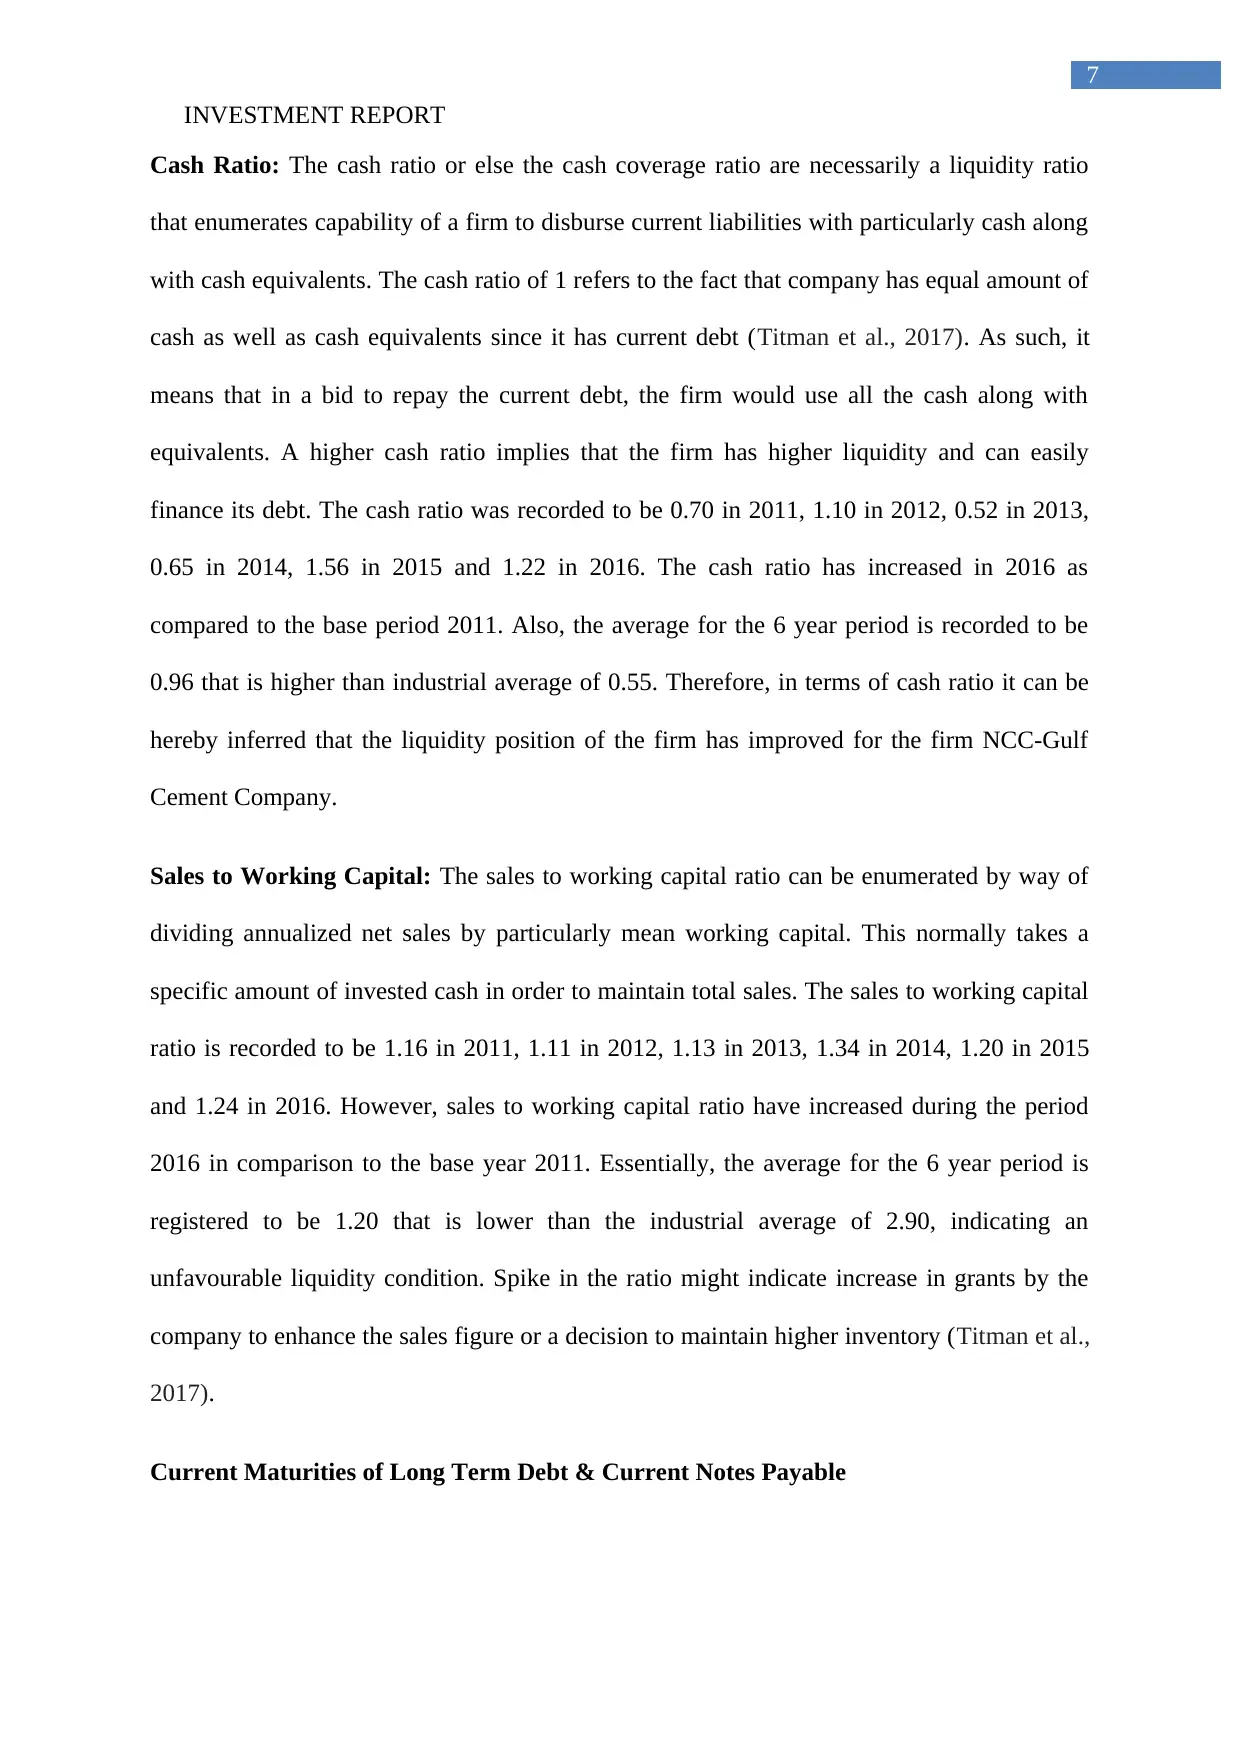
Cash Ratio: The cash ratio or else the cash coverage ratio are necessarily a liquidity ratio
that enumerates capability of a firm to disburse current liabilities with particularly cash along
with cash equivalents. The cash ratio of 1 refers to the fact that company has equal amount of
cash as well as cash equivalents since it has current debt (Titman et al., 2017). As such, it
means that in a bid to repay the current debt, the firm would use all the cash along with
equivalents. A higher cash ratio implies that the firm has higher liquidity and can easily
finance its debt. The cash ratio was recorded to be 0.70 in 2011, 1.10 in 2012, 0.52 in 2013,
0.65 in 2014, 1.56 in 2015 and 1.22 in 2016. The cash ratio has increased in 2016 as
compared to the base period 2011. Also, the average for the 6 year period is recorded to be
0.96 that is higher than industrial average of 0.55. Therefore, in terms of cash ratio it can be
hereby inferred that the liquidity position of the firm has improved for the firm NCC-Gulf
Cement Company.
Sales to Working Capital: The sales to working capital ratio can be enumerated by way of
dividing annualized net sales by particularly mean working capital. This normally takes a
specific amount of invested cash in order to maintain total sales. The sales to working capital
ratio is recorded to be 1.16 in 2011, 1.11 in 2012, 1.13 in 2013, 1.34 in 2014, 1.20 in 2015
and 1.24 in 2016. However, sales to working capital ratio have increased during the period
2016 in comparison to the base year 2011. Essentially, the average for the 6 year period is
registered to be 1.20 that is lower than the industrial average of 2.90, indicating an
unfavourable liquidity condition. Spike in the ratio might indicate increase in grants by the
company to enhance the sales figure or a decision to maintain higher inventory (Titman et al.,
2017).
Current Maturities of Long Term Debt & Current Notes Payable
INVESTMENT REPORT
Cash Ratio: The cash ratio or else the cash coverage ratio are necessarily a liquidity ratio
that enumerates capability of a firm to disburse current liabilities with particularly cash along
with cash equivalents. The cash ratio of 1 refers to the fact that company has equal amount of
cash as well as cash equivalents since it has current debt (Titman et al., 2017). As such, it
means that in a bid to repay the current debt, the firm would use all the cash along with
equivalents. A higher cash ratio implies that the firm has higher liquidity and can easily
finance its debt. The cash ratio was recorded to be 0.70 in 2011, 1.10 in 2012, 0.52 in 2013,
0.65 in 2014, 1.56 in 2015 and 1.22 in 2016. The cash ratio has increased in 2016 as
compared to the base period 2011. Also, the average for the 6 year period is recorded to be
0.96 that is higher than industrial average of 0.55. Therefore, in terms of cash ratio it can be
hereby inferred that the liquidity position of the firm has improved for the firm NCC-Gulf
Cement Company.
Sales to Working Capital: The sales to working capital ratio can be enumerated by way of
dividing annualized net sales by particularly mean working capital. This normally takes a
specific amount of invested cash in order to maintain total sales. The sales to working capital
ratio is recorded to be 1.16 in 2011, 1.11 in 2012, 1.13 in 2013, 1.34 in 2014, 1.20 in 2015
and 1.24 in 2016. However, sales to working capital ratio have increased during the period
2016 in comparison to the base year 2011. Essentially, the average for the 6 year period is
registered to be 1.20 that is lower than the industrial average of 2.90, indicating an
unfavourable liquidity condition. Spike in the ratio might indicate increase in grants by the
company to enhance the sales figure or a decision to maintain higher inventory (Titman et al.,
2017).
Current Maturities of Long Term Debt & Current Notes Payable
Paraphrase This Document
Need a fresh take? Get an instant paraphrase of this document with our AI Paraphraser
8
INVESTMENT REPORT
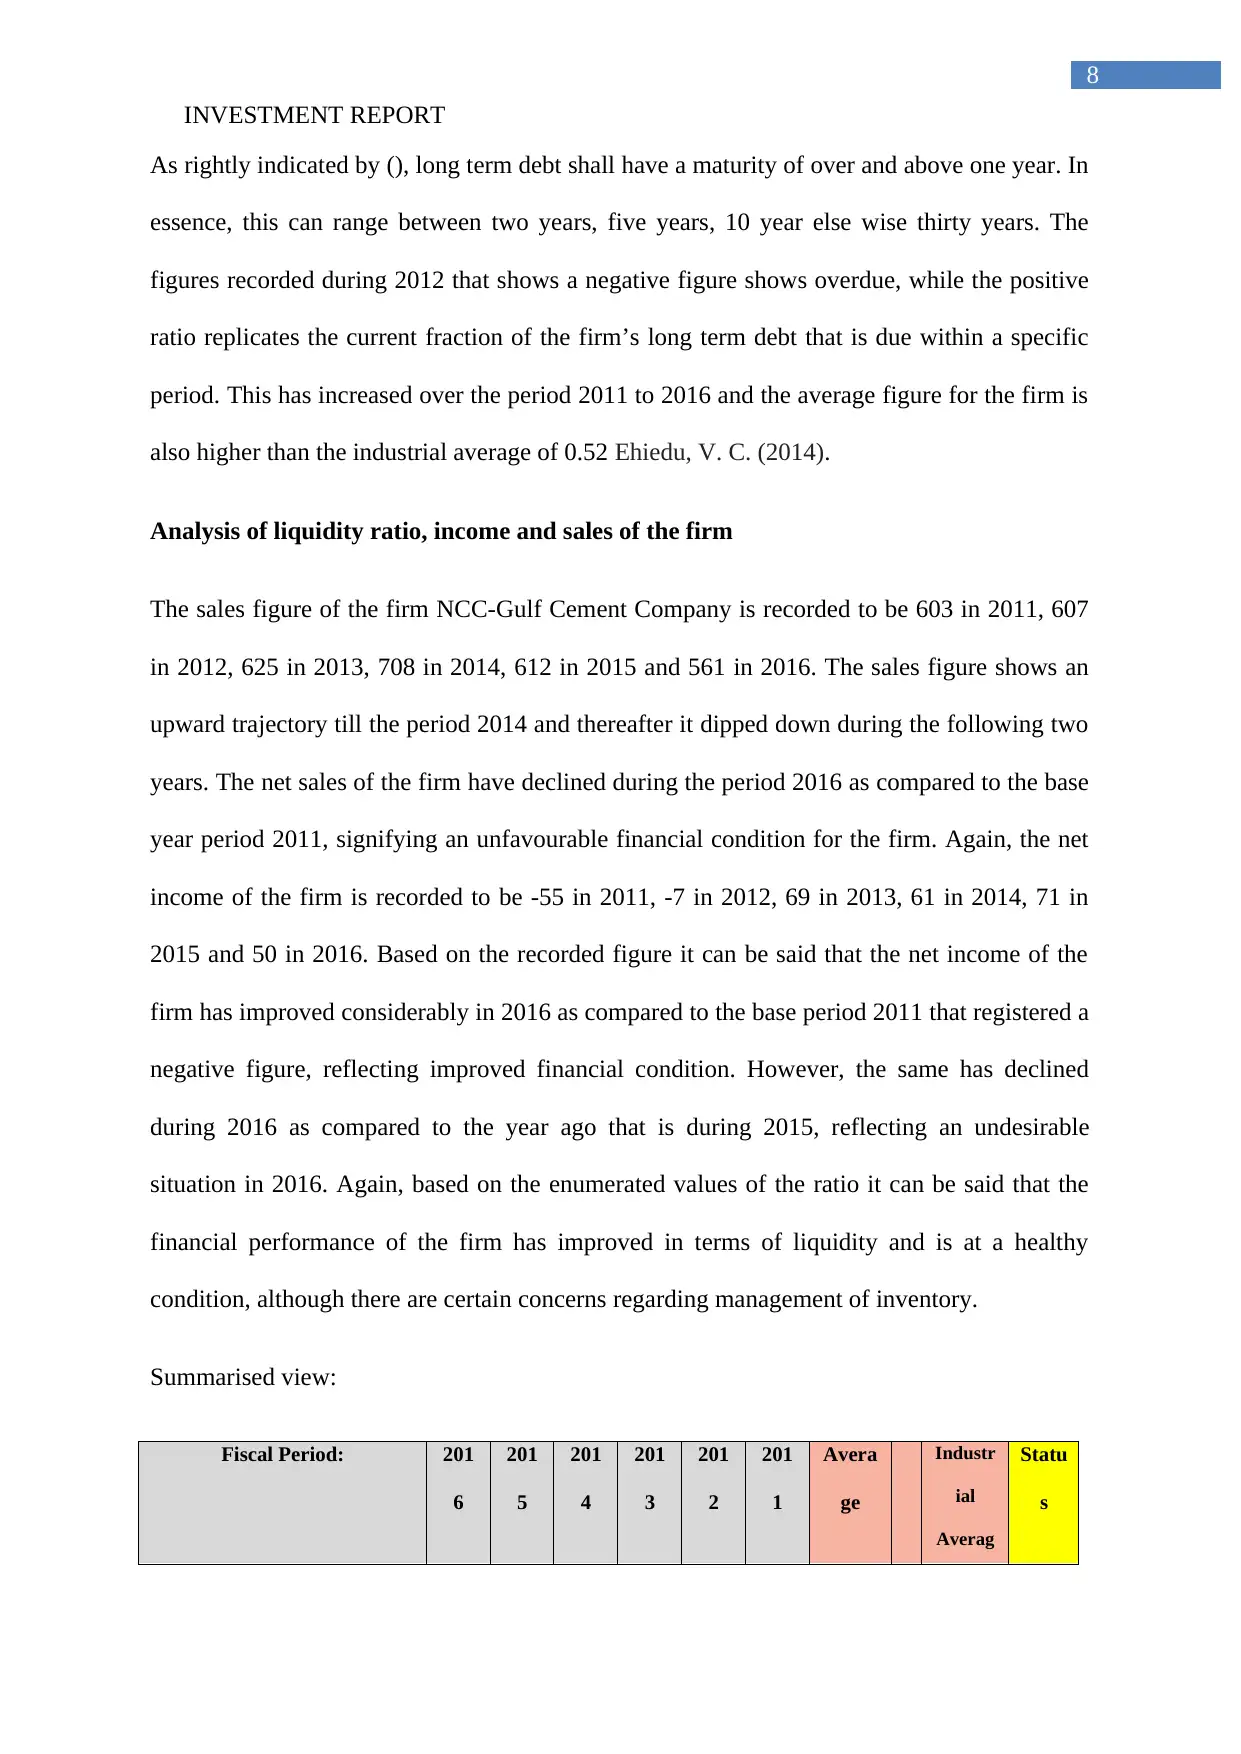
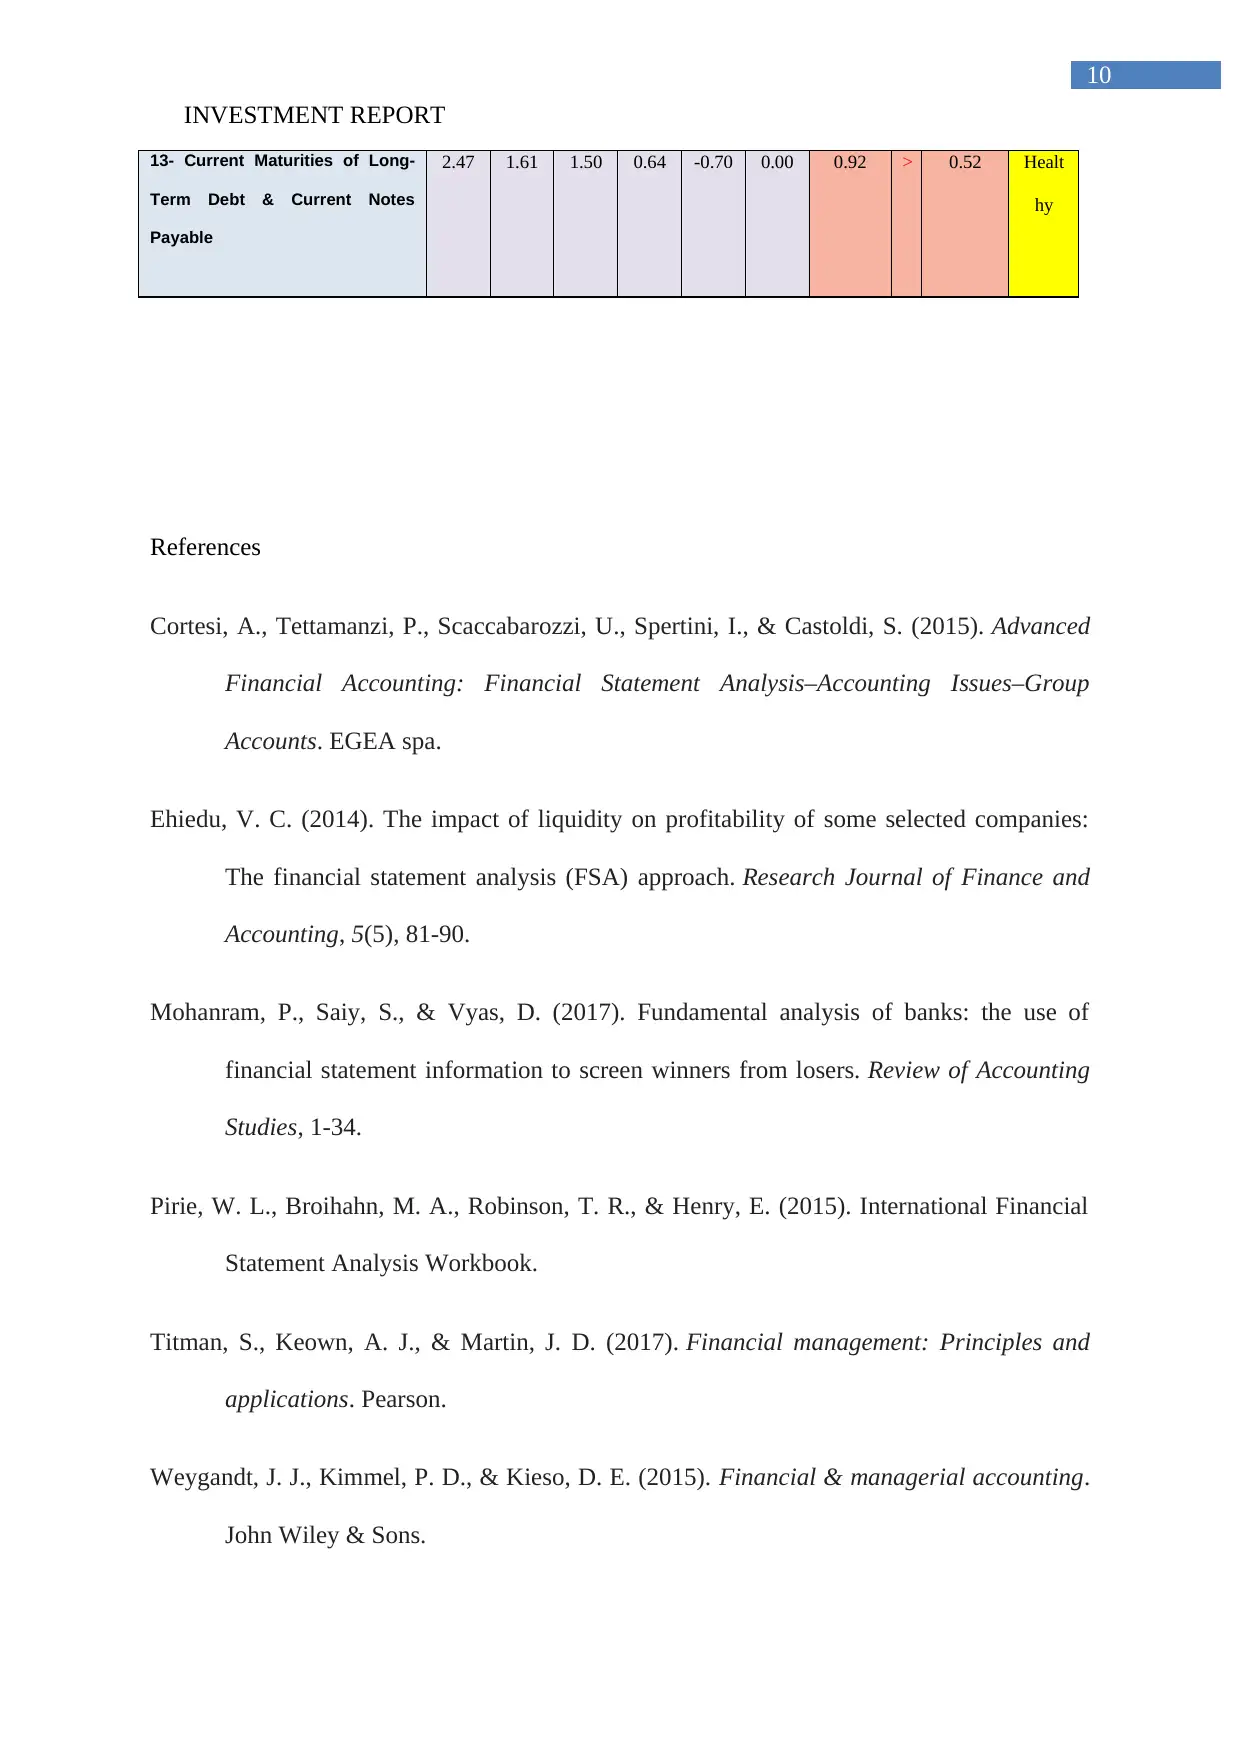
As rightly indicated by (), long term debt shall have a maturity of over and above one year. In
essence, this can range between two years, five years, 10 year else wise thirty years. The
figures recorded during 2012 that shows a negative figure shows overdue, while the positive
ratio replicates the current fraction of the firm’s long term debt that is due within a specific
period. This has increased over the period 2011 to 2016 and the average figure for the firm is
also higher than the industrial average of 0.52 Ehiedu, V. C. (2014).
Analysis of liquidity ratio, income and sales of the firm
The sales figure of the firm NCC-Gulf Cement Company is recorded to be 603 in 2011, 607
in 2012, 625 in 2013, 708 in 2014, 612 in 2015 and 561 in 2016. The sales figure shows an
upward trajectory till the period 2014 and thereafter it dipped down during the following two
years. The net sales of the firm have declined during the period 2016 as compared to the base
year period 2011, signifying an unfavourable financial condition for the firm. Again, the net
income of the firm is recorded to be -55 in 2011, -7 in 2012, 69 in 2013, 61 in 2014, 71 in
2015 and 50 in 2016. Based on the recorded figure it can be said that the net income of the
firm has improved considerably in 2016 as compared to the base period 2011 that registered a
negative figure, reflecting improved financial condition. However, the same has declined
during 2016 as compared to the year ago that is during 2015, reflecting an undesirable
situation in 2016. Again, based on the enumerated values of the ratio it can be said that the
financial performance of the firm has improved in terms of liquidity and is at a healthy
condition, although there are certain concerns regarding management of inventory.
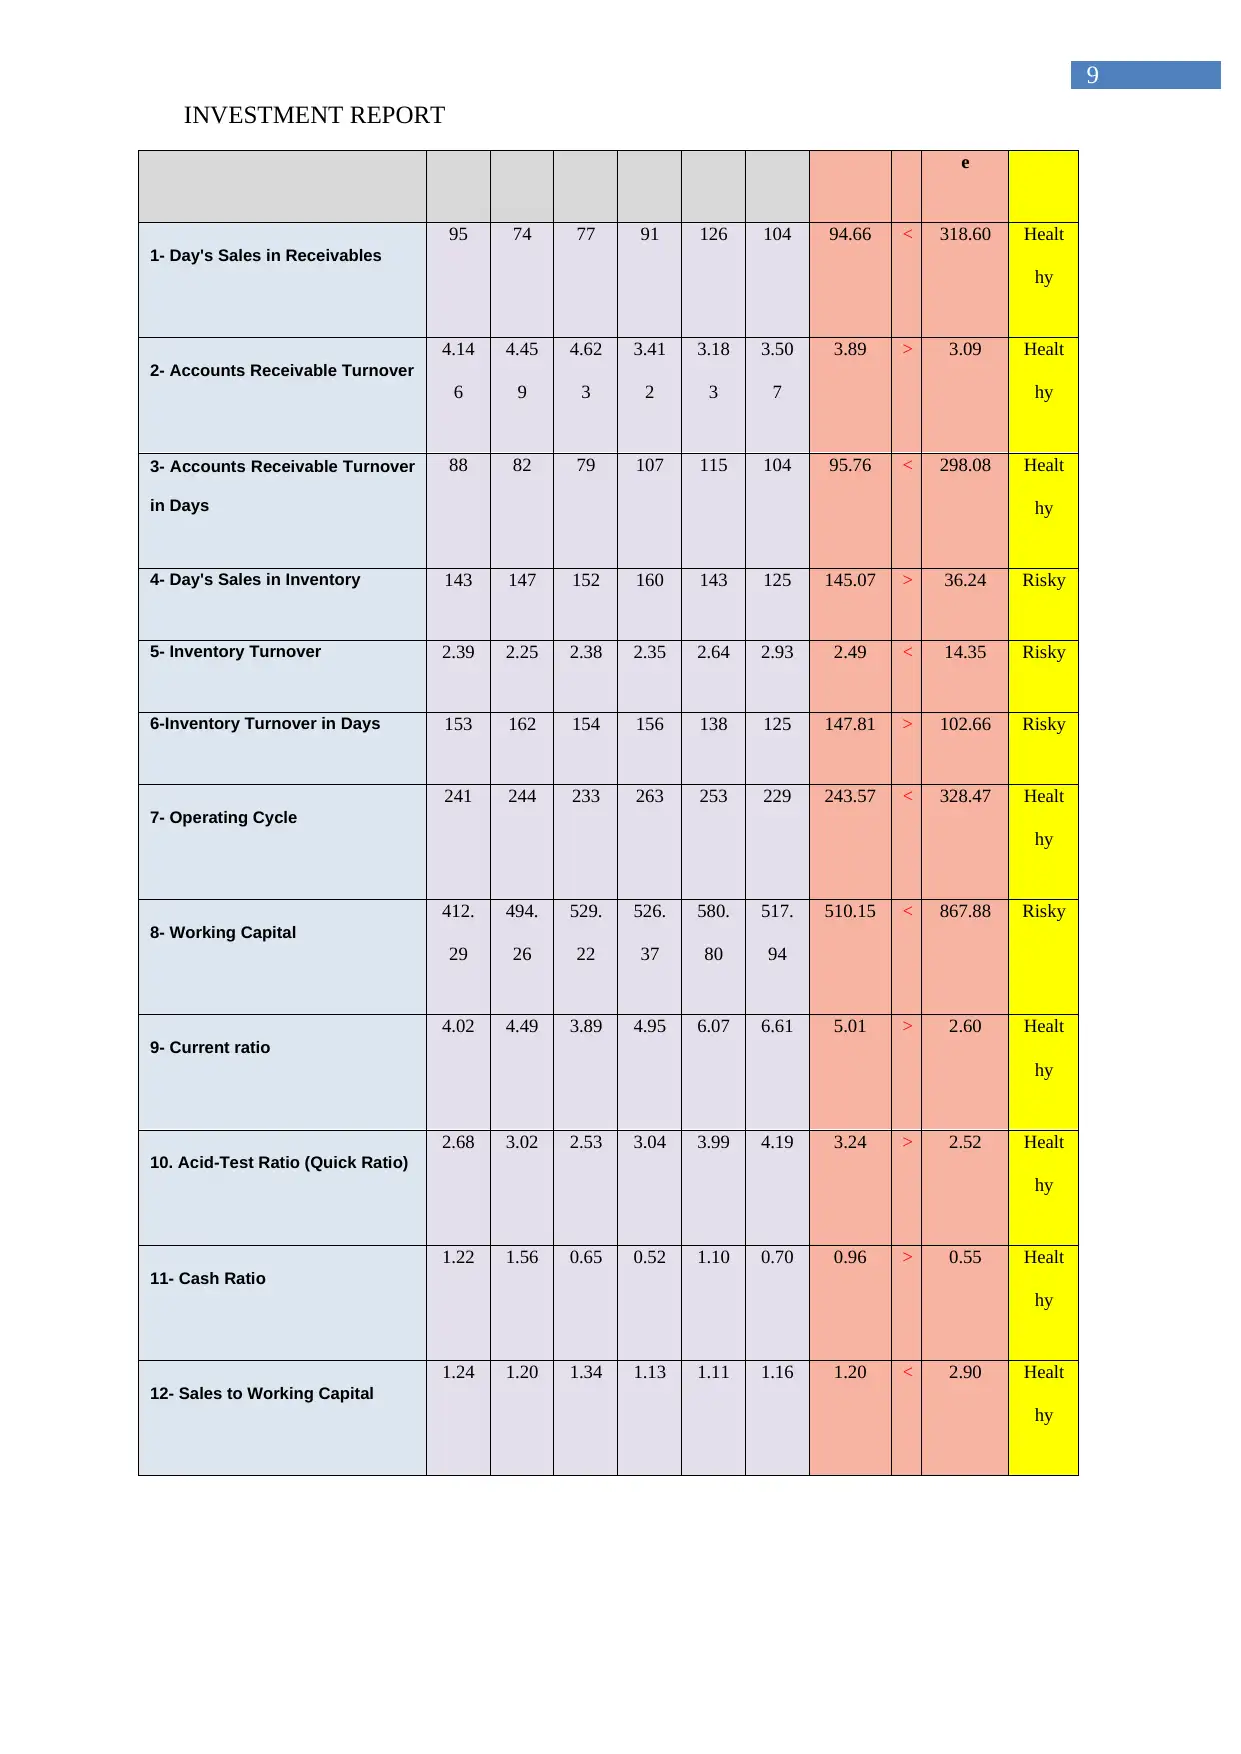
Summarised view:
Fiscal Period: 201
6
201
5
201
4
201
3
201
2
201
1
Avera
ge
Industr
ial
Averag
Statu
s
INVESTMENT REPORT
As rightly indicated by (), long term debt shall have a maturity of over and above one year. In
essence, this can range between two years, five years, 10 year else wise thirty years. The
figures recorded during 2012 that shows a negative figure shows overdue, while the positive
ratio replicates the current fraction of the firm’s long term debt that is due within a specific
period. This has increased over the period 2011 to 2016 and the average figure for the firm is
also higher than the industrial average of 0.52 Ehiedu, V. C. (2014).
Analysis of liquidity ratio, income and sales of the firm
The sales figure of the firm NCC-Gulf Cement Company is recorded to be 603 in 2011, 607
in 2012, 625 in 2013, 708 in 2014, 612 in 2015 and 561 in 2016. The sales figure shows an
upward trajectory till the period 2014 and thereafter it dipped down during the following two
years. The net sales of the firm have declined during the period 2016 as compared to the base
year period 2011, signifying an unfavourable financial condition for the firm. Again, the net
income of the firm is recorded to be -55 in 2011, -7 in 2012, 69 in 2013, 61 in 2014, 71 in
2015 and 50 in 2016. Based on the recorded figure it can be said that the net income of the
firm has improved considerably in 2016 as compared to the base period 2011 that registered a
negative figure, reflecting improved financial condition. However, the same has declined
during 2016 as compared to the year ago that is during 2015, reflecting an undesirable
situation in 2016. Again, based on the enumerated values of the ratio it can be said that the
financial performance of the firm has improved in terms of liquidity and is at a healthy
condition, although there are certain concerns regarding management of inventory.
Summarised view:
Fiscal Period: 201
6
201
5
201
4
201
3
201
2
201
1
Avera
ge
Industr
ial
Averag
Statu
s
9
INVESTMENT REPORT
e
1- Day's Sales in Receivables
95 74 77 91 126 104 94.66 < 318.60 Healt
hy
2- Accounts Receivable Turnover
4.14
6
4.45
9
4.62
3
3.41
2
3.18
3
3.50
7
3.89 > 3.09 Healt
hy
3- Accounts Receivable Turnover
in Days
88 82 79 107 115 104 95.76 < 298.08 Healt
hy
4- Day's Sales in Inventory 143 147 152 160 143 125 145.07 > 36.24 Risky
5- Inventory Turnover 2.39 2.25 2.38 2.35 2.64 2.93 2.49 < 14.35 Risky
6-Inventory Turnover in Days 153 162 154 156 138 125 147.81 > 102.66 Risky
7- Operating Cycle
241 244 233 263 253 229 243.57 < 328.47 Healt
hy
8- Working Capital
412.
29
494.
26
529.
22
526.
37
580.
80
517.
94
510.15 < 867.88 Risky
9- Current ratio
4.02 4.49 3.89 4.95 6.07 6.61 5.01 > 2.60 Healt
hy
10. Acid-Test Ratio (Quick Ratio)
2.68 3.02 2.53 3.04 3.99 4.19 3.24 > 2.52 Healt
hy
11- Cash Ratio
1.22 1.56 0.65 0.52 1.10 0.70 0.96 > 0.55 Healt
hy
12- Sales to Working Capital
1.24 1.20 1.34 1.13 1.11 1.16 1.20 < 2.90 Healt
hy
⊘ This is a preview!⊘
Do you want full access?
Subscribe today to unlock all pages.
Trusted by 1+ million students worldwide
10
INVESTMENT REPORT
13- Current Maturities of Long-
Term Debt & Current Notes
Payable
2.47 1.61 1.50 0.64 -0.70 0.00 0.92 > 0.52 Healt
hy
References
Cortesi, A., Tettamanzi, P., Scaccabarozzi, U., Spertini, I., & Castoldi, S. (2015). Advanced
Financial Accounting: Financial Statement Analysis–Accounting Issues–Group
Accounts. EGEA spa.
Ehiedu, V. C. (2014). The impact of liquidity on profitability of some selected companies:
The financial statement analysis (FSA) approach. Research Journal of Finance and
Accounting, 5(5), 81-90.
Mohanram, P., Saiy, S., & Vyas, D. (2017). Fundamental analysis of banks: the use of
financial statement information to screen winners from losers. Review of Accounting
Studies, 1-34.
Pirie, W. L., Broihahn, M. A., Robinson, T. R., & Henry, E. (2015). International Financial
Statement Analysis Workbook.
Titman, S., Keown, A. J., & Martin, J. D. (2017). Financial management: Principles and
applications. Pearson.
Weygandt, J. J., Kimmel, P. D., & Kieso, D. E. (2015). Financial & managerial accounting.
John Wiley & Sons.
1 out of 10
Related Documents


Your All-in-One AI-Powered Toolkit for Academic Success.
+13062052269
info@desklib.com
Available 24*7 on WhatsApp / Email
![[object Object]](/_next/static/media/star-bottom.7253800d.svg)
Unlock your academic potential
Copyright © 2020–2026 A2Z Services. All Rights Reserved. Developed and managed by ZUCOL.