Ola plc: A Financial Accountability and Strategic Analysis Report
VerifiedAdded on 2023/06/13
|14
|3238
|446
Report
AI Summary
This report provides a comprehensive financial analysis of Ola plc, Ireland's largest oil-based product manufacturer. It assesses the company's financial accountability, focusing on its cost leadership strategy and its impact on profitability and quality. The report includes an income statement, breakeven point analysis (in units and monetary value), desired sales calculations for increased profit targets, and margin of safety assessment. It also anticipates breakeven points for the upcoming year, considering projected changes in sales and costs. The analysis identifies areas for improvement, particularly in addressing quality issues and production bottlenecks, and offers recommendations for enhancing financial performance and strategic decision-making. This document is available on Desklib, a platform offering study tools and solved assignments for students.

Running Head: Managing for Financial accountability
1
1
Paraphrase This Document
Need a fresh take? Get an instant paraphrase of this document with our AI Paraphraser
Managing for Financial accountability 2
Contents
Introduction.......................................................................................................................3
Income statement of the company....................................................................................4
Breakeven point in units...................................................................................................5
Breakeven point in monetary value..................................................................................5
Desired sales units............................................................................................................6
Desired sales in monetary value.......................................................................................7
Margin of safety................................................................................................................8
Desired sales units............................................................................................................9
Anticipates breakeven point...........................................................................................10
Recommendations...........................................................................................................11
Conclusion......................................................................................................................12
References.......................................................................................................................13
Managing for Financial accountability 3
Introduction:
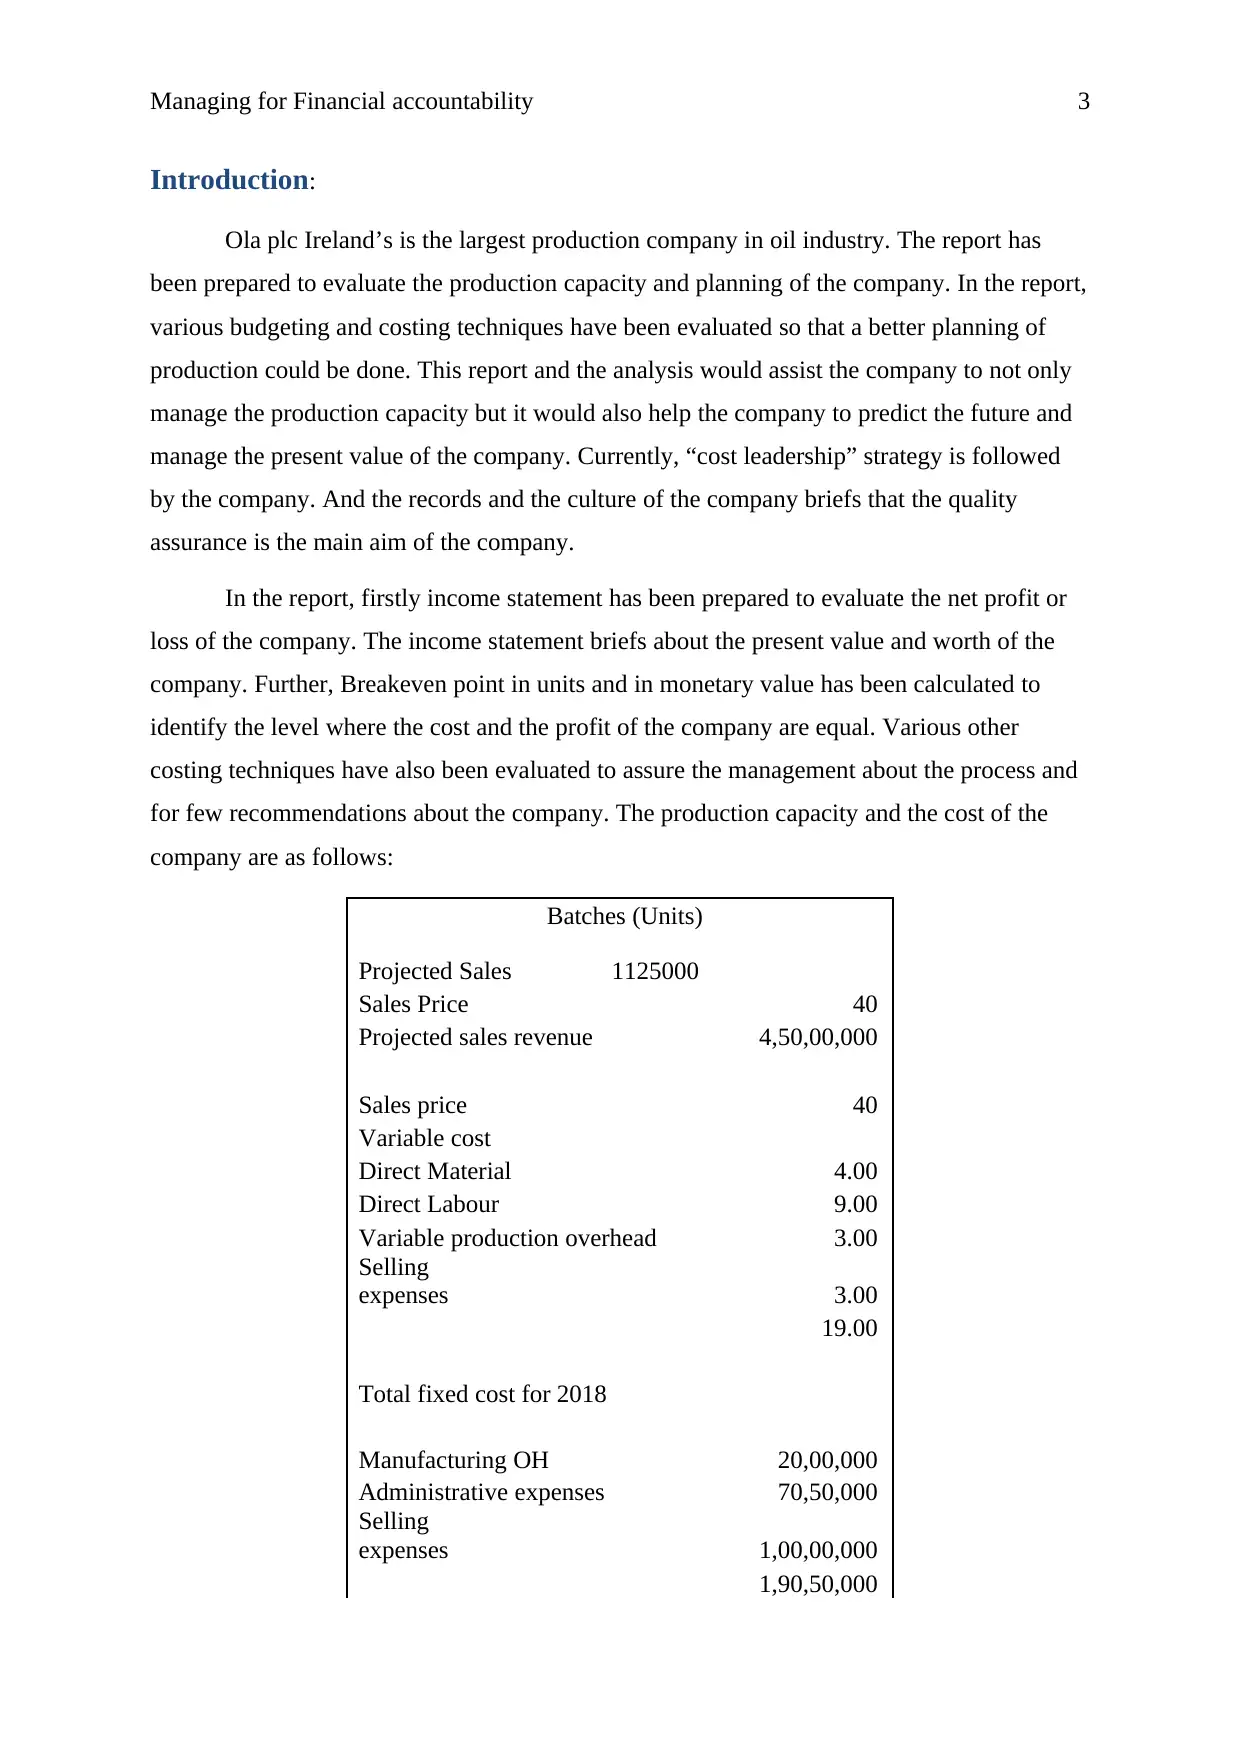
Ola plc Ireland’s is the largest production company in oil industry. The report has
been prepared to evaluate the production capacity and planning of the company. In the report,
various budgeting and costing techniques have been evaluated so that a better planning of
production could be done. This report and the analysis would assist the company to not only
manage the production capacity but it would also help the company to predict the future and
manage the present value of the company. Currently, “cost leadership” strategy is followed
by the company. And the records and the culture of the company briefs that the quality
assurance is the main aim of the company.
In the report, firstly income statement has been prepared to evaluate the net profit or
loss of the company. The income statement briefs about the present value and worth of the
company. Further, Breakeven point in units and in monetary value has been calculated to
identify the level where the cost and the profit of the company are equal. Various other
costing techniques have also been evaluated to assure the management about the process and
for few recommendations about the company. The production capacity and the cost of the
company are as follows:
Batches (Units)
Projected Sales 1125000
Sales Price 40
Projected sales revenue 4,50,00,000
Sales price 40
Variable cost
Direct Material 4.00
Direct Labour 9.00
Variable production overhead 3.00
Selling
expenses 3.00
19.00
Total fixed cost for 2018
Manufacturing OH 20,00,000
Administrative expenses 70,50,000
Selling
expenses 1,00,00,000
1,90,50,000
Introduction:
Ola plc Ireland’s is the largest production company in oil industry. The report has
been prepared to evaluate the production capacity and planning of the company. In the report,
various budgeting and costing techniques have been evaluated so that a better planning of
production could be done. This report and the analysis would assist the company to not only
manage the production capacity but it would also help the company to predict the future and
manage the present value of the company. Currently, “cost leadership” strategy is followed
by the company. And the records and the culture of the company briefs that the quality
assurance is the main aim of the company.
In the report, firstly income statement has been prepared to evaluate the net profit or
loss of the company. The income statement briefs about the present value and worth of the
company. Further, Breakeven point in units and in monetary value has been calculated to
identify the level where the cost and the profit of the company are equal. Various other
costing techniques have also been evaluated to assure the management about the process and
for few recommendations about the company. The production capacity and the cost of the
company are as follows:
Batches (Units)
Projected Sales 1125000
Sales Price 40
Projected sales revenue 4,50,00,000
Sales price 40
Variable cost
Direct Material 4.00
Direct Labour 9.00
Variable production overhead 3.00
Selling
expenses 3.00
19.00
Total fixed cost for 2018
Manufacturing OH 20,00,000
Administrative expenses 70,50,000
Selling
expenses 1,00,00,000
1,90,50,000
⊘ This is a preview!⊘
Do you want full access?
Subscribe today to unlock all pages.
Trusted by 1+ million students worldwide
Managing for Financial accountability 4
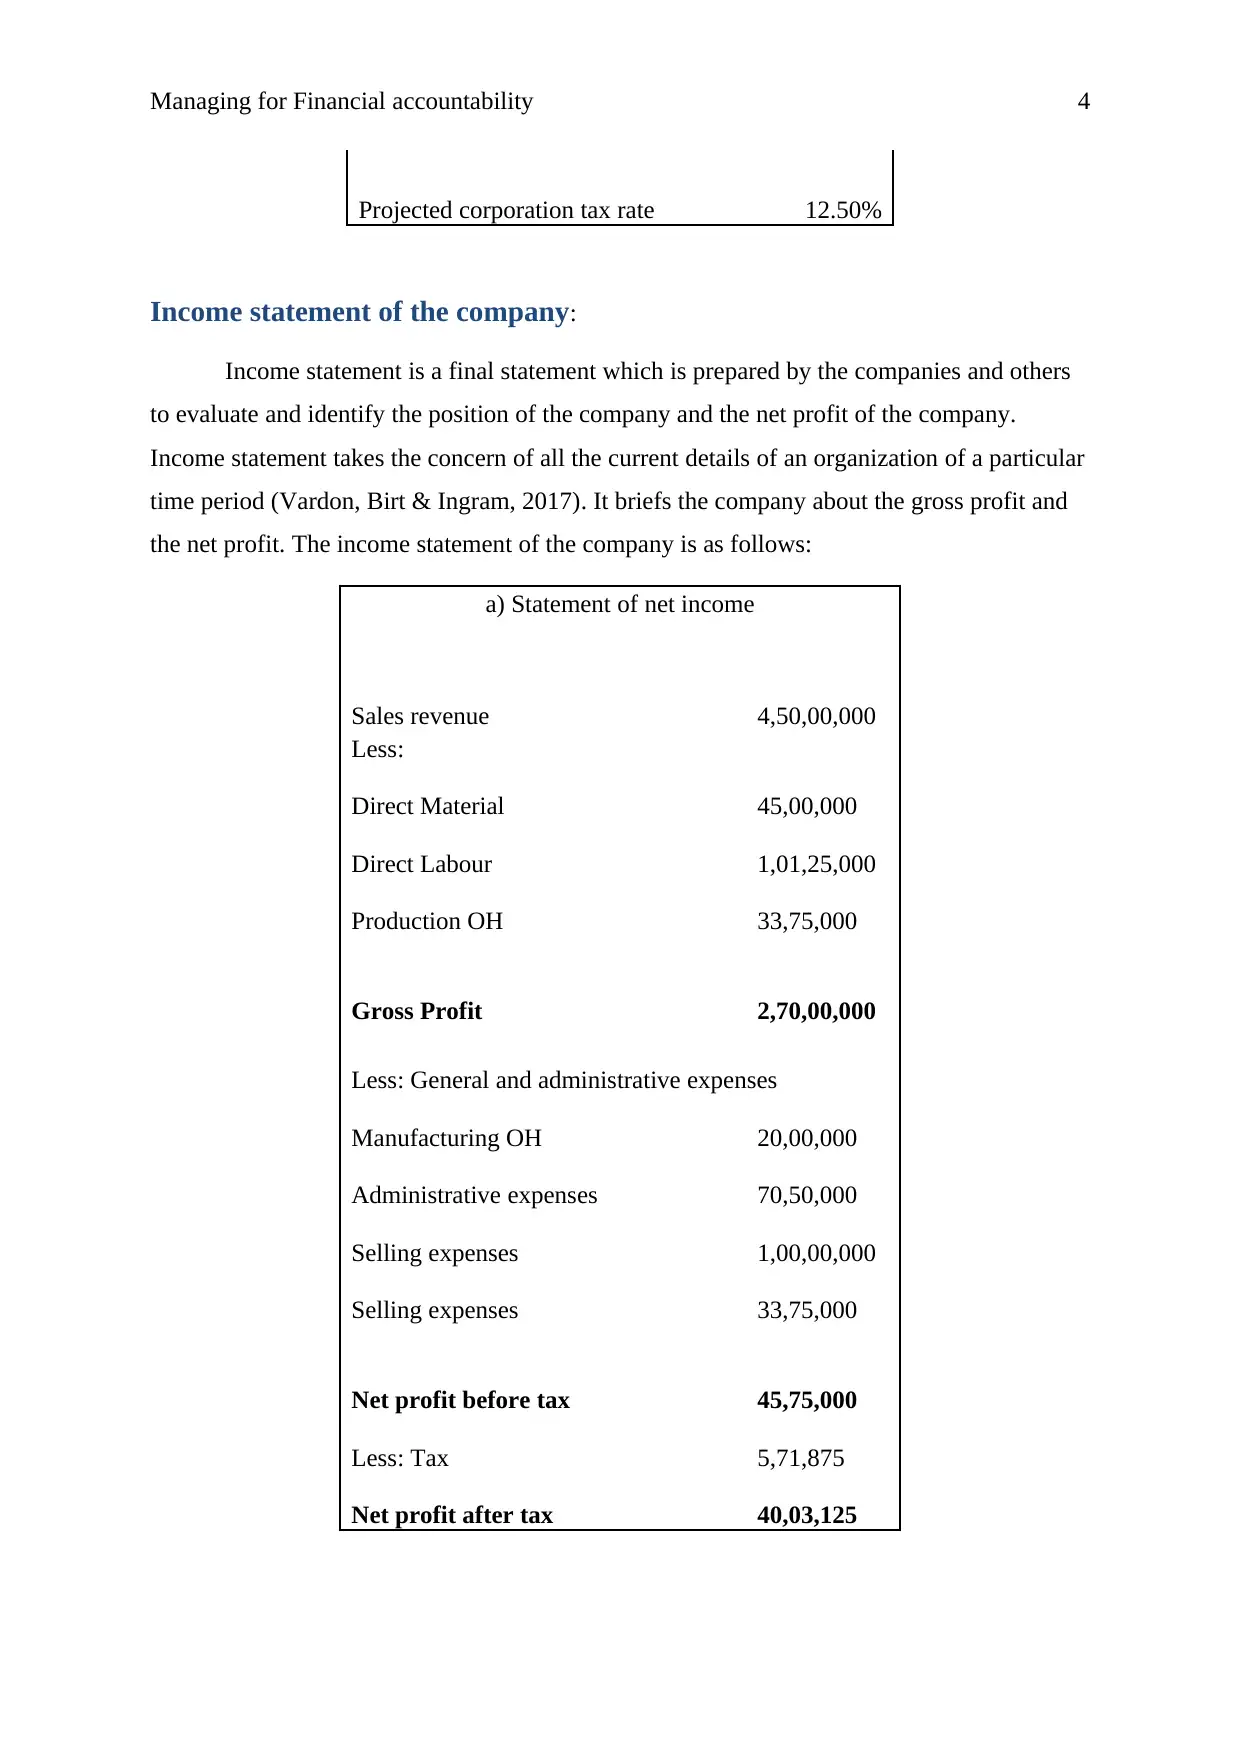
Projected corporation tax rate 12.50%
Income statement of the company:
Income statement is a final statement which is prepared by the companies and others
to evaluate and identify the position of the company and the net profit of the company.
Income statement takes the concern of all the current details of an organization of a particular
time period (Vardon, Birt & Ingram, 2017). It briefs the company about the gross profit and
the net profit. The income statement of the company is as follows:
a) Statement of net income
Sales revenue 4,50,00,000
Less:
Direct Material 45,00,000
Direct Labour 1,01,25,000
Production OH 33,75,000
Gross Profit 2,70,00,000
Less: General and administrative expenses
Manufacturing OH 20,00,000
Administrative expenses 70,50,000
Selling expenses 1,00,00,000
Selling expenses 33,75,000
Net profit before tax 45,75,000
Less: Tax 5,71,875
Net profit after tax 40,03,125
Paraphrase This Document
Need a fresh take? Get an instant paraphrase of this document with our AI Paraphraser
Managing for Financial accountability 5
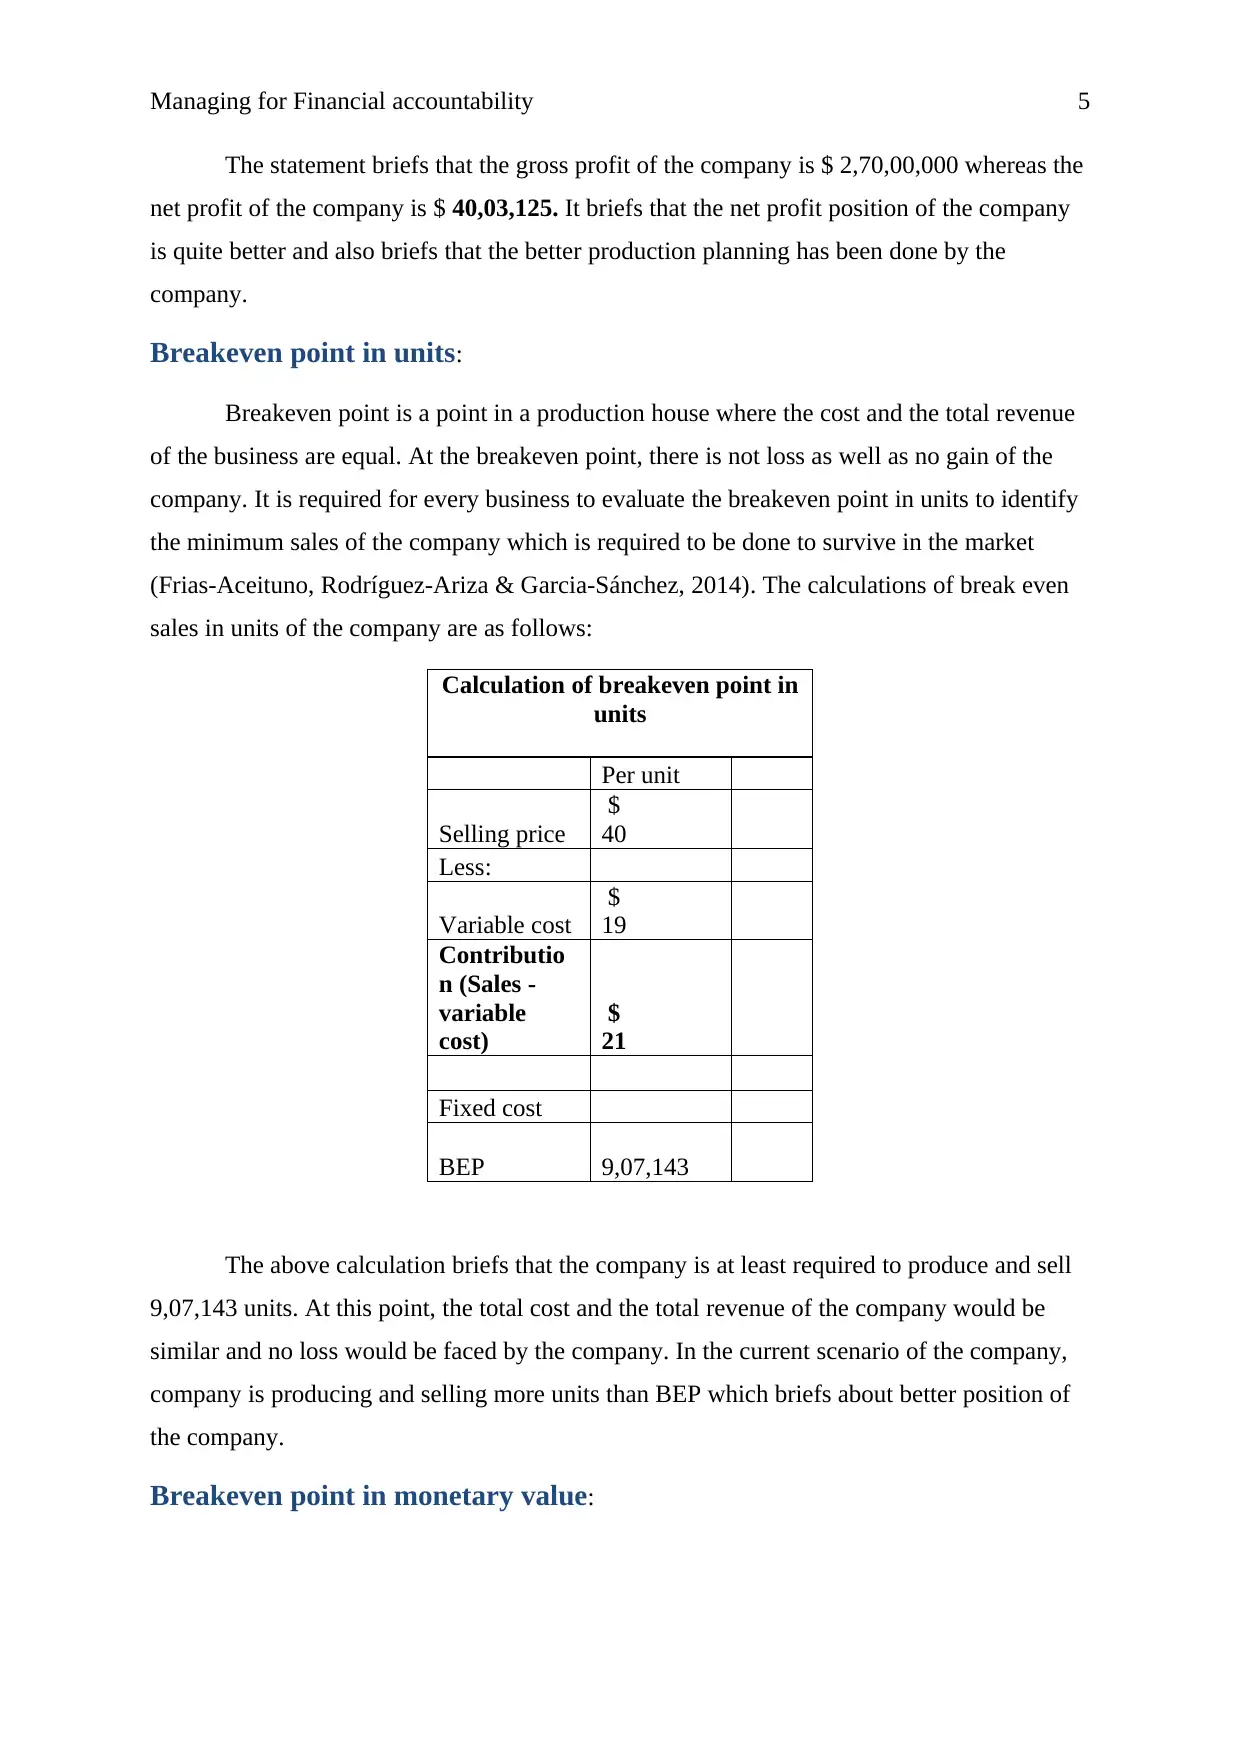
The statement briefs that the gross profit of the company is $ 2,70,00,000 whereas the
net profit of the company is $ 40,03,125. It briefs that the net profit position of the company
is quite better and also briefs that the better production planning has been done by the
company.
Breakeven point in units:
Breakeven point is a point in a production house where the cost and the total revenue
of the business are equal. At the breakeven point, there is not loss as well as no gain of the
company. It is required for every business to evaluate the breakeven point in units to identify
the minimum sales of the company which is required to be done to survive in the market
(Frias‐Aceituno, Rodríguez‐Ariza & Garcia‐Sánchez, 2014). The calculations of break even
sales in units of the company are as follows:
Calculation of breakeven point in
units
Per unit
Selling price
$
40
Less:
Variable cost
$
19
Contributio
n (Sales -
variable
cost)
$
21
Fixed cost
BEP 9,07,143
The above calculation briefs that the company is at least required to produce and sell
9,07,143 units. At this point, the total cost and the total revenue of the company would be
similar and no loss would be faced by the company. In the current scenario of the company,
company is producing and selling more units than BEP which briefs about better position of
the company.
Breakeven point in monetary value:
Managing for Financial accountability 6
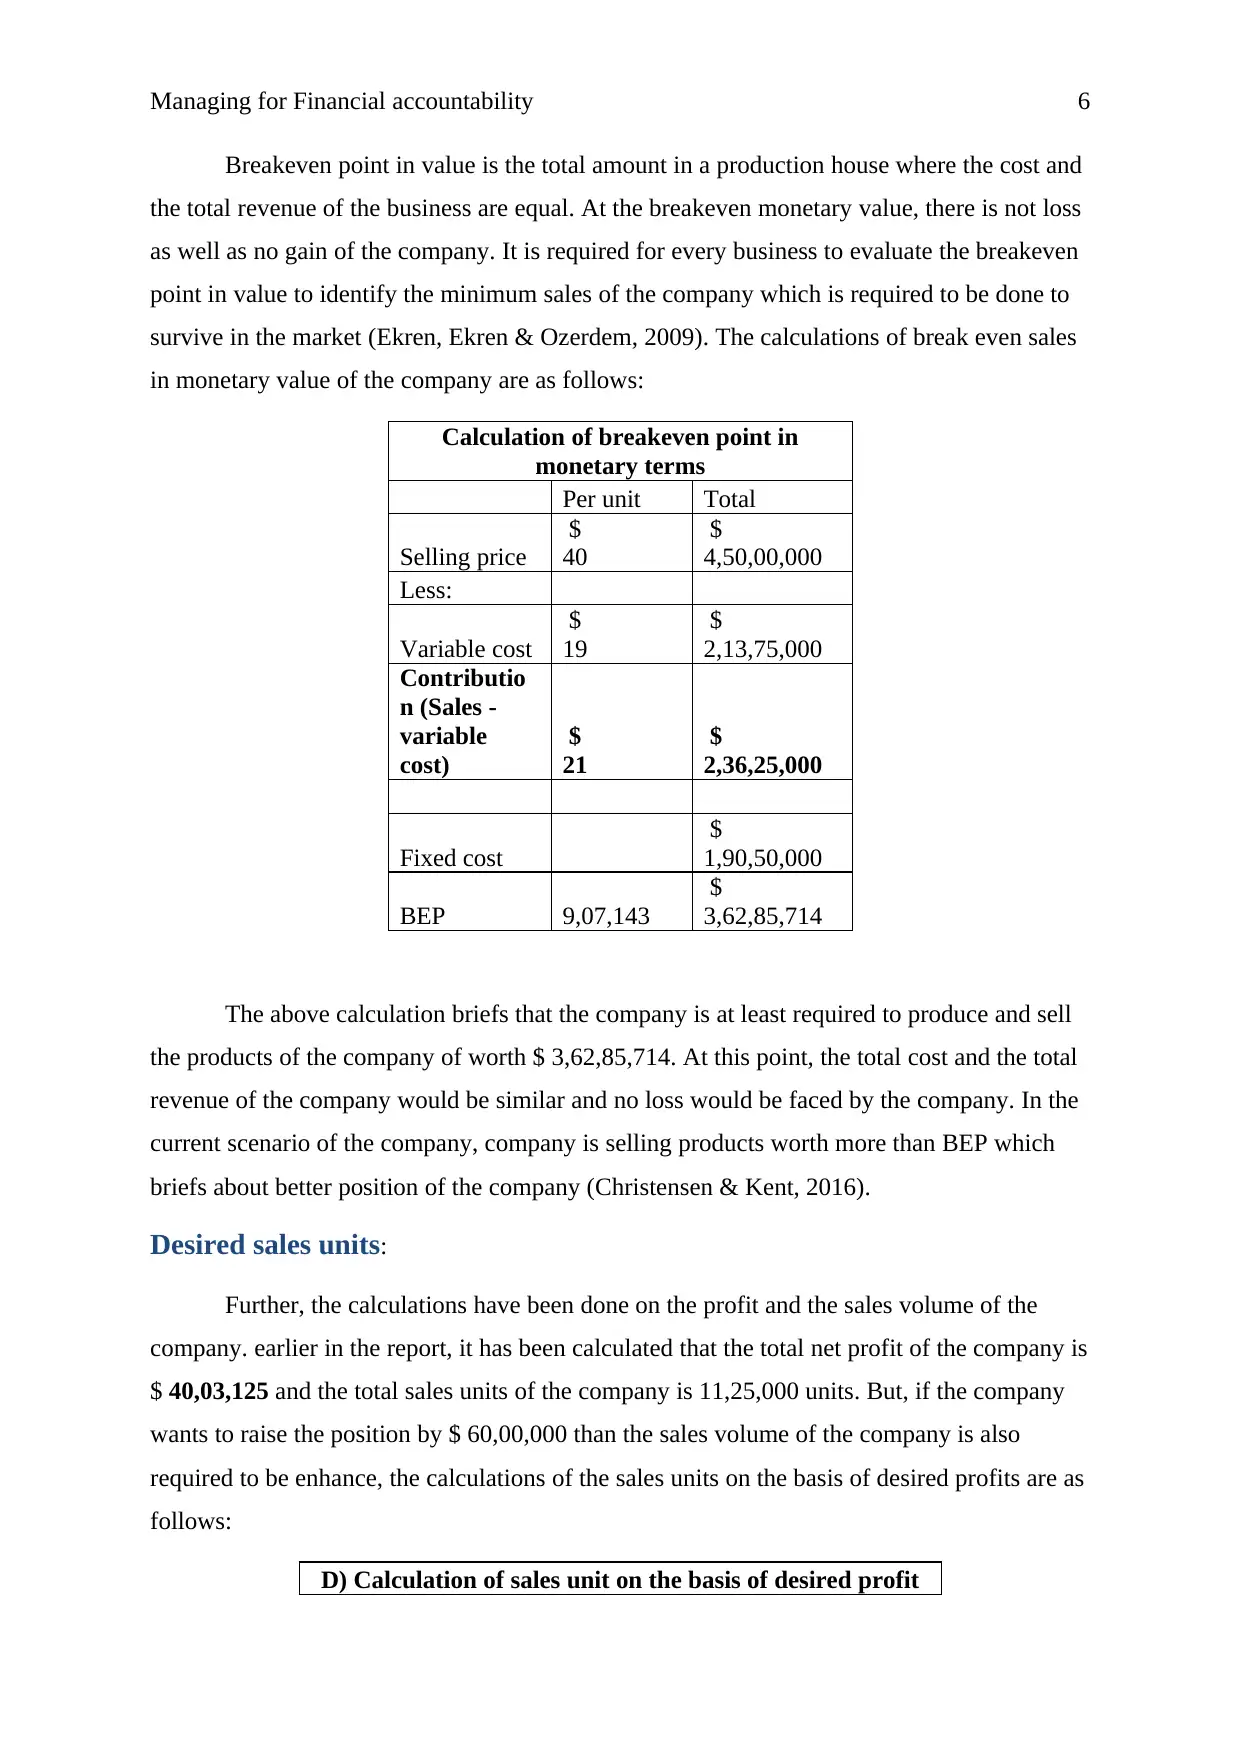
Breakeven point in value is the total amount in a production house where the cost and
the total revenue of the business are equal. At the breakeven monetary value, there is not loss
as well as no gain of the company. It is required for every business to evaluate the breakeven
point in value to identify the minimum sales of the company which is required to be done to
survive in the market (Ekren, Ekren & Ozerdem, 2009). The calculations of break even sales
in monetary value of the company are as follows:
Calculation of breakeven point in
monetary terms
Per unit Total
Selling price
$
40
$
4,50,00,000
Less:
Variable cost
$
19
$
2,13,75,000
Contributio
n (Sales -
variable
cost)
$
21
$
2,36,25,000
Fixed cost
$
1,90,50,000
BEP 9,07,143
$
3,62,85,714
The above calculation briefs that the company is at least required to produce and sell
the products of the company of worth $ 3,62,85,714. At this point, the total cost and the total
revenue of the company would be similar and no loss would be faced by the company. In the
current scenario of the company, company is selling products worth more than BEP which
briefs about better position of the company (Christensen & Kent, 2016).
Desired sales units:
Further, the calculations have been done on the profit and the sales volume of the
company. earlier in the report, it has been calculated that the total net profit of the company is
$ 40,03,125 and the total sales units of the company is 11,25,000 units. But, if the company
wants to raise the position by $ 60,00,000 than the sales volume of the company is also
required to be enhance, the calculations of the sales units on the basis of desired profits are as
follows:
D) Calculation of sales unit on the basis of desired profit
⊘ This is a preview!⊘
Do you want full access?
Subscribe today to unlock all pages.
Trusted by 1+ million students worldwide
Managing for Financial accountability 7
Per unit
Selling price
$
40
Less:
Variable cost
$
19
Contribution (Sales -
variable cost)
$
21
Fixed cost
BEP 9,07,143
Desired Profit
Sales units to achieve the
desired profit (Desired profit
/ contribution + sales units) 11,92,857.14
(Nobes & Parker, 2008)
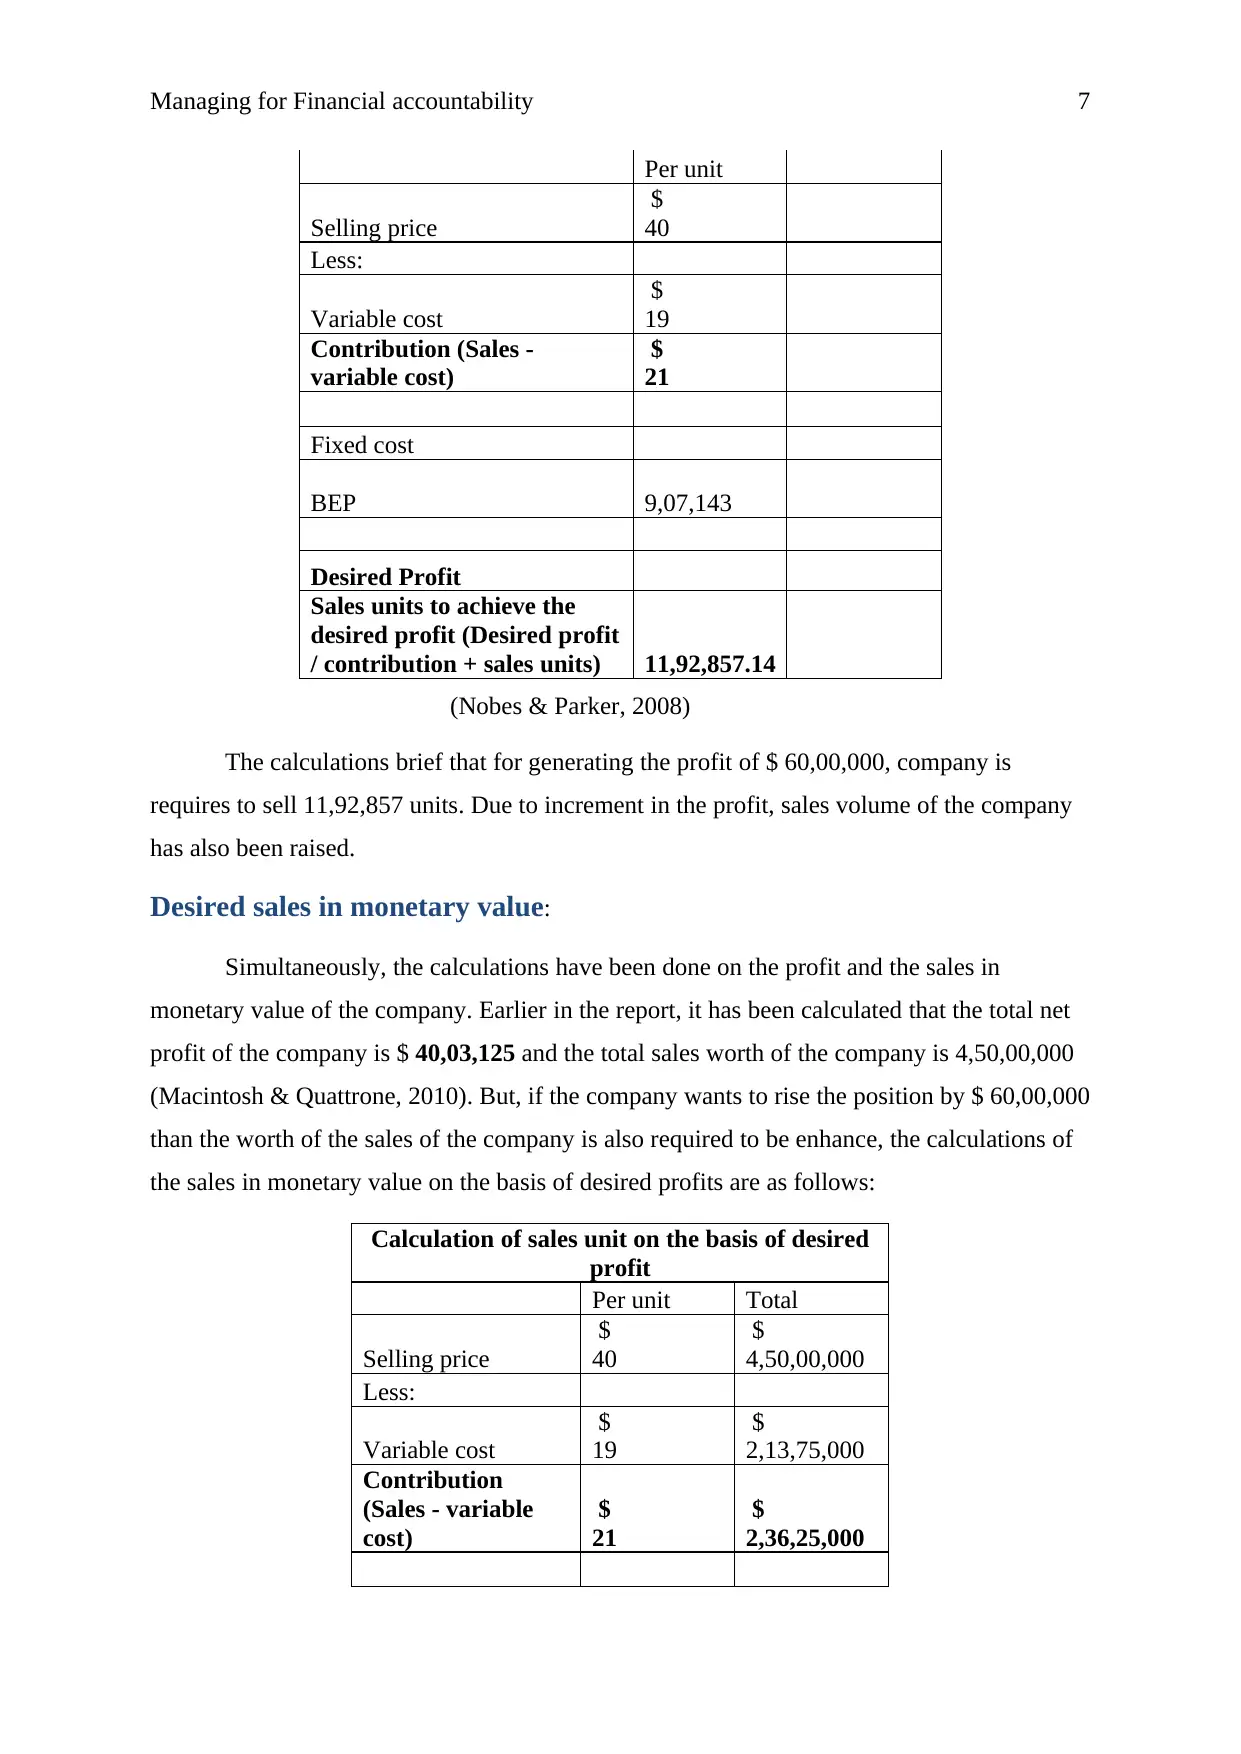
The calculations brief that for generating the profit of $ 60,00,000, company is
requires to sell 11,92,857 units. Due to increment in the profit, sales volume of the company
has also been raised.
Desired sales in monetary value:
Simultaneously, the calculations have been done on the profit and the sales in
monetary value of the company. Earlier in the report, it has been calculated that the total net
profit of the company is $ 40,03,125 and the total sales worth of the company is 4,50,00,000
(Macintosh & Quattrone, 2010). But, if the company wants to rise the position by $ 60,00,000
than the worth of the sales of the company is also required to be enhance, the calculations of
the sales in monetary value on the basis of desired profits are as follows:
Calculation of sales unit on the basis of desired
profit
Per unit Total
Selling price
$
40
$
4,50,00,000
Less:
Variable cost
$
19
$
2,13,75,000
Contribution
(Sales - variable
cost)
$
21
$
2,36,25,000
Per unit
Selling price
$
40
Less:
Variable cost
$
19
Contribution (Sales -
variable cost)
$
21
Fixed cost
BEP 9,07,143
Desired Profit
Sales units to achieve the
desired profit (Desired profit
/ contribution + sales units) 11,92,857.14
(Nobes & Parker, 2008)
The calculations brief that for generating the profit of $ 60,00,000, company is
requires to sell 11,92,857 units. Due to increment in the profit, sales volume of the company
has also been raised.
Desired sales in monetary value:
Simultaneously, the calculations have been done on the profit and the sales in
monetary value of the company. Earlier in the report, it has been calculated that the total net
profit of the company is $ 40,03,125 and the total sales worth of the company is 4,50,00,000
(Macintosh & Quattrone, 2010). But, if the company wants to rise the position by $ 60,00,000
than the worth of the sales of the company is also required to be enhance, the calculations of
the sales in monetary value on the basis of desired profits are as follows:
Calculation of sales unit on the basis of desired
profit
Per unit Total
Selling price
$
40
$
4,50,00,000
Less:
Variable cost
$
19
$
2,13,75,000
Contribution
(Sales - variable
cost)
$
21
$
2,36,25,000
Paraphrase This Document
Need a fresh take? Get an instant paraphrase of this document with our AI Paraphraser
Managing for Financial accountability 8
Fixed cost
$
1,90,50,000
BEP 9,07,143
$
3,62,85,714
Desired Profit
$
60,00,000
Sales units to
achieve the desired
profit (Desired
profit /
contribution +
sales units) 11,92,857.14
$
4,77,14,286
(Kieso, Weygandt & Warfield, 2010)
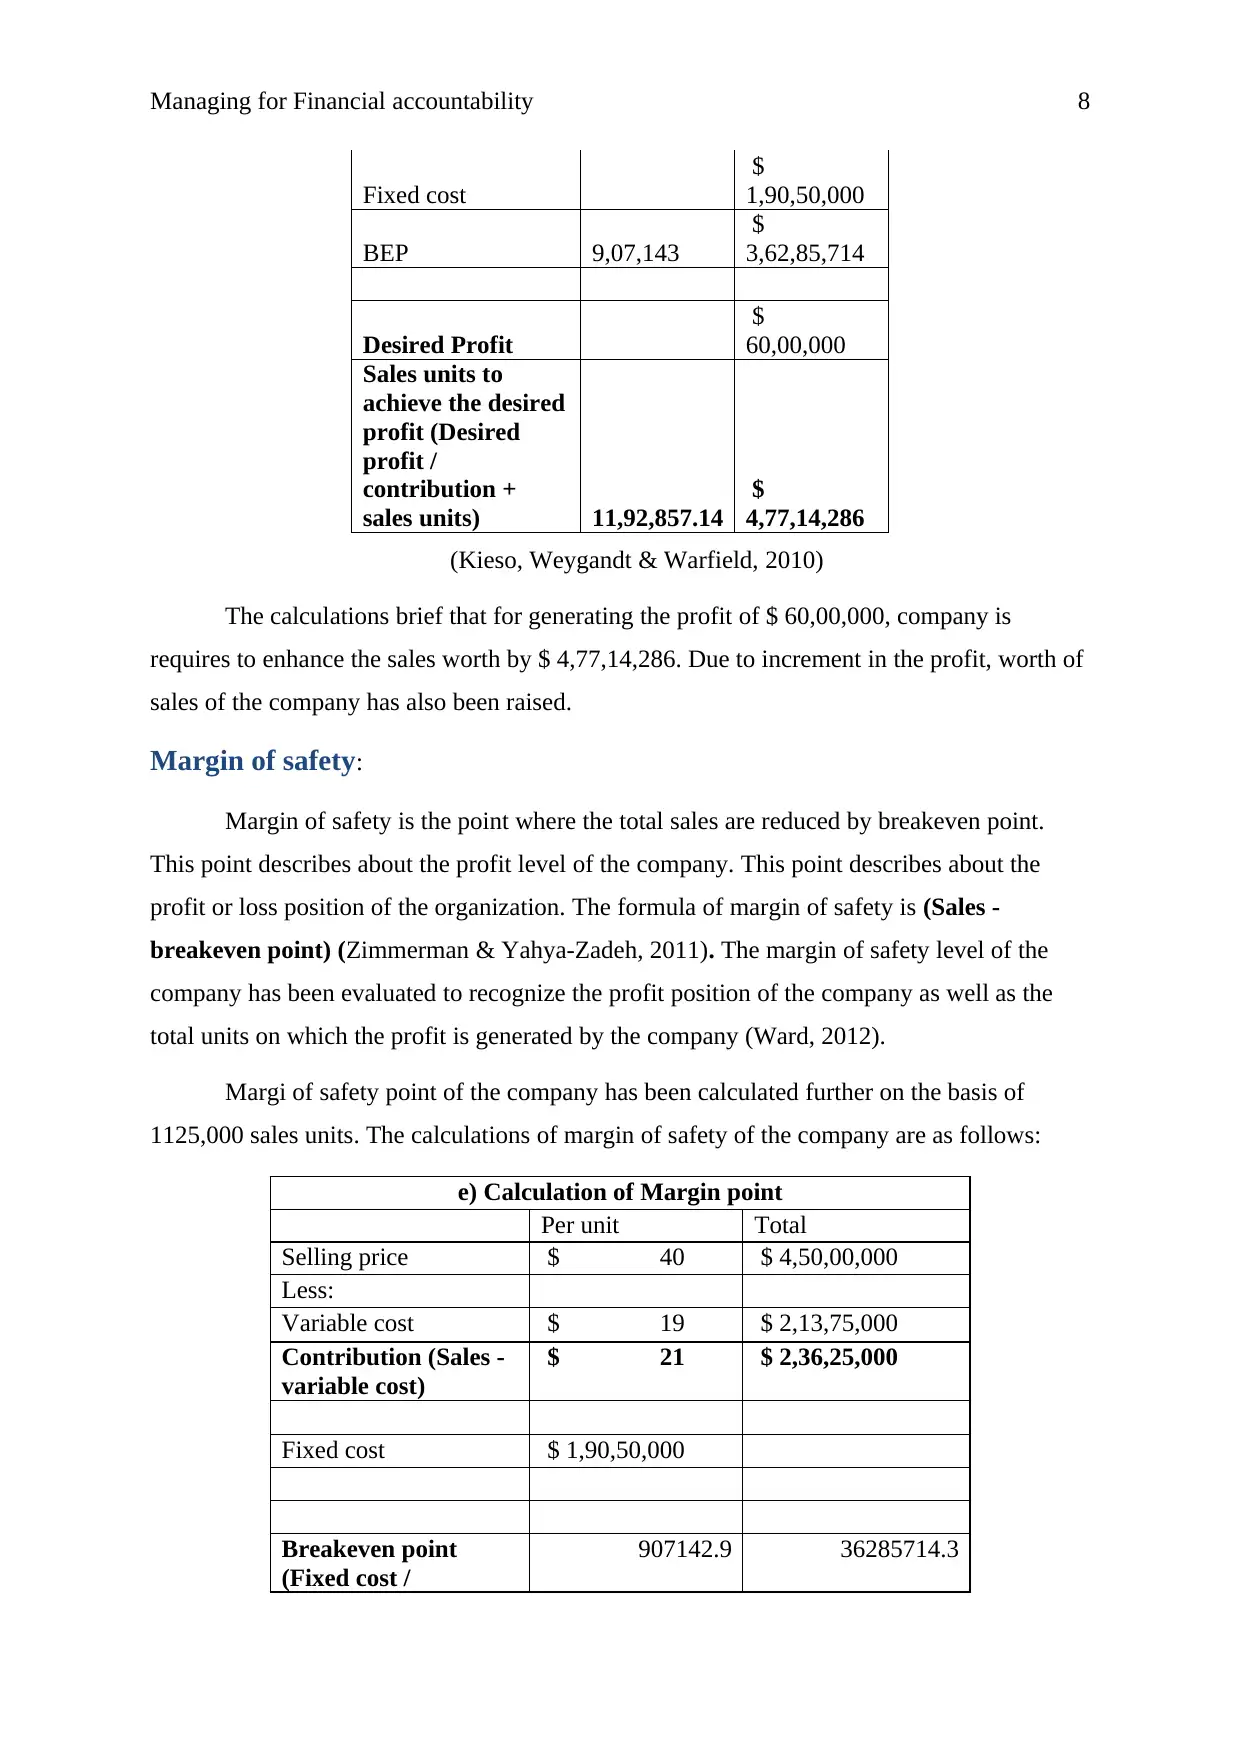
The calculations brief that for generating the profit of $ 60,00,000, company is
requires to enhance the sales worth by $ 4,77,14,286. Due to increment in the profit, worth of
sales of the company has also been raised.
Margin of safety:
Margin of safety is the point where the total sales are reduced by breakeven point.
This point describes about the profit level of the company. This point describes about the
profit or loss position of the organization. The formula of margin of safety is (Sales -
breakeven point) (Zimmerman & Yahya-Zadeh, 2011). The margin of safety level of the
company has been evaluated to recognize the profit position of the company as well as the
total units on which the profit is generated by the company (Ward, 2012).
Margi of safety point of the company has been calculated further on the basis of
1125,000 sales units. The calculations of margin of safety of the company are as follows:
e) Calculation of Margin point
Per unit Total
Selling price $ 40 $ 4,50,00,000
Less:
Variable cost $ 19 $ 2,13,75,000
Contribution (Sales -
variable cost)
$ 21 $ 2,36,25,000
Fixed cost $ 1,90,50,000
Breakeven point
(Fixed cost /
907142.9 36285714.3
Fixed cost
$
1,90,50,000
BEP 9,07,143
$
3,62,85,714
Desired Profit
$
60,00,000
Sales units to
achieve the desired
profit (Desired
profit /
contribution +
sales units) 11,92,857.14
$
4,77,14,286
(Kieso, Weygandt & Warfield, 2010)
The calculations brief that for generating the profit of $ 60,00,000, company is
requires to enhance the sales worth by $ 4,77,14,286. Due to increment in the profit, worth of
sales of the company has also been raised.
Margin of safety:
Margin of safety is the point where the total sales are reduced by breakeven point.
This point describes about the profit level of the company. This point describes about the
profit or loss position of the organization. The formula of margin of safety is (Sales -
breakeven point) (Zimmerman & Yahya-Zadeh, 2011). The margin of safety level of the
company has been evaluated to recognize the profit position of the company as well as the
total units on which the profit is generated by the company (Ward, 2012).
Margi of safety point of the company has been calculated further on the basis of
1125,000 sales units. The calculations of margin of safety of the company are as follows:
e) Calculation of Margin point
Per unit Total
Selling price $ 40 $ 4,50,00,000
Less:
Variable cost $ 19 $ 2,13,75,000
Contribution (Sales -
variable cost)
$ 21 $ 2,36,25,000
Fixed cost $ 1,90,50,000
Breakeven point
(Fixed cost /
907142.9 36285714.3
Managing for Financial accountability 9
contribution)
Margin of safety
(Sales - breakeven
point)
217857.1 $ 87,14,286
(Schaltegger & Burritt, 2017)
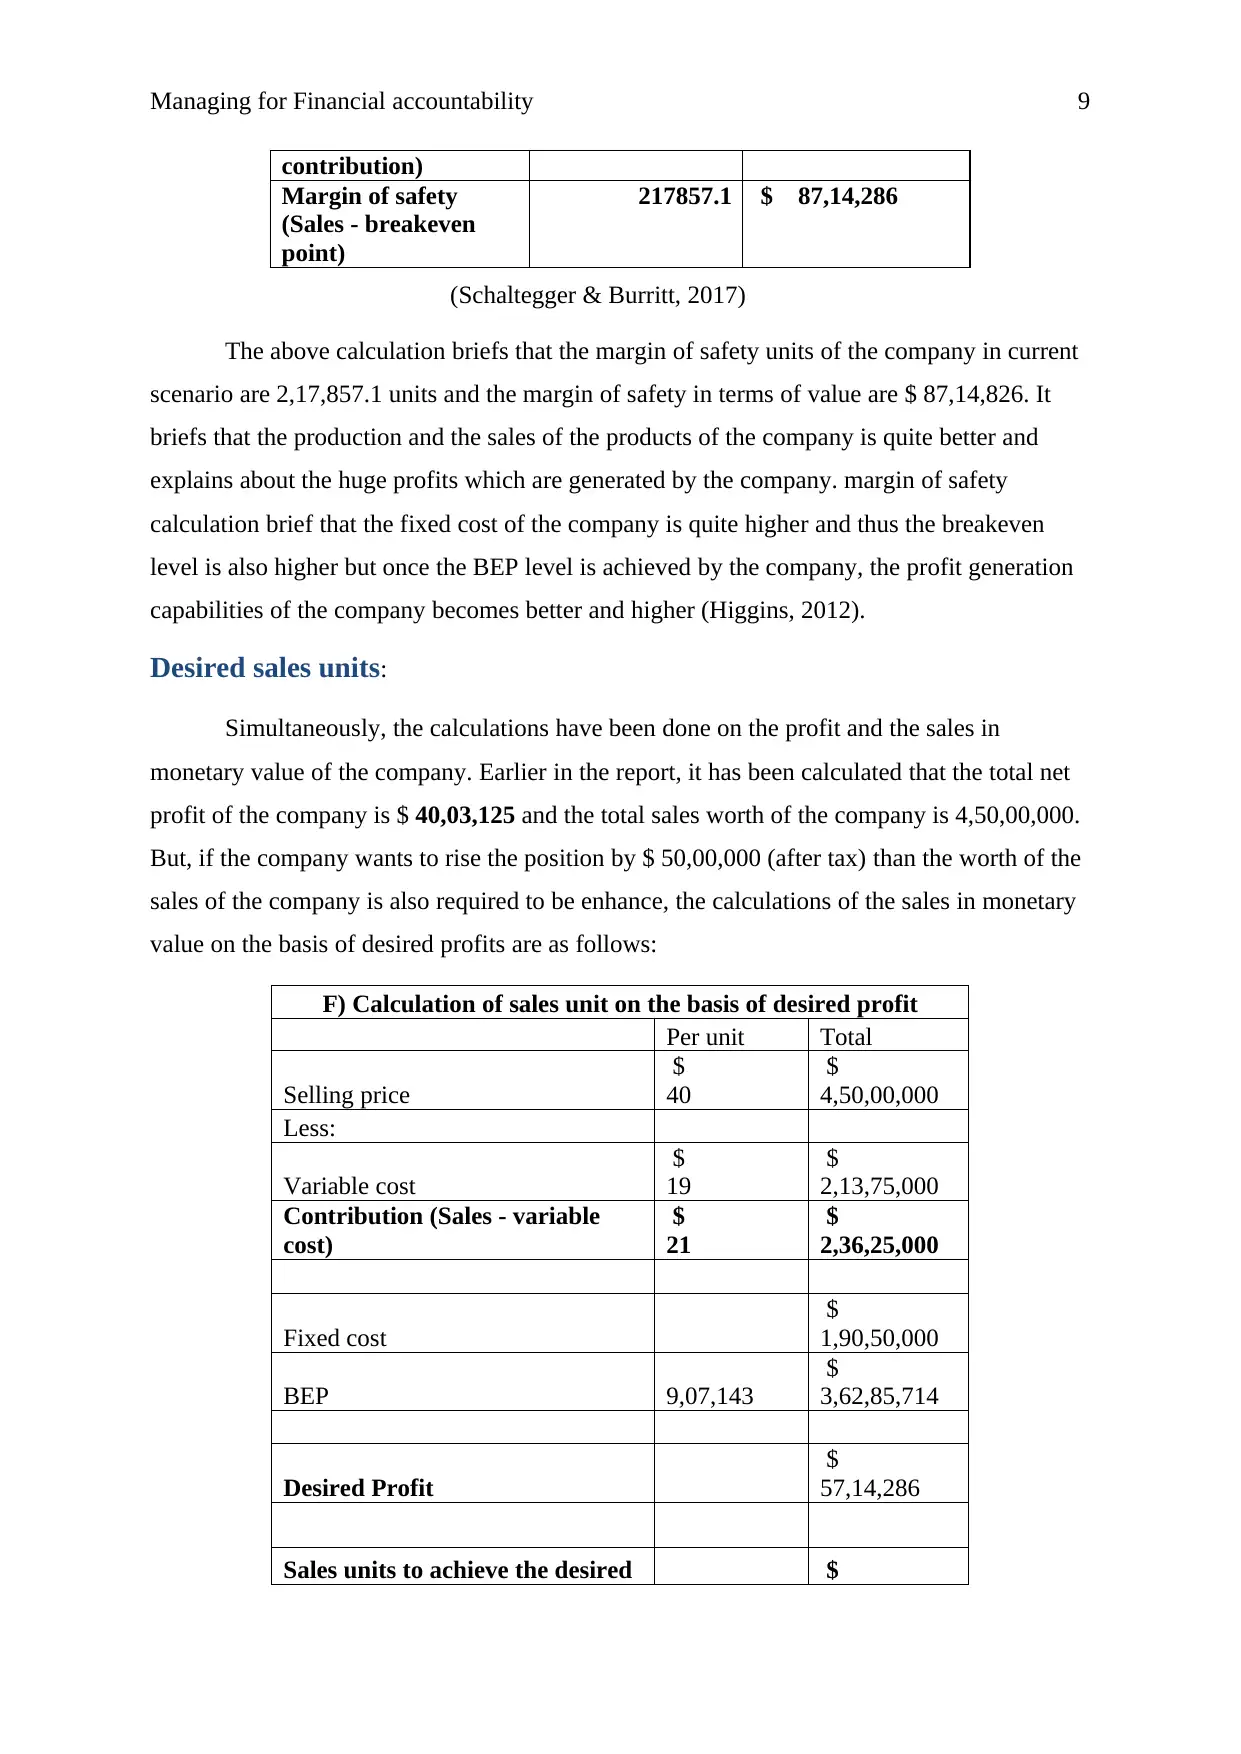
The above calculation briefs that the margin of safety units of the company in current
scenario are 2,17,857.1 units and the margin of safety in terms of value are $ 87,14,826. It
briefs that the production and the sales of the products of the company is quite better and
explains about the huge profits which are generated by the company. margin of safety
calculation brief that the fixed cost of the company is quite higher and thus the breakeven
level is also higher but once the BEP level is achieved by the company, the profit generation
capabilities of the company becomes better and higher (Higgins, 2012).
Desired sales units:
Simultaneously, the calculations have been done on the profit and the sales in
monetary value of the company. Earlier in the report, it has been calculated that the total net
profit of the company is $ 40,03,125 and the total sales worth of the company is 4,50,00,000.
But, if the company wants to rise the position by $ 50,00,000 (after tax) than the worth of the
sales of the company is also required to be enhance, the calculations of the sales in monetary
value on the basis of desired profits are as follows:
F) Calculation of sales unit on the basis of desired profit
Per unit Total
Selling price
$
40
$
4,50,00,000
Less:
Variable cost
$
19
$
2,13,75,000
Contribution (Sales - variable
cost)
$
21
$
2,36,25,000
Fixed cost
$
1,90,50,000
BEP 9,07,143
$
3,62,85,714
Desired Profit
$
57,14,286
Sales units to achieve the desired $
contribution)
Margin of safety
(Sales - breakeven
point)
217857.1 $ 87,14,286
(Schaltegger & Burritt, 2017)
The above calculation briefs that the margin of safety units of the company in current
scenario are 2,17,857.1 units and the margin of safety in terms of value are $ 87,14,826. It
briefs that the production and the sales of the products of the company is quite better and
explains about the huge profits which are generated by the company. margin of safety
calculation brief that the fixed cost of the company is quite higher and thus the breakeven
level is also higher but once the BEP level is achieved by the company, the profit generation
capabilities of the company becomes better and higher (Higgins, 2012).
Desired sales units:
Simultaneously, the calculations have been done on the profit and the sales in
monetary value of the company. Earlier in the report, it has been calculated that the total net
profit of the company is $ 40,03,125 and the total sales worth of the company is 4,50,00,000.
But, if the company wants to rise the position by $ 50,00,000 (after tax) than the worth of the
sales of the company is also required to be enhance, the calculations of the sales in monetary
value on the basis of desired profits are as follows:
F) Calculation of sales unit on the basis of desired profit
Per unit Total
Selling price
$
40
$
4,50,00,000
Less:
Variable cost
$
19
$
2,13,75,000
Contribution (Sales - variable
cost)
$
21
$
2,36,25,000
Fixed cost
$
1,90,50,000
BEP 9,07,143
$
3,62,85,714
Desired Profit
$
57,14,286
Sales units to achieve the desired $
⊘ This is a preview!⊘
Do you want full access?
Subscribe today to unlock all pages.
Trusted by 1+ million students worldwide
Managing for Financial accountability 10
profit (Desired profit /
contribution + sales units) 11,79,251.70 4,71,70,068
(Renz & Herman, 2016)
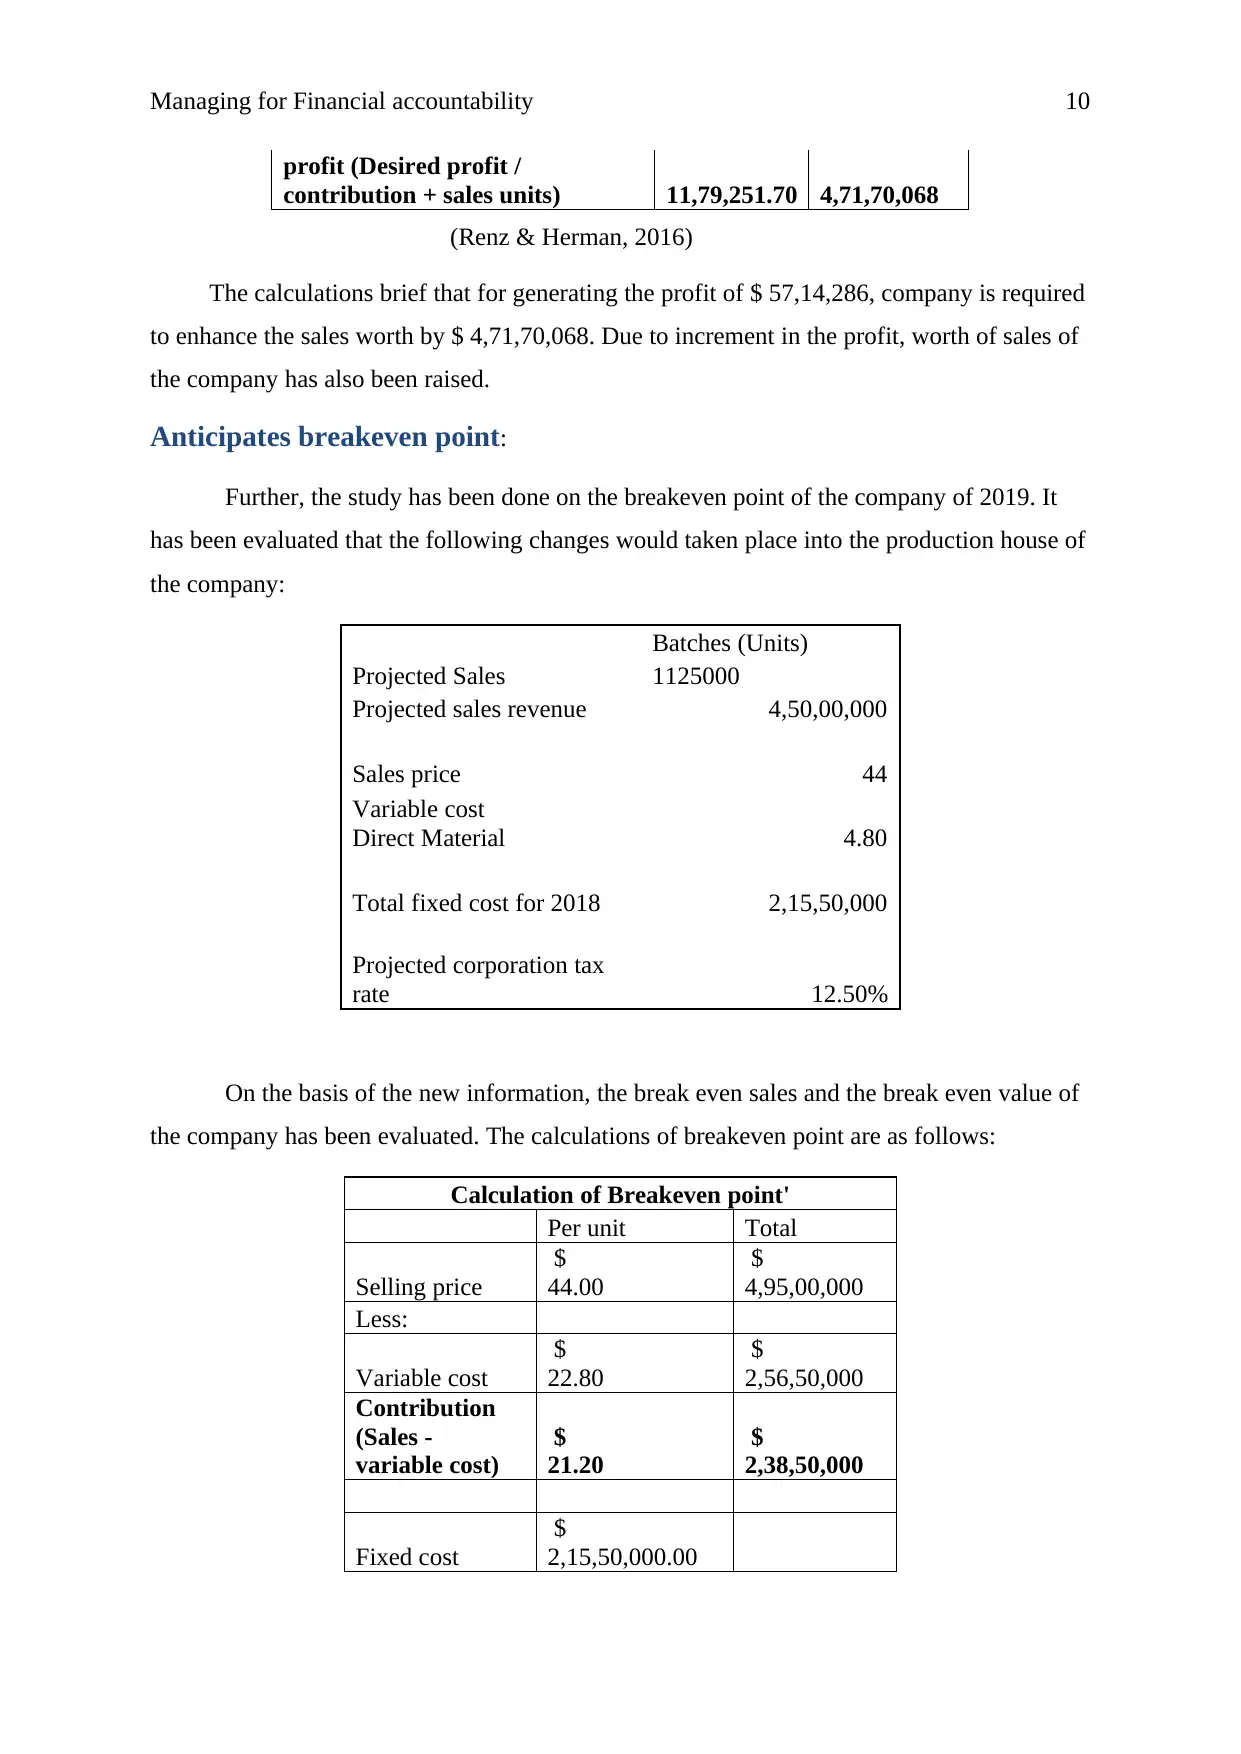
The calculations brief that for generating the profit of $ 57,14,286, company is required
to enhance the sales worth by $ 4,71,70,068. Due to increment in the profit, worth of sales of
the company has also been raised.
Anticipates breakeven point:
Further, the study has been done on the breakeven point of the company of 2019. It
has been evaluated that the following changes would taken place into the production house of
the company:
Batches (Units)
Projected Sales 1125000
Projected sales revenue 4,50,00,000
Sales price 44
Variable cost
Direct Material 4.80
Total fixed cost for 2018 2,15,50,000
Projected corporation tax
rate 12.50%
On the basis of the new information, the break even sales and the break even value of
the company has been evaluated. The calculations of breakeven point are as follows:
Calculation of Breakeven point'
Per unit Total
Selling price
$
44.00
$
4,95,00,000
Less:
Variable cost
$
22.80
$
2,56,50,000
Contribution
(Sales -
variable cost)
$
21.20
$
2,38,50,000
Fixed cost
$
2,15,50,000.00
profit (Desired profit /
contribution + sales units) 11,79,251.70 4,71,70,068
(Renz & Herman, 2016)
The calculations brief that for generating the profit of $ 57,14,286, company is required
to enhance the sales worth by $ 4,71,70,068. Due to increment in the profit, worth of sales of
the company has also been raised.
Anticipates breakeven point:
Further, the study has been done on the breakeven point of the company of 2019. It
has been evaluated that the following changes would taken place into the production house of
the company:
Batches (Units)
Projected Sales 1125000
Projected sales revenue 4,50,00,000
Sales price 44
Variable cost
Direct Material 4.80
Total fixed cost for 2018 2,15,50,000
Projected corporation tax
rate 12.50%
On the basis of the new information, the break even sales and the break even value of
the company has been evaluated. The calculations of breakeven point are as follows:
Calculation of Breakeven point'
Per unit Total
Selling price
$
44.00
$
4,95,00,000
Less:
Variable cost
$
22.80
$
2,56,50,000
Contribution
(Sales -
variable cost)
$
21.20
$
2,38,50,000
Fixed cost
$
2,15,50,000.00
Paraphrase This Document
Need a fresh take? Get an instant paraphrase of this document with our AI Paraphraser
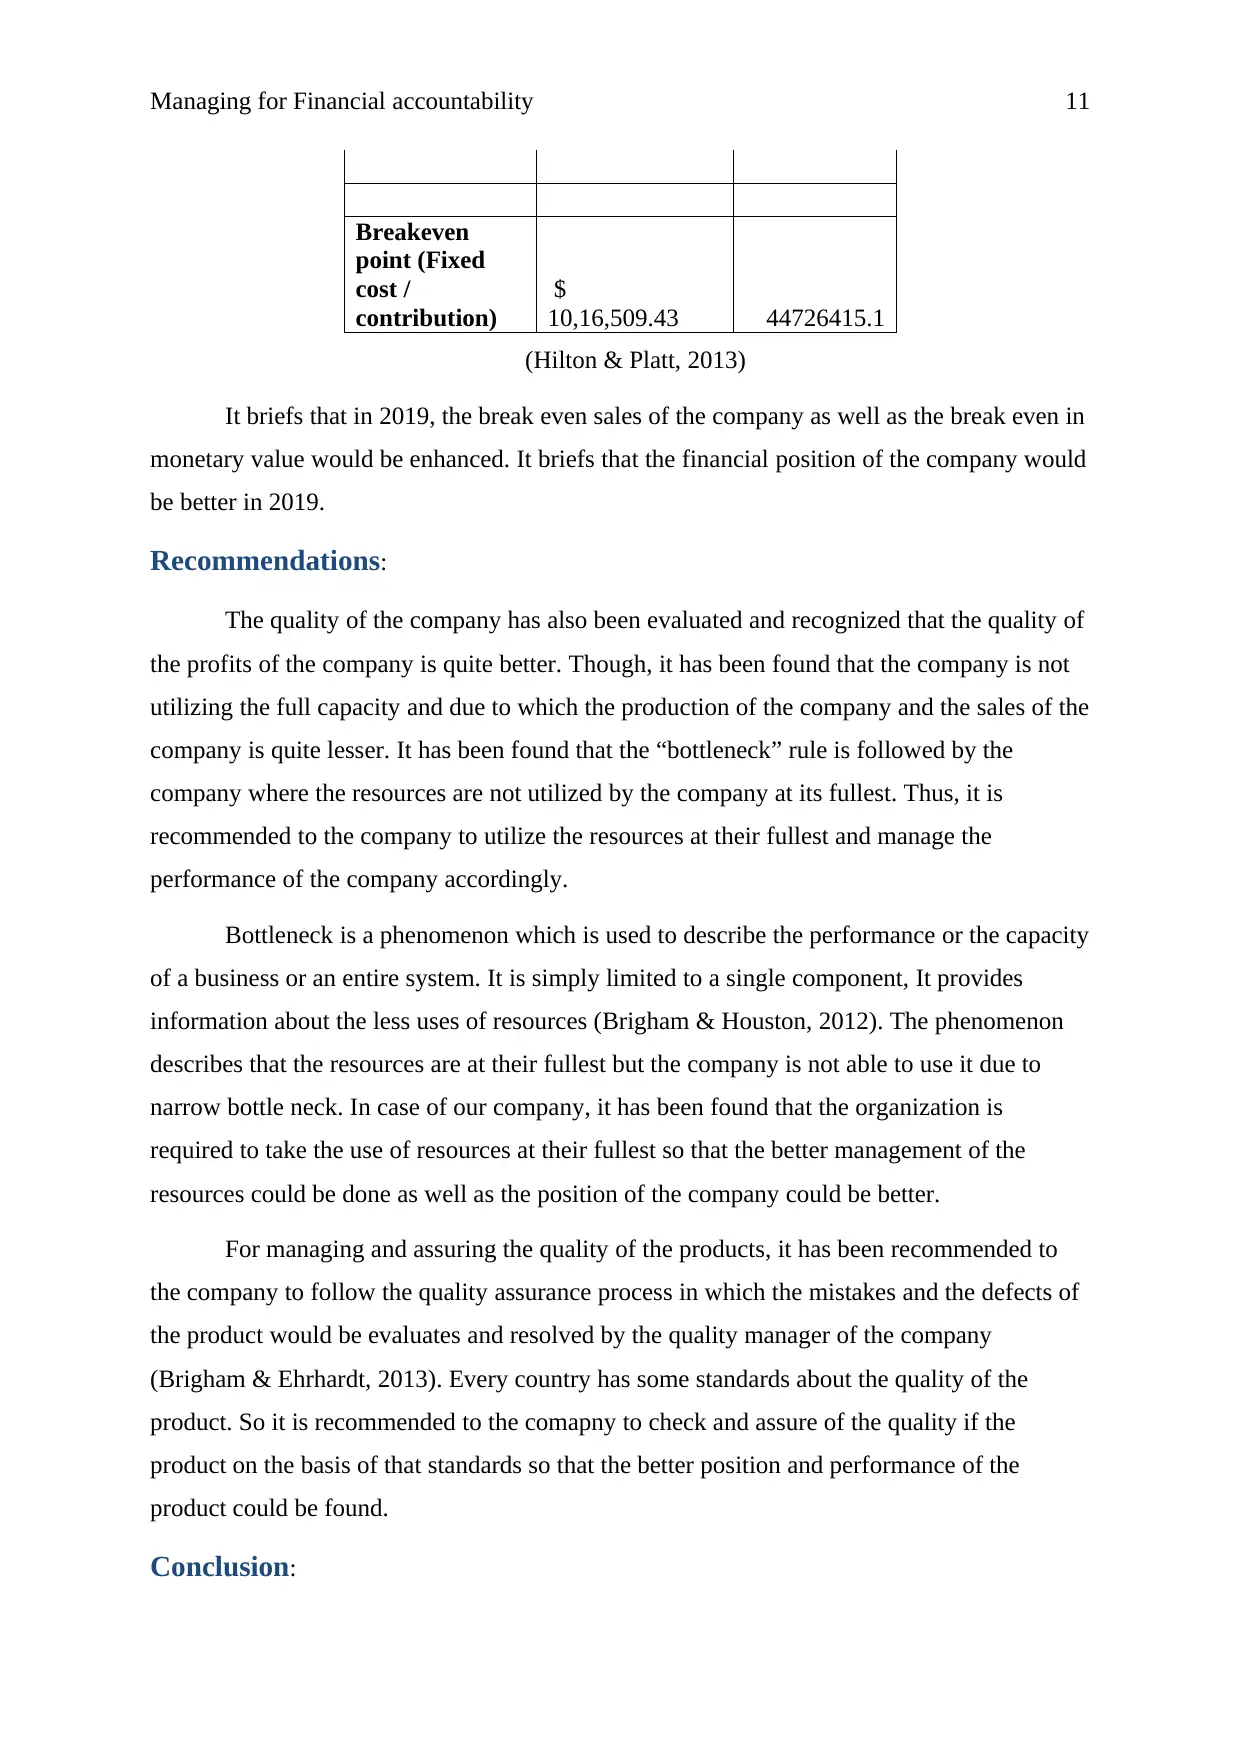
Managing for Financial accountability 11
Breakeven
point (Fixed
cost /
contribution)
$
10,16,509.43 44726415.1
(Hilton & Platt, 2013)
It briefs that in 2019, the break even sales of the company as well as the break even in
monetary value would be enhanced. It briefs that the financial position of the company would
be better in 2019.
Recommendations:
The quality of the company has also been evaluated and recognized that the quality of
the profits of the company is quite better. Though, it has been found that the company is not
utilizing the full capacity and due to which the production of the company and the sales of the
company is quite lesser. It has been found that the “bottleneck” rule is followed by the
company where the resources are not utilized by the company at its fullest. Thus, it is
recommended to the company to utilize the resources at their fullest and manage the
performance of the company accordingly.
Bottleneck is a phenomenon which is used to describe the performance or the capacity
of a business or an entire system. It is simply limited to a single component, It provides
information about the less uses of resources (Brigham & Houston, 2012). The phenomenon
describes that the resources are at their fullest but the company is not able to use it due to
narrow bottle neck. In case of our company, it has been found that the organization is
required to take the use of resources at their fullest so that the better management of the
resources could be done as well as the position of the company could be better.
For managing and assuring the quality of the products, it has been recommended to
the company to follow the quality assurance process in which the mistakes and the defects of
the product would be evaluates and resolved by the quality manager of the company
(Brigham & Ehrhardt, 2013). Every country has some standards about the quality of the
product. So it is recommended to the comapny to check and assure of the quality if the
product on the basis of that standards so that the better position and performance of the
product could be found.
Conclusion:
Managing for Financial accountability 12
To conclude, Ola plc Ireland is performing and managing its production house at a
better level. The income statement of the company briefs about the higher net profits of the
company as well as better position of the company. Further, it has been found that if the
company would utilize the resources at the fullest than the breakeven level of the company
would be lesser than the total sales of the company. It further briefs that the margin of safety
level of the company is also higher which directly briefs about the total profit from the
production process of the company. Breakeven point in units and in monetary value has been
calculated to identify the level where the cost and the profit of the company are equal.
Various other costing techniques have also been evaluated to assure the management about
the process and it has been found that the position and the level of the company s quite better.
The future prediction of the company has also been done to found the future
performance of the company and it has been analyzed that the company would perform better
in near future. The sales price of the company would be enhanced. Though, the variable cost
and fixed cost of the company also briefs about some additional cost. To conclude, the
performance of the position of the company is quite better if the company uses the entire
capacity to produce and sell the product.
⊘ This is a preview!⊘
Do you want full access?
Subscribe today to unlock all pages.
Trusted by 1+ million students worldwide
1 out of 14
Related Documents


Your All-in-One AI-Powered Toolkit for Academic Success.
+13062052269
info@desklib.com
Available 24*7 on WhatsApp / Email
![[object Object]](/_next/static/media/star-bottom.7253800d.svg)
Unlock your academic potential
Copyright © 2020–2026 A2Z Services. All Rights Reserved. Developed and managed by ZUCOL.