OPEC Oil Production, Price, and Compliance Rate Analysis: 2005-2017
VerifiedAdded on  2020/04/07
|19
|2558
|145
Report
AI Summary
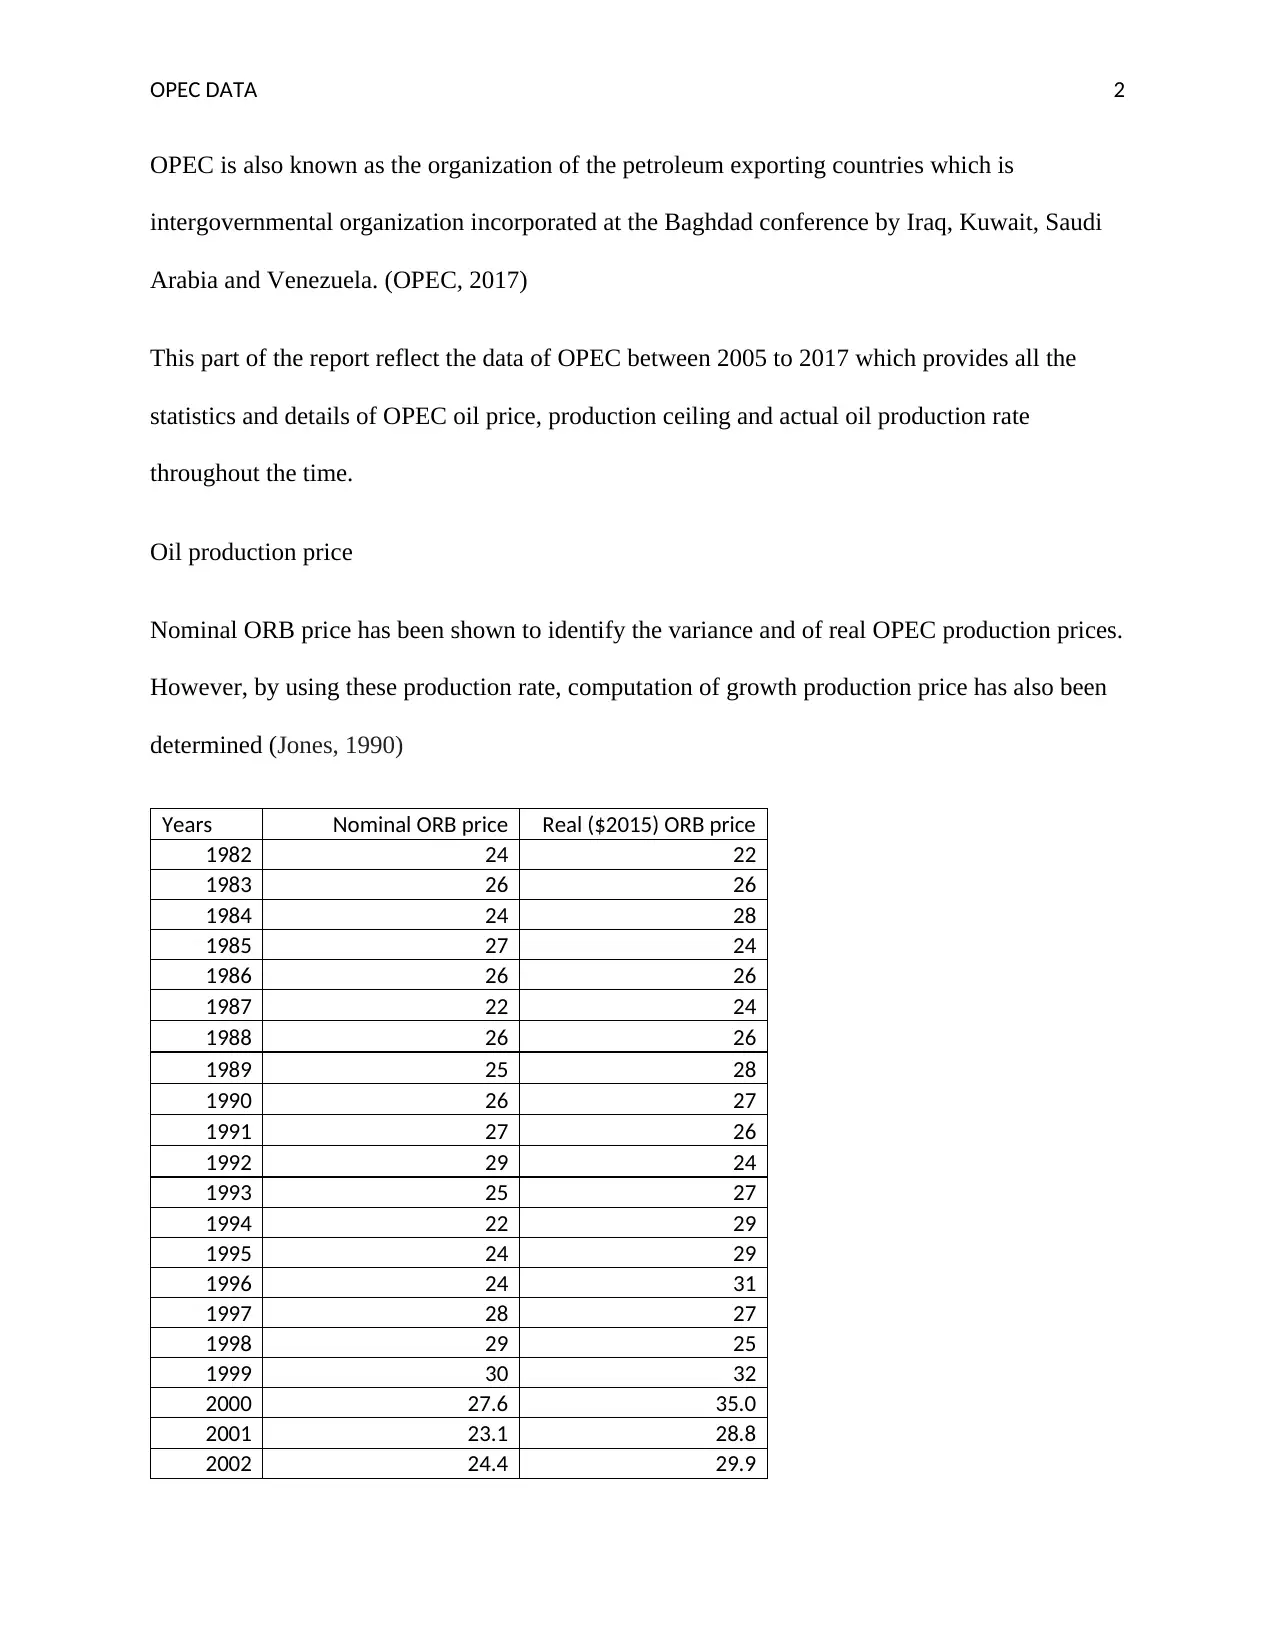
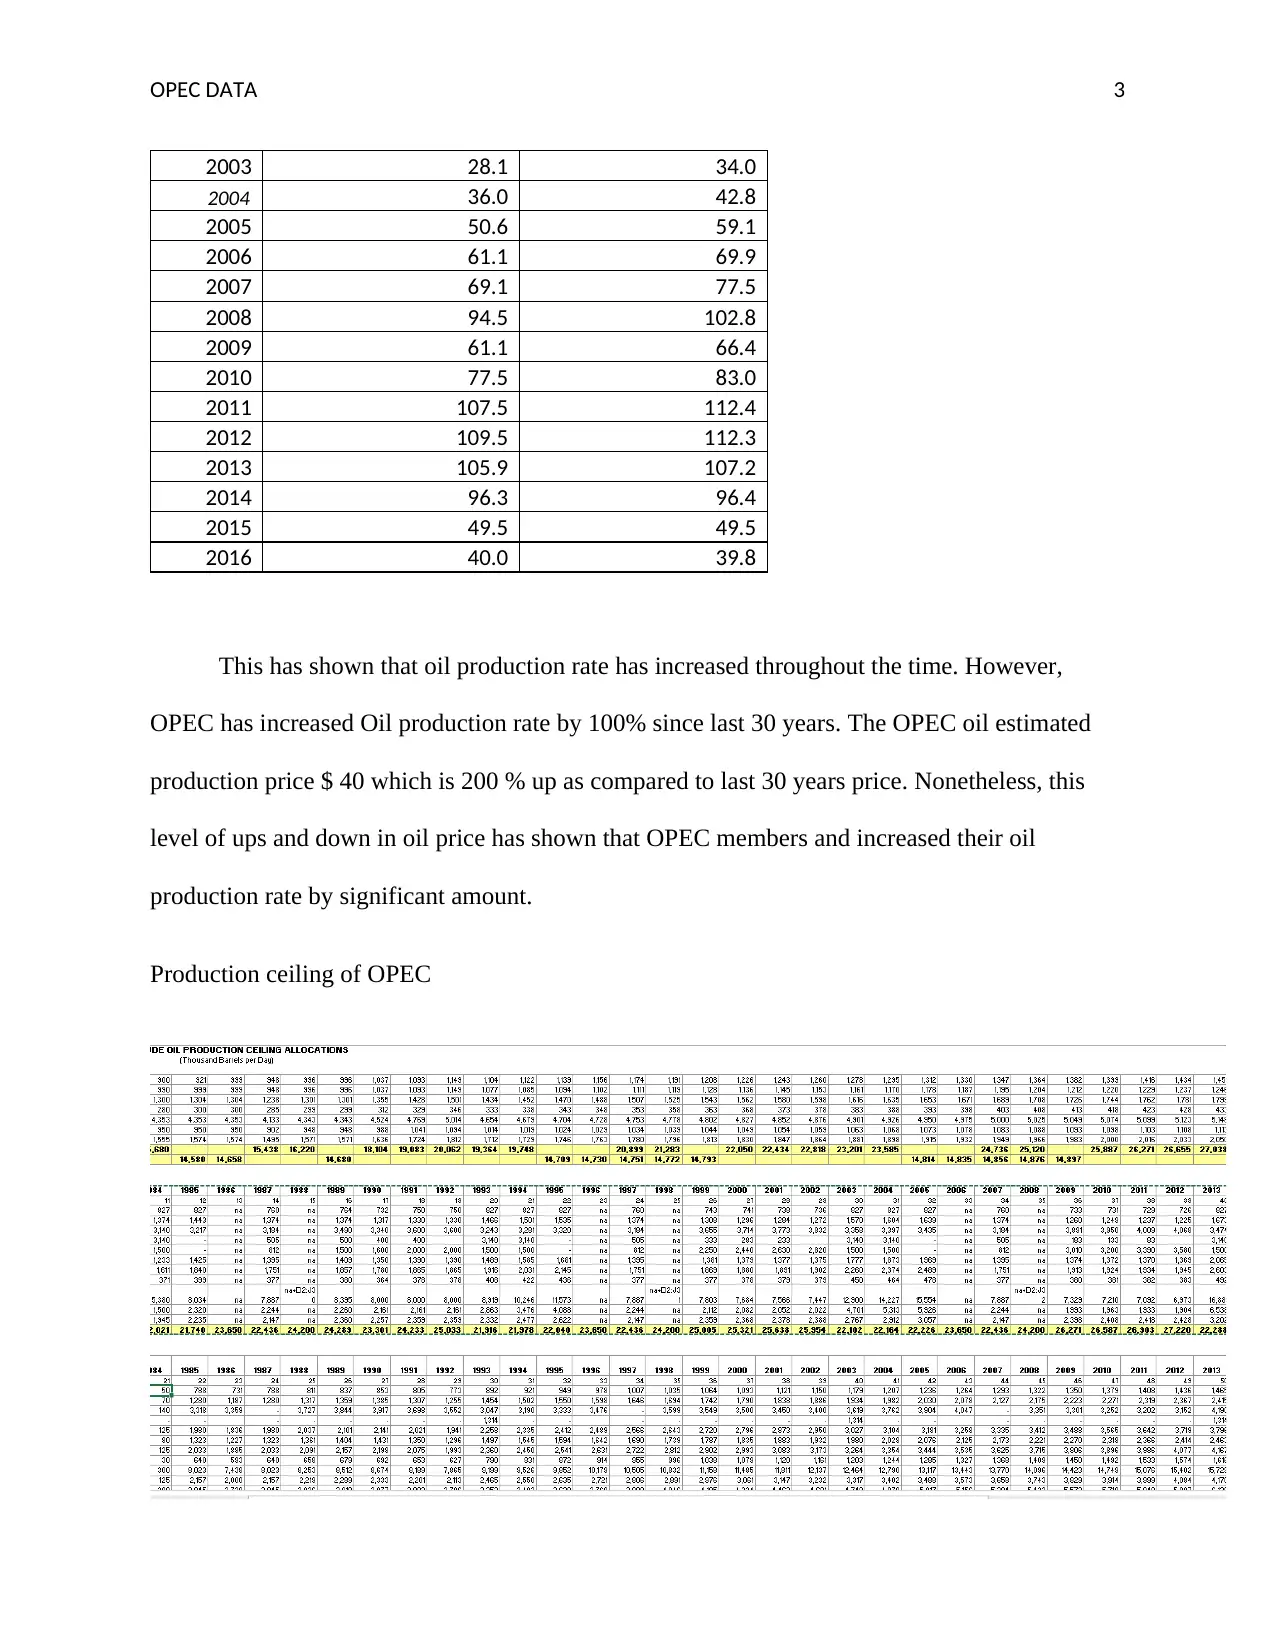
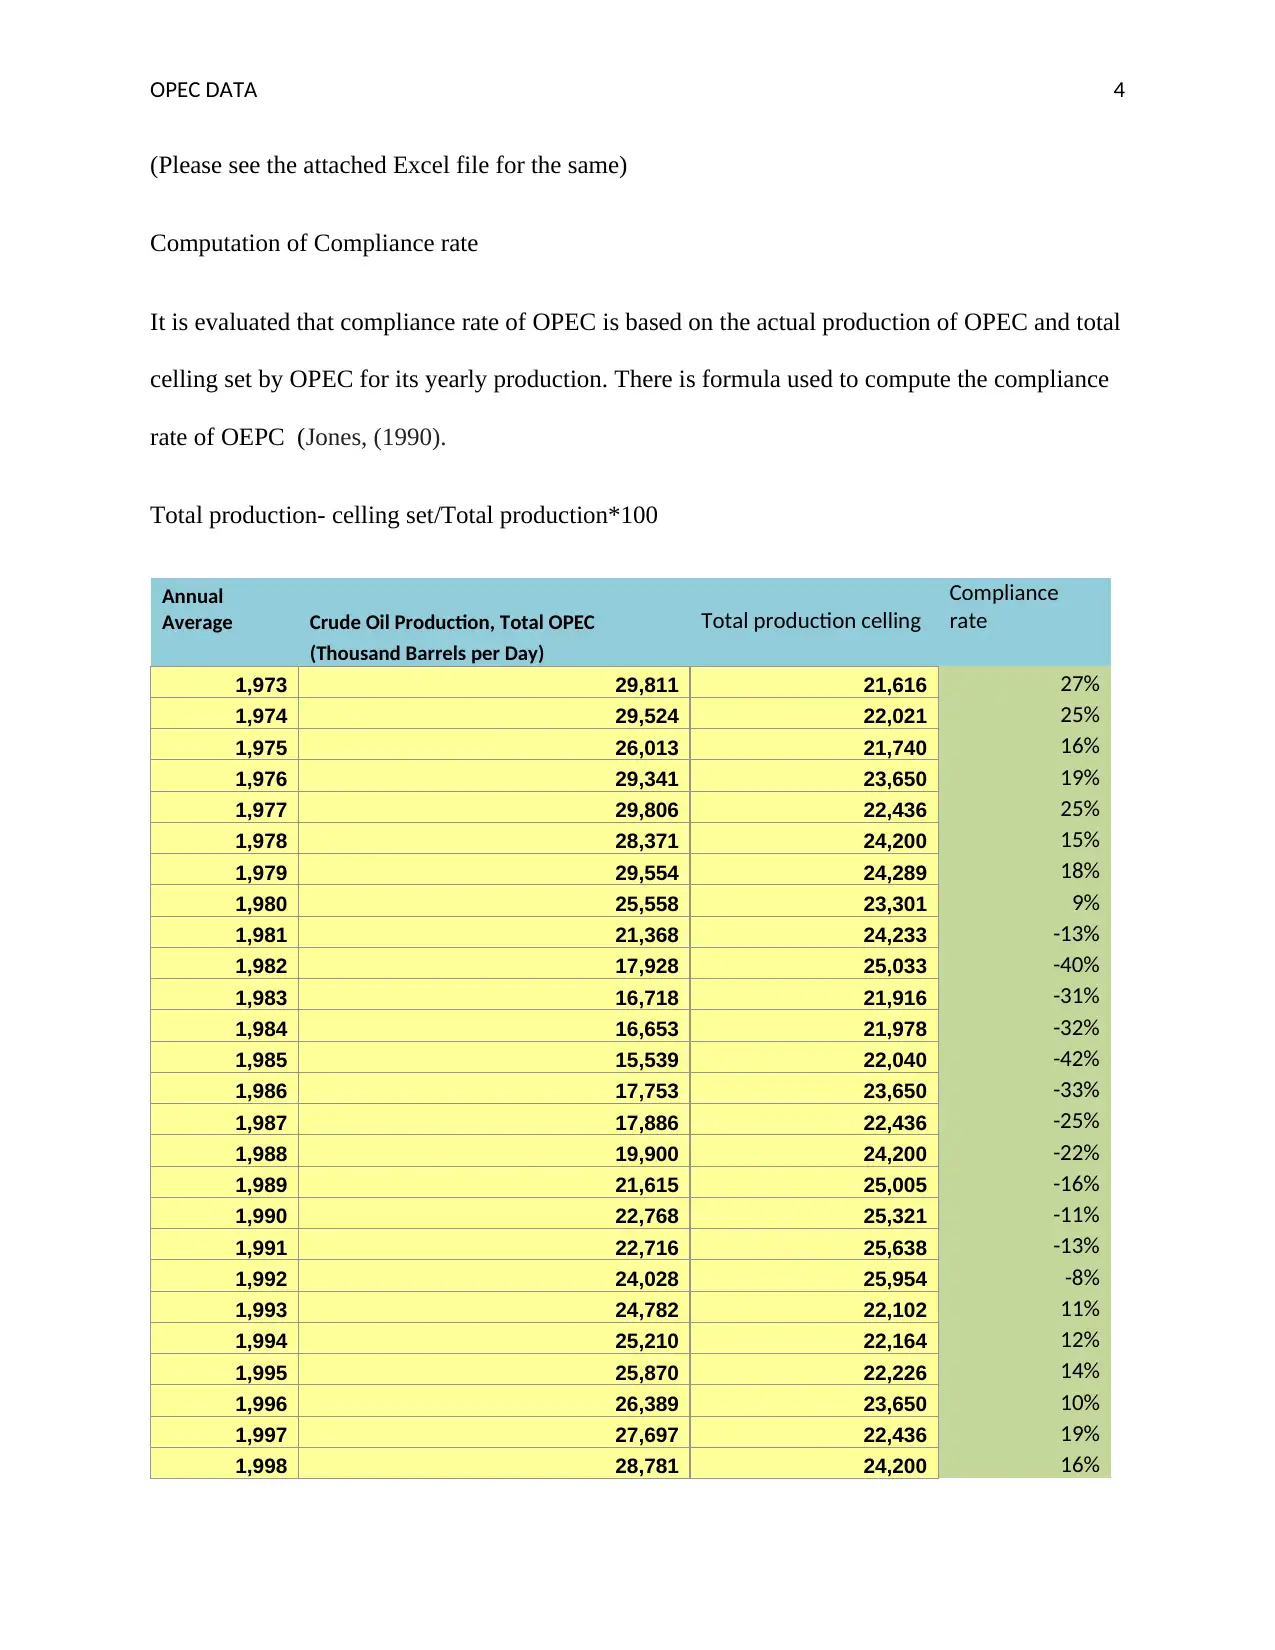
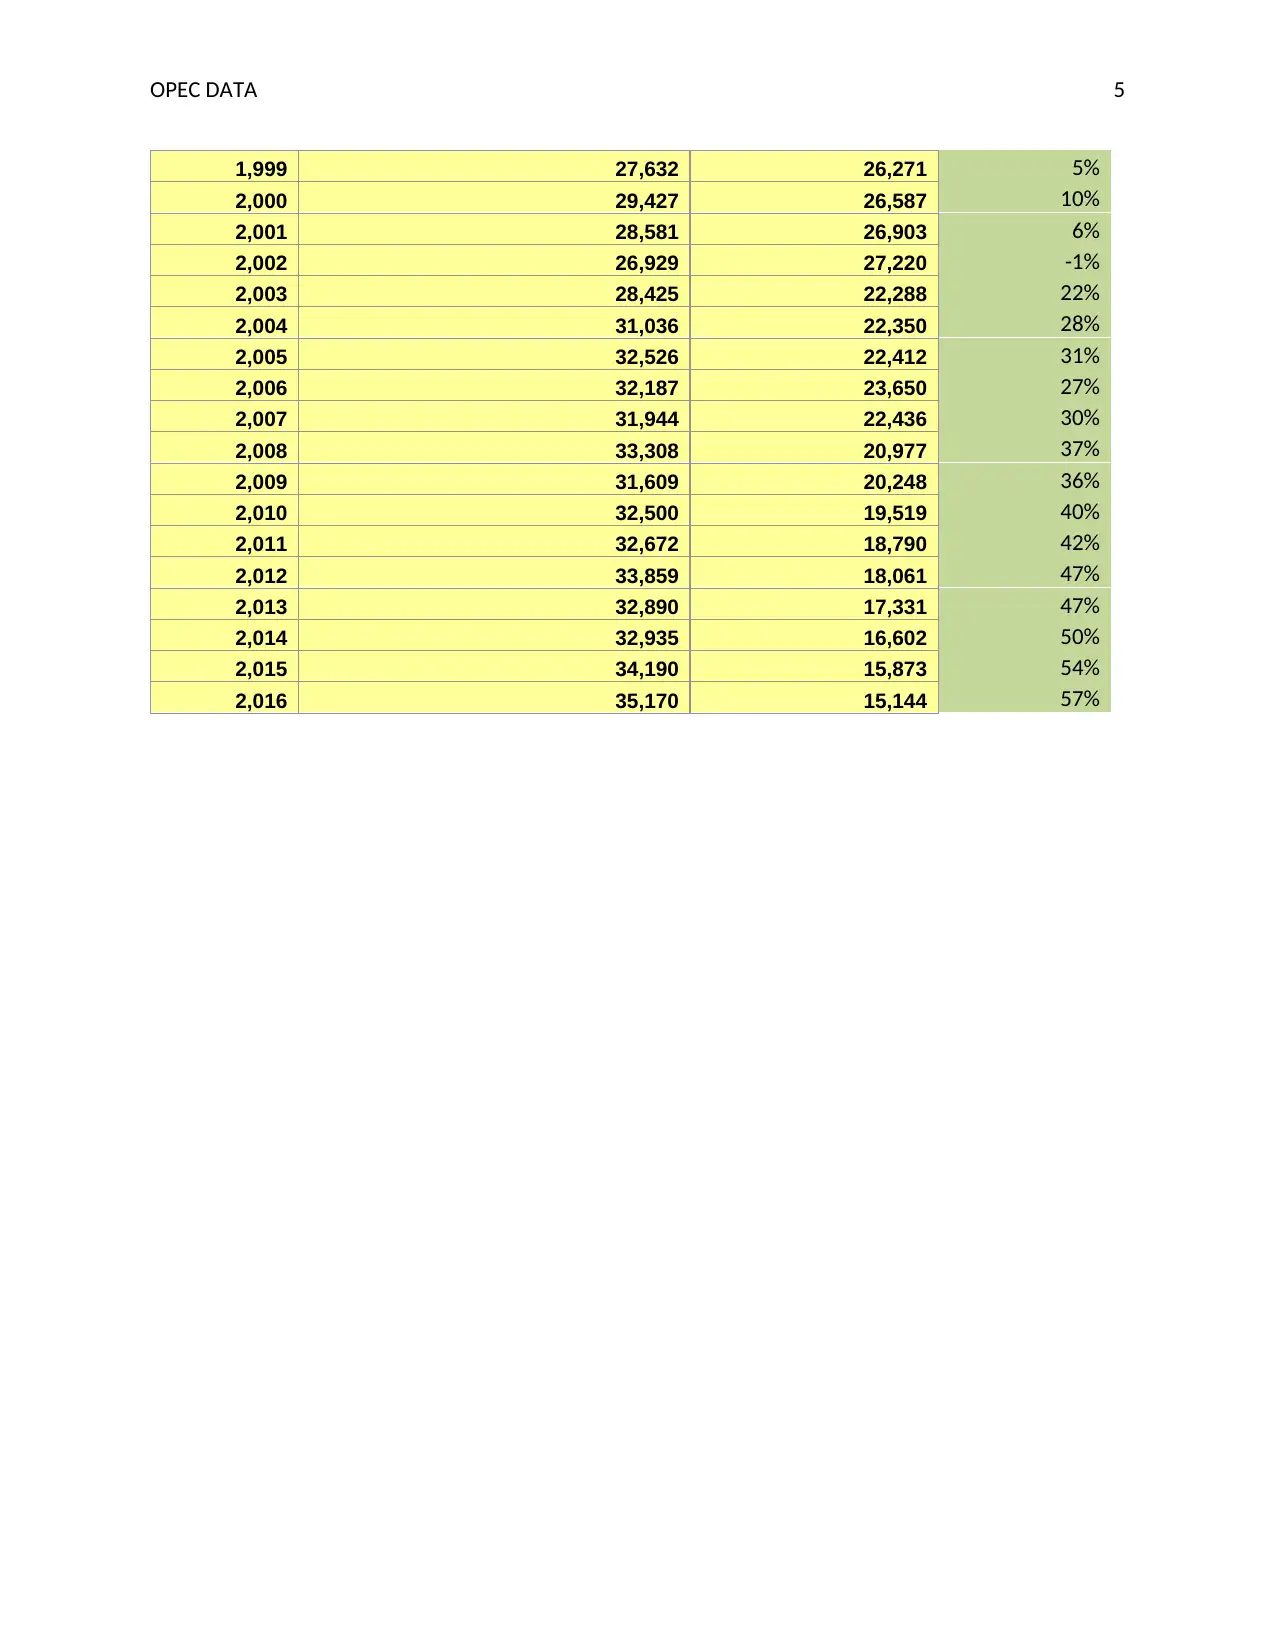
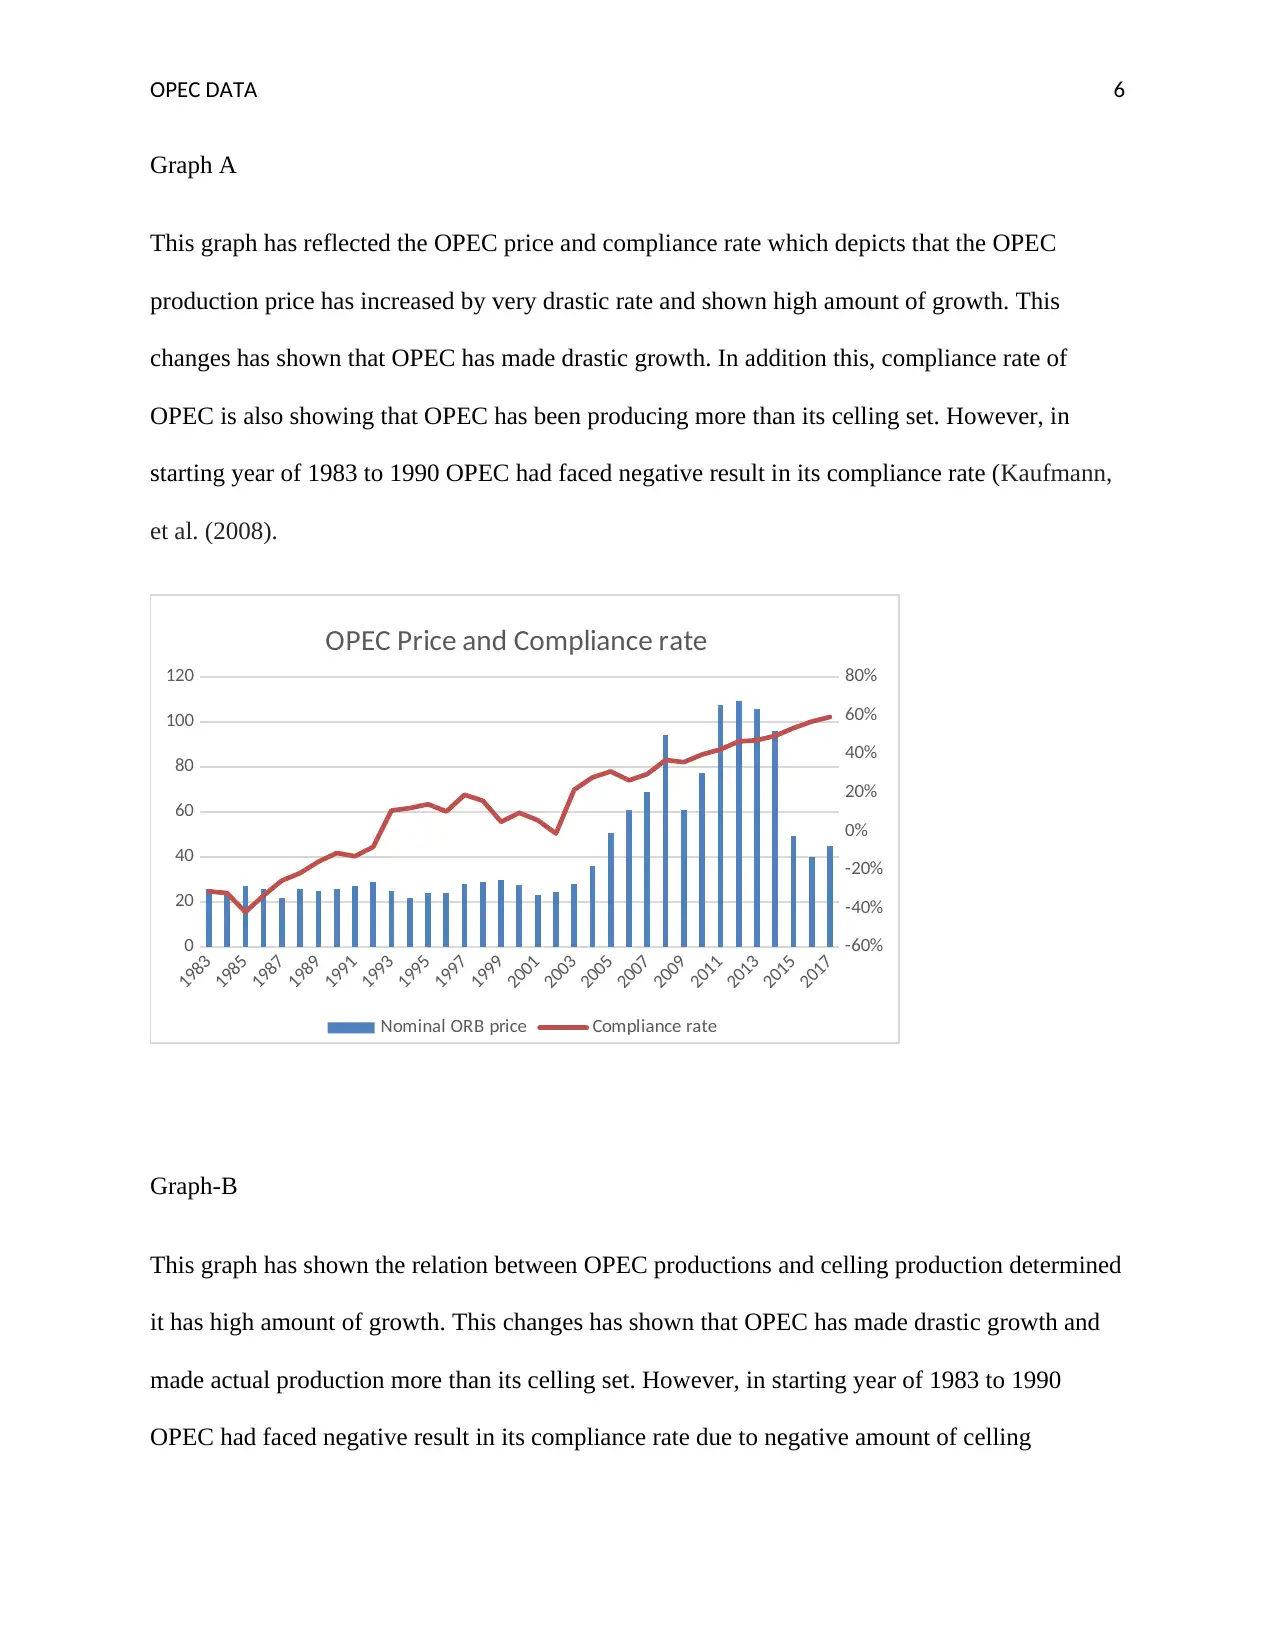
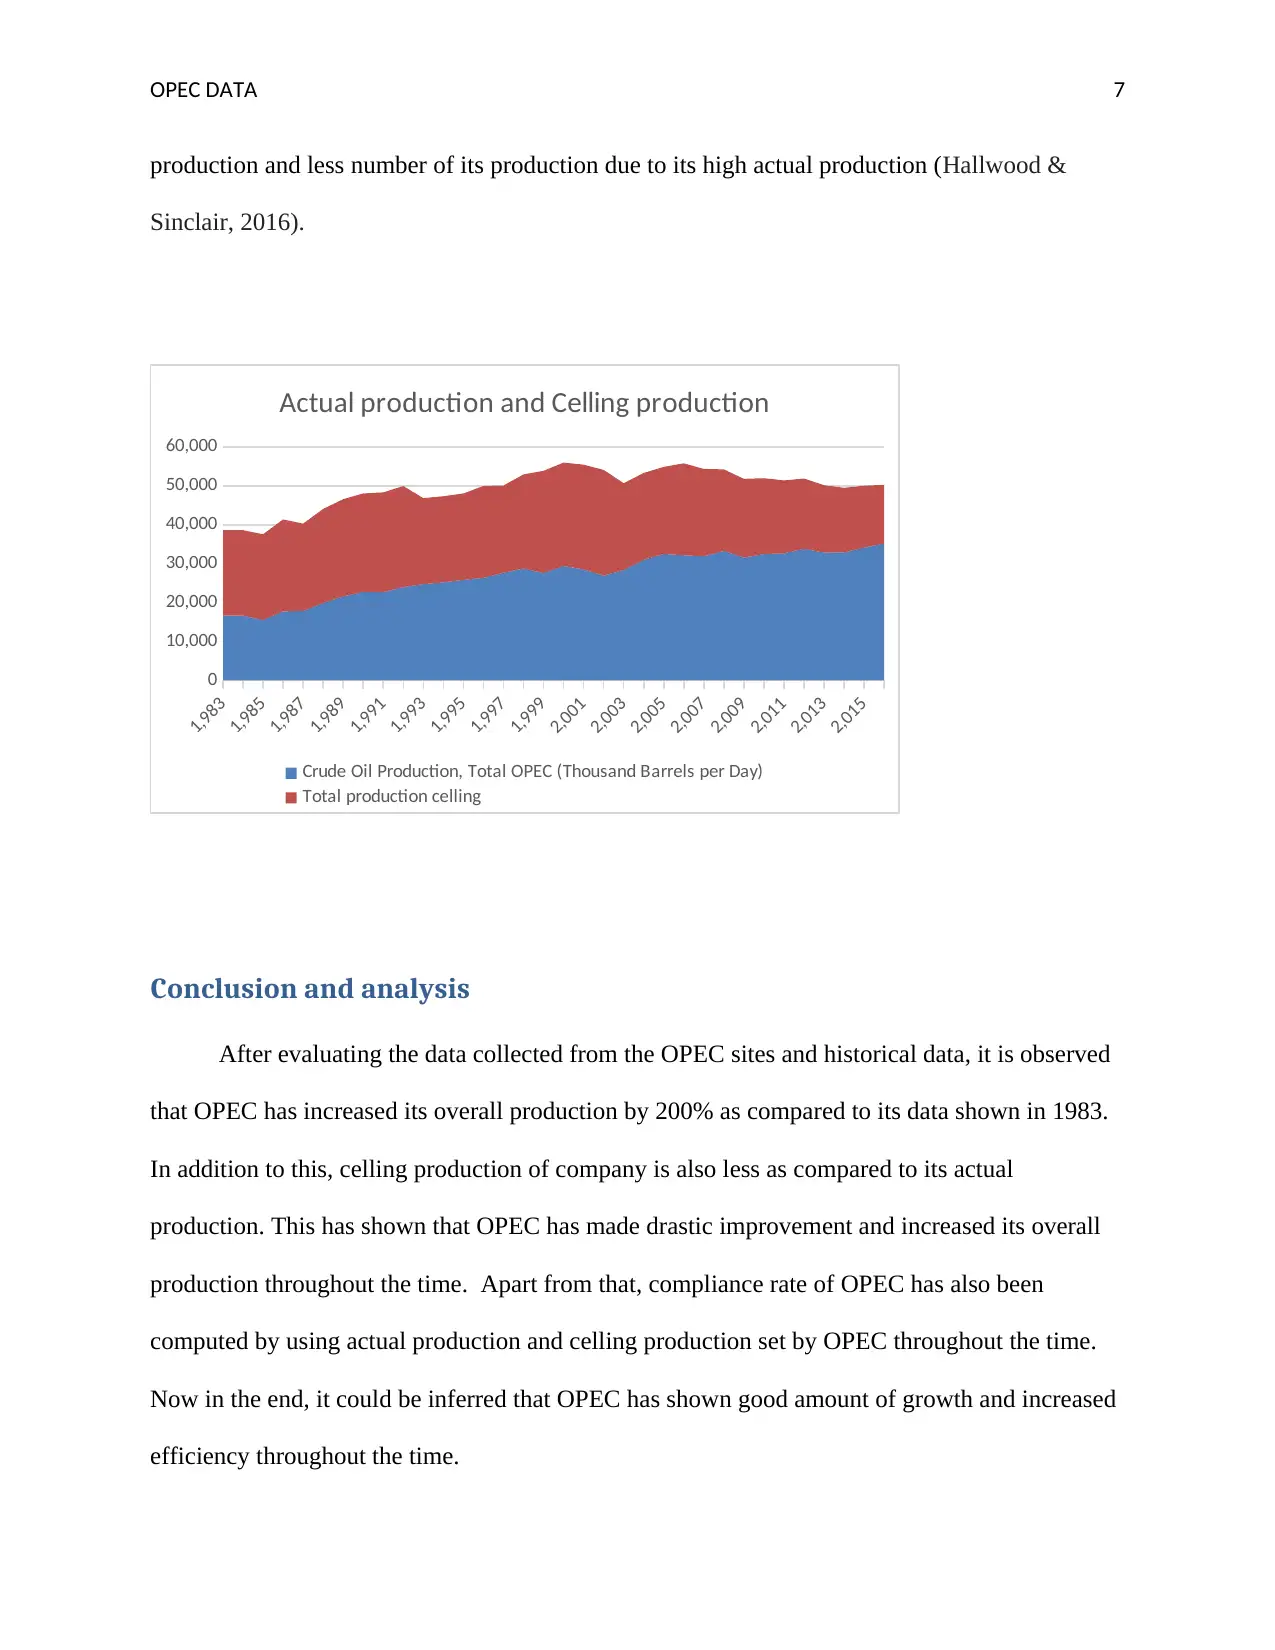
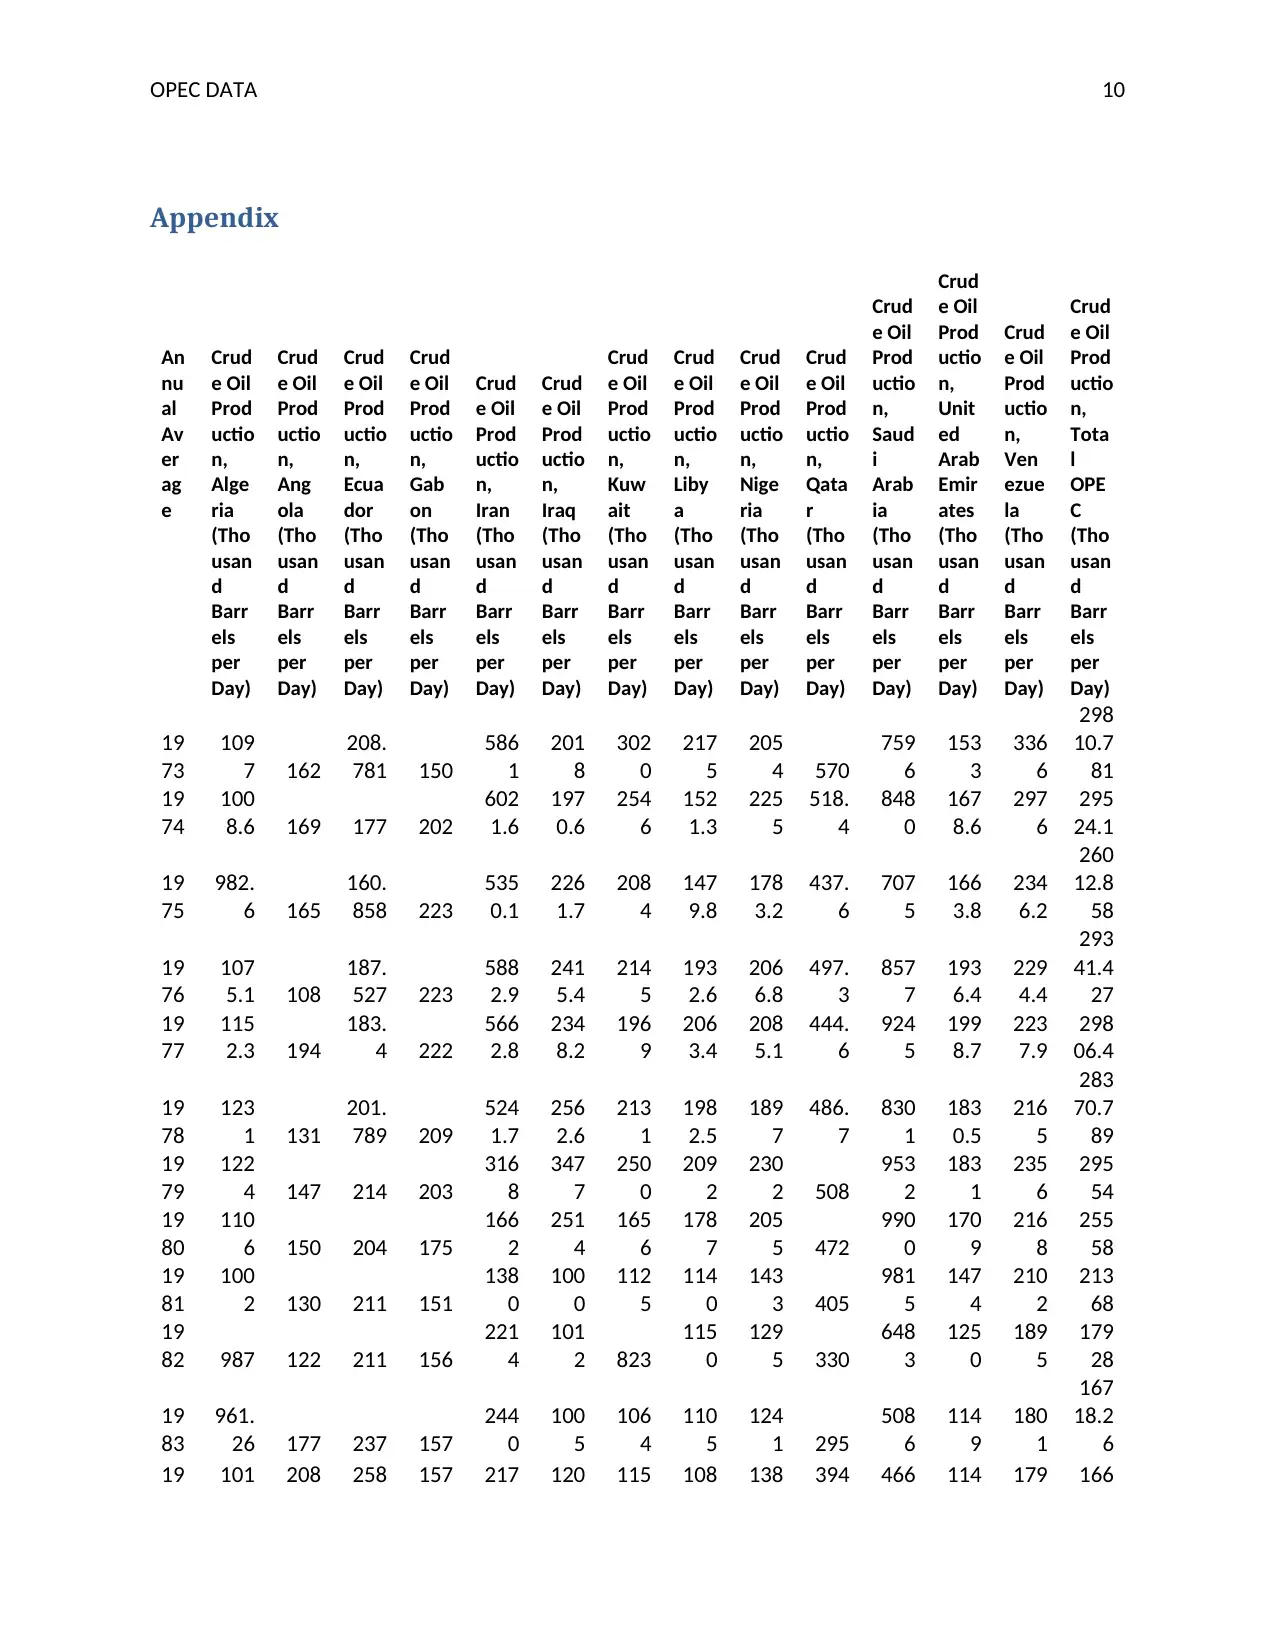
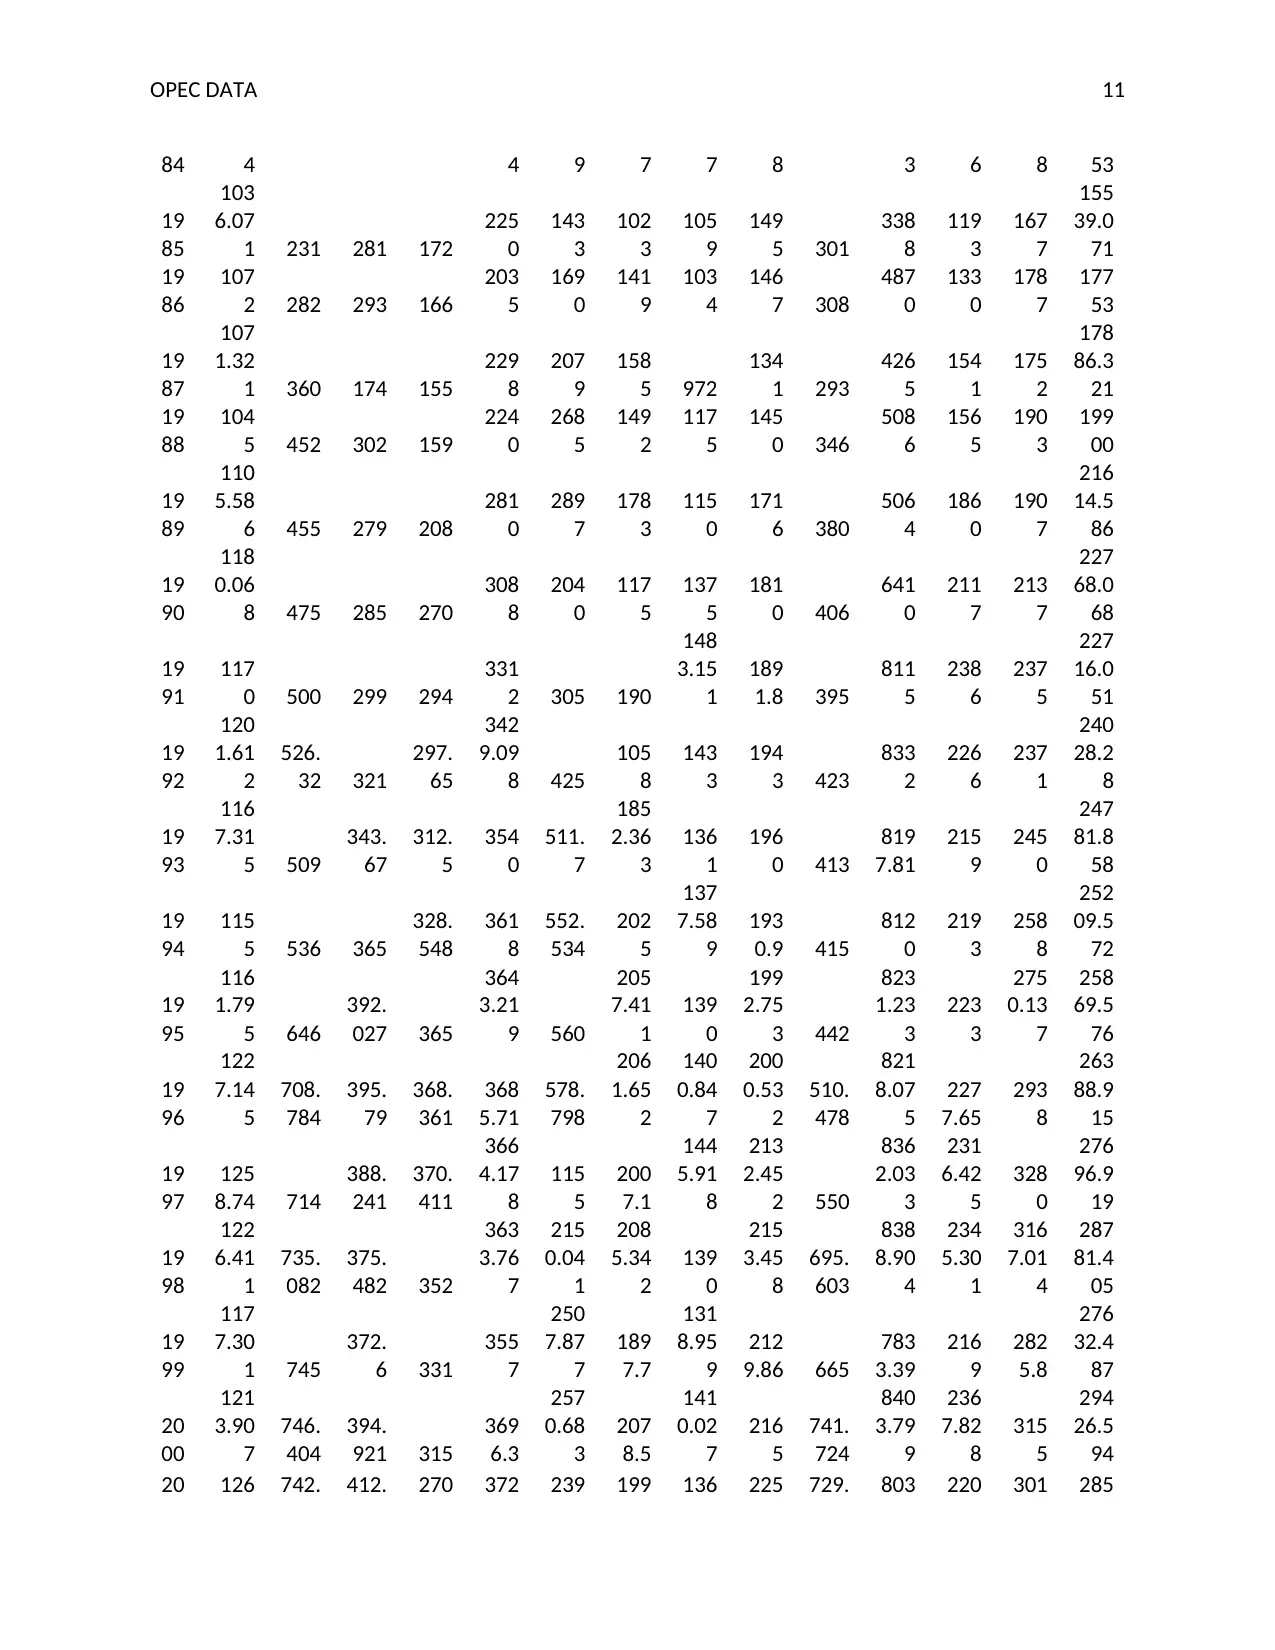
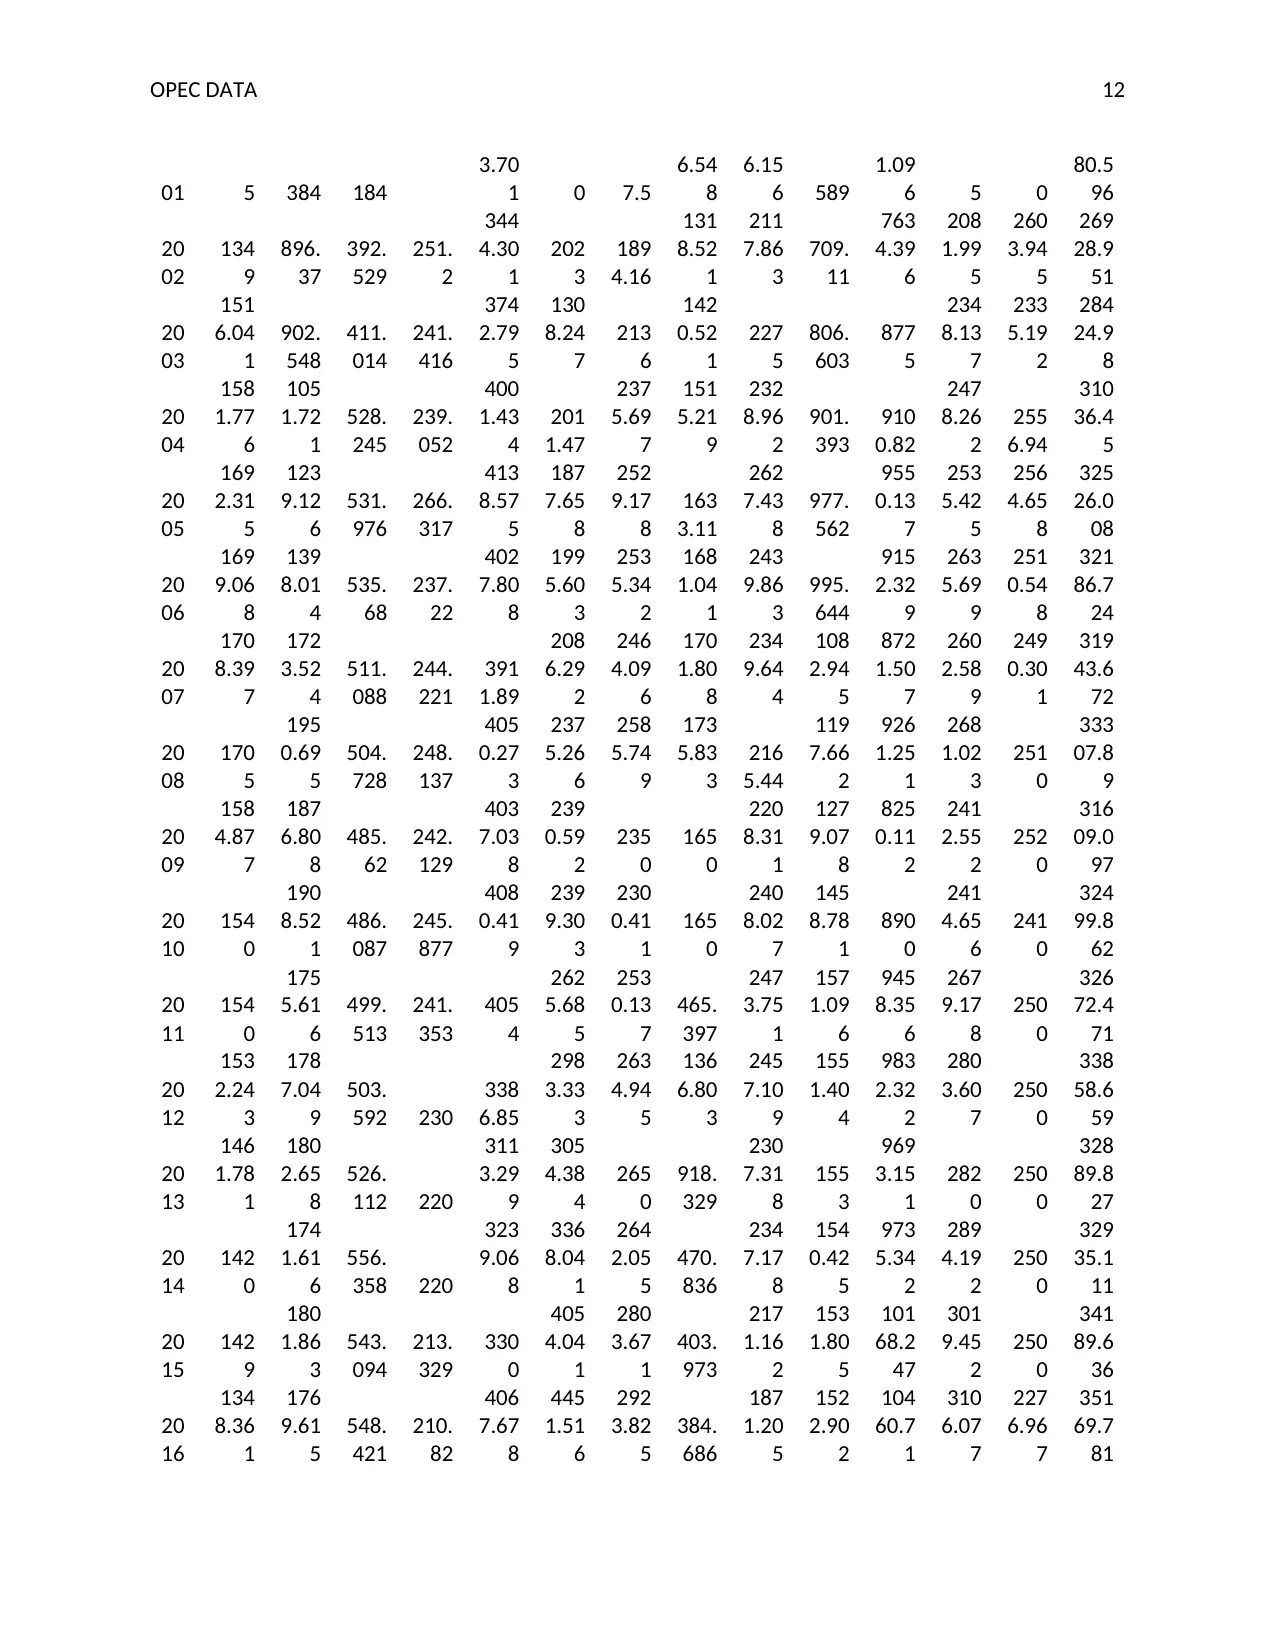
This report presents an analysis of OPEC's oil production, pricing, and compliance rates from 2005 to 2017. It examines nominal and real ORB oil prices, production ceilings, and actual production rates. The report includes data tables and graphs illustrating trends in oil prices, production levels, and compliance rates, with a focus on how OPEC's production has increased over time. The analysis also includes a computation of OPEC's compliance rate, revealing periods of over- and under-production relative to set ceilings. The report concludes that OPEC has demonstrated significant growth in production and efficiency, with a substantial increase in overall production compared to historical data. The analysis references several sources to support its findings and includes an appendix with detailed production data for various OPEC member countries.

RUNNING HEAD: OPEC DATA 1
OPEC Production and oil price analysis
Secure Best Marks with AI Grader
Need help grading? Try our AI Grader for instant feedback on your assignments.

OPEC DATA 2
OPEC is also known as the organization of the petroleum exporting countries which is
intergovernmental organization incorporated at the Baghdad conference by Iraq, Kuwait, Saudi
Arabia and Venezuela. (OPEC, 2017)
This part of the report reflect the data of OPEC between 2005 to 2017 which provides all the
statistics and details of OPEC oil price, production ceiling and actual oil production rate
throughout the time.
Oil production price
Nominal ORB price has been shown to identify the variance and of real OPEC production prices.
However, by using these production rate, computation of growth production price has also been
determined (Jones, 1990)
Years Nominal ORB price Real ($2015) ORB price
1982 24 22
1983 26 26
1984 24 28
1985 27 24
1986 26 26
1987 22 24
1988 26 26
1989 25 28
1990 26 27
1991 27 26
1992 29 24
1993 25 27
1994 22 29
1995 24 29
1996 24 31
1997 28 27
1998 29 25
1999 30 32
2000 27.6 35.0
2001 23.1 28.8
2002 24.4 29.9

OPEC DATA 3
2003 28.1 34.0
2004 36.0 42.8
2005 50.6 59.1
2006 61.1 69.9
2007 69.1 77.5
2008 94.5 102.8
2009 61.1 66.4
2010 77.5 83.0
2011 107.5 112.4
2012 109.5 112.3
2013 105.9 107.2
2014 96.3 96.4
2015 49.5 49.5
2016 40.0 39.8
This has shown that oil production rate has increased throughout the time. However,
OPEC has increased Oil production rate by 100% since last 30 years. The OPEC oil estimated
production price $ 40 which is 200 % up as compared to last 30 years price. Nonetheless, this
level of ups and down in oil price has shown that OPEC members and increased their oil
production rate by significant amount.
Production ceiling of OPEC

OPEC DATA 4
(Please see the attached Excel file for the same)
Computation of Compliance rate
It is evaluated that compliance rate of OPEC is based on the actual production of OPEC and total
celling set by OPEC for its yearly production. There is formula used to compute the compliance
rate of OEPC (Jones, (1990).
Total production- celling set/Total production*100
Annual
Average Crude Oil Production, Total OPEC Total production celling
Compliance
rate
(Thousand Barrels per Day)
1,973 29,811 21,616 27%
1,974 29,524 22,021 25%
1,975 26,013 21,740 16%
1,976 29,341 23,650 19%
1,977 29,806 22,436 25%
1,978 28,371 24,200 15%
1,979 29,554 24,289 18%
1,980 25,558 23,301 9%
1,981 21,368 24,233 -13%
1,982 17,928 25,033 -40%
1,983 16,718 21,916 -31%
1,984 16,653 21,978 -32%
1,985 15,539 22,040 -42%
1,986 17,753 23,650 -33%
1,987 17,886 22,436 -25%
1,988 19,900 24,200 -22%
1,989 21,615 25,005 -16%
1,990 22,768 25,321 -11%
1,991 22,716 25,638 -13%
1,992 24,028 25,954 -8%
1,993 24,782 22,102 11%
1,994 25,210 22,164 12%
1,995 25,870 22,226 14%
1,996 26,389 23,650 10%
1,997 27,697 22,436 19%
1,998 28,781 24,200 16%
Secure Best Marks with AI Grader
Need help grading? Try our AI Grader for instant feedback on your assignments.

OPEC DATA 5
1,999 27,632 26,271 5%
2,000 29,427 26,587 10%
2,001 28,581 26,903 6%
2,002 26,929 27,220 -1%
2,003 28,425 22,288 22%
2,004 31,036 22,350 28%
2,005 32,526 22,412 31%
2,006 32,187 23,650 27%
2,007 31,944 22,436 30%
2,008 33,308 20,977 37%
2,009 31,609 20,248 36%
2,010 32,500 19,519 40%
2,011 32,672 18,790 42%
2,012 33,859 18,061 47%
2,013 32,890 17,331 47%
2,014 32,935 16,602 50%
2,015 34,190 15,873 54%
2,016 35,170 15,144 57%

OPEC DATA 6
Graph A
This graph has reflected the OPEC price and compliance rate which depicts that the OPEC
production price has increased by very drastic rate and shown high amount of growth. This
changes has shown that OPEC has made drastic growth. In addition this, compliance rate of
OPEC is also showing that OPEC has been producing more than its celling set. However, in
starting year of 1983 to 1990 OPEC had faced negative result in its compliance rate (Kaufmann,
et al. (2008).
1983
1985
1987
1989
1991
1993
1995
1997
1999
2001
2003
2005
2007
2009
2011
2013
2015
2017
0
20
40
60
80
100
120
-60%
-40%
-20%
0%
20%
40%
60%
80%
OPEC Price and Compliance rate
Nominal ORB price Compliance rate
Graph-B
This graph has shown the relation between OPEC productions and celling production determined
it has high amount of growth. This changes has shown that OPEC has made drastic growth and
made actual production more than its celling set. However, in starting year of 1983 to 1990
OPEC had faced negative result in its compliance rate due to negative amount of celling

OPEC DATA 7
production and less number of its production due to its high actual production (Hallwood &
Sinclair, 2016).
1,983
1,985
1,987
1,989
1,991
1,993
1,995
1,997
1,999
2,001
2,003
2,005
2,007
2,009
2,011
2,013
2,015
0
10,000
20,000
30,000
40,000
50,000
60,000
Actual production and Celling production
Crude Oil Production, Total OPEC (Thousand Barrels per Day)
Total production celling
Conclusion and analysis
After evaluating the data collected from the OPEC sites and historical data, it is observed
that OPEC has increased its overall production by 200% as compared to its data shown in 1983.
In addition to this, celling production of company is also less as compared to its actual
production. This has shown that OPEC has made drastic improvement and increased its overall
production throughout the time. Apart from that, compliance rate of OPEC has also been
computed by using actual production and celling production set by OPEC throughout the time.
Now in the end, it could be inferred that OPEC has shown good amount of growth and increased
efficiency throughout the time.
Paraphrase This Document
Need a fresh take? Get an instant paraphrase of this document with our AI Paraphraser

OPEC DATA 8

OPEC DATA 9
References
Hallwood, P., & Sinclair, S. (2016). Oil, debt and development: OPEC in the Third World. Routledge.
Jones, C. T. (1990). OPEC behaviour under falling prices: implications for cartel stability. The Energy
Journal, 117-129.
Kaufmann, R. K., Bradford, A., Belanger, L. H., Mclaughlin, J. P., & Miki, Y. (2008). Determinants of OPEC
production: Implications for OPEC behavior. Energy Economics, 30(2), 333-351.
OPEC, 2017, Download center, reterived on 5th October, 2017, from
http://www.opec.org/opec_web/en/
Ramcharran, H. (2002). Oil production responses to price changes: an empirical application of the
competitive model to OPEC and non-OPEC countries. Energy economics, 24(2), 97-106.

OPEC DATA 10
Appendix
An
nu
al
Av
er
ag
e
Crud
e Oil
Prod
uctio
n,
Alge
ria
Crud
e Oil
Prod
uctio
n,
Ang
ola
Crud
e Oil
Prod
uctio
n,
Ecua
dor
Crud
e Oil
Prod
uctio
n,
Gab
on
Crud
e Oil
Prod
uctio
n,
Iran
Crud
e Oil
Prod
uctio
n,
Iraq
Crud
e Oil
Prod
uctio
n,
Kuw
ait
Crud
e Oil
Prod
uctio
n,
Liby
a
Crud
e Oil
Prod
uctio
n,
Nige
ria
Crud
e Oil
Prod
uctio
n,
Qata
r
Crud
e Oil
Prod
uctio
n,
Saud
i
Arab
ia
Crud
e Oil
Prod
uctio
n,
Unit
ed
Arab
Emir
ates
Crud
e Oil
Prod
uctio
n,
Ven
ezue
la
Crud
e Oil
Prod
uctio
n,
Tota
l
OPE
C
(Tho
usan
d
Barr
els
per
Day)
(Tho
usan
d
Barr
els
per
Day)
(Tho
usan
d
Barr
els
per
Day)
(Tho
usan
d
Barr
els
per
Day)
(Tho
usan
d
Barr
els
per
Day)
(Tho
usan
d
Barr
els
per
Day)
(Tho
usan
d
Barr
els
per
Day)
(Tho
usan
d
Barr
els
per
Day)
(Tho
usan
d
Barr
els
per
Day)
(Tho
usan
d
Barr
els
per
Day)
(Tho
usan
d
Barr
els
per
Day)
(Tho
usan
d
Barr
els
per
Day)
(Tho
usan
d
Barr
els
per
Day)
(Tho
usan
d
Barr
els
per
Day)
19
73
109
7 162
208.
781 150
586
1
201
8
302
0
217
5
205
4 570
759
6
153
3
336
6
298
10.7
81
19
74
100
8.6 169 177 202
602
1.6
197
0.6
254
6
152
1.3
225
5
518.
4
848
0
167
8.6
297
6
295
24.1
19
75
982.
6 165
160.
858 223
535
0.1
226
1.7
208
4
147
9.8
178
3.2
437.
6
707
5
166
3.8
234
6.2
260
12.8
58
19
76
107
5.1 108
187.
527 223
588
2.9
241
5.4
214
5
193
2.6
206
6.8
497.
3
857
7
193
6.4
229
4.4
293
41.4
27
19
77
115
2.3 194
183.
4 222
566
2.8
234
8.2
196
9
206
3.4
208
5.1
444.
6
924
5
199
8.7
223
7.9
298
06.4
19
78
123
1 131
201.
789 209
524
1.7
256
2.6
213
1
198
2.5
189
7
486.
7
830
1
183
0.5
216
5
283
70.7
89
19
79
122
4 147 214 203
316
8
347
7
250
0
209
2
230
2 508
953
2
183
1
235
6
295
54
19
80
110
6 150 204 175
166
2
251
4
165
6
178
7
205
5 472
990
0
170
9
216
8
255
58
19
81
100
2 130 211 151
138
0
100
0
112
5
114
0
143
3 405
981
5
147
4
210
2
213
68
19
82 987 122 211 156
221
4
101
2 823
115
0
129
5 330
648
3
125
0
189
5
179
28
19
83
961.
26 177 237 157
244
0
100
5
106
4
110
5
124
1 295
508
6
114
9
180
1
167
18.2
6
19 101 208 258 157 217 120 115 108 138 394 466 114 179 166
Secure Best Marks with AI Grader
Need help grading? Try our AI Grader for instant feedback on your assignments.

OPEC DATA 11
84 4 4 9 7 7 8 3 6 8 53
19
85
103
6.07
1 231 281 172
225
0
143
3
102
3
105
9
149
5 301
338
8
119
3
167
7
155
39.0
71
19
86
107
2 282 293 166
203
5
169
0
141
9
103
4
146
7 308
487
0
133
0
178
7
177
53
19
87
107
1.32
1 360 174 155
229
8
207
9
158
5 972
134
1 293
426
5
154
1
175
2
178
86.3
21
19
88
104
5 452 302 159
224
0
268
5
149
2
117
5
145
0 346
508
6
156
5
190
3
199
00
19
89
110
5.58
6 455 279 208
281
0
289
7
178
3
115
0
171
6 380
506
4
186
0
190
7
216
14.5
86
19
90
118
0.06
8 475 285 270
308
8
204
0
117
5
137
5
181
0 406
641
0
211
7
213
7
227
68.0
68
19
91
117
0 500 299 294
331
2 305 190
148
3.15
1
189
1.8 395
811
5
238
6
237
5
227
16.0
51
19
92
120
1.61
2
526.
32 321
297.
65
342
9.09
8 425
105
8
143
3
194
3 423
833
2
226
6
237
1
240
28.2
8
19
93
116
7.31
5 509
343.
67
312.
5
354
0
511.
7
185
2.36
3
136
1
196
0 413
819
7.81
215
9
245
0
247
81.8
58
19
94
115
5 536 365
328.
548
361
8
552.
534
202
5
137
7.58
9
193
0.9 415
812
0
219
3
258
8
252
09.5
72
19
95
116
1.79
5 646
392.
027 365
364
3.21
9 560
205
7.41
1
139
0
199
2.75
3 442
823
1.23
3
223
3
275
0.13
7
258
69.5
76
19
96
122
7.14
5
708.
784
395.
79
368.
361
368
5.71
578.
798
206
1.65
2
140
0.84
7
200
0.53
2
510.
478
821
8.07
5
227
7.65
293
8
263
88.9
15
19
97
125
8.74 714
388.
241
370.
411
366
4.17
8
115
5
200
7.1
144
5.91
8
213
2.45
2 550
836
2.03
3
231
6.42
5
328
0
276
96.9
19
19
98
122
6.41
1
735.
082
375.
482 352
363
3.76
7
215
0.04
1
208
5.34
2
139
0
215
3.45
8
695.
603
838
8.90
4
234
5.30
1
316
7.01
4
287
81.4
05
19
99
117
7.30
1 745
372.
6 331
355
7
250
7.87
7
189
7.7
131
8.95
9
212
9.86 665
783
3.39
216
9
282
5.8
276
32.4
87
20
00
121
3.90
7
746.
404
394.
921 315
369
6.3
257
0.68
3
207
8.5
141
0.02
7
216
5
741.
724
840
3.79
9
236
7.82
8
315
5
294
26.5
94
20 126 742. 412. 270 372 239 199 136 225 729. 803 220 301 285

OPEC DATA 12
01 5 384 184
3.70
1 0 7.5
6.54
8
6.15
6 589
1.09
6 5 0
80.5
96
20
02
134
9
896.
37
392.
529
251.
2
344
4.30
1
202
3
189
4.16
131
8.52
1
211
7.86
3
709.
11
763
4.39
6
208
1.99
5
260
3.94
5
269
28.9
51
20
03
151
6.04
1
902.
548
411.
014
241.
416
374
2.79
5
130
8.24
7
213
6
142
0.52
1
227
5
806.
603
877
5
234
8.13
7
233
5.19
2
284
24.9
8
20
04
158
1.77
6
105
1.72
1
528.
245
239.
052
400
1.43
4
201
1.47
237
5.69
7
151
5.21
9
232
8.96
2
901.
393
910
0.82
247
8.26
2
255
6.94
310
36.4
5
20
05
169
2.31
5
123
9.12
6
531.
976
266.
317
413
8.57
5
187
7.65
8
252
9.17
8
163
3.11
262
7.43
8
977.
562
955
0.13
7
253
5.42
5
256
4.65
8
325
26.0
08
20
06
169
9.06
8
139
8.01
4
535.
68
237.
22
402
7.80
8
199
5.60
3
253
5.34
2
168
1.04
1
243
9.86
3
995.
644
915
2.32
9
263
5.69
9
251
0.54
8
321
86.7
24
20
07
170
8.39
7
172
3.52
4
511.
088
244.
221
391
1.89
208
6.29
2
246
4.09
6
170
1.80
8
234
9.64
4
108
2.94
5
872
1.50
7
260
2.58
9
249
0.30
1
319
43.6
72
20
08
170
5
195
0.69
5
504.
728
248.
137
405
0.27
3
237
5.26
6
258
5.74
9
173
5.83
3
216
5.44
119
7.66
2
926
1.25
1
268
1.02
3
251
0
333
07.8
9
20
09
158
4.87
7
187
6.80
8
485.
62
242.
129
403
7.03
8
239
0.59
2
235
0
165
0
220
8.31
1
127
9.07
8
825
0.11
2
241
2.55
2
252
0
316
09.0
97
20
10
154
0
190
8.52
1
486.
087
245.
877
408
0.41
9
239
9.30
3
230
0.41
1
165
0
240
8.02
7
145
8.78
1
890
0
241
4.65
6
241
0
324
99.8
62
20
11
154
0
175
5.61
6
499.
513
241.
353
405
4
262
5.68
5
253
0.13
7
465.
397
247
3.75
1
157
1.09
6
945
8.35
6
267
9.17
8
250
0
326
72.4
71
20
12
153
2.24
3
178
7.04
9
503.
592 230
338
6.85
298
3.33
3
263
4.94
5
136
6.80
3
245
7.10
9
155
1.40
4
983
2.32
2
280
3.60
7
250
0
338
58.6
59
20
13
146
1.78
1
180
2.65
8
526.
112 220
311
3.29
9
305
4.38
4
265
0
918.
329
230
7.31
8
155
3
969
3.15
1
282
0
250
0
328
89.8
27
20
14
142
0
174
1.61
6
556.
358 220
323
9.06
8
336
8.04
1
264
2.05
5
470.
836
234
7.17
8
154
0.42
5
973
5.34
2
289
4.19
2
250
0
329
35.1
11
20
15
142
9
180
1.86
3
543.
094
213.
329
330
0
405
4.04
1
280
3.67
1
403.
973
217
1.16
2
153
1.80
5
101
68.2
47
301
9.45
2
250
0
341
89.6
36
20
16
134
8.36
1
176
9.61
5
548.
421
210.
82
406
7.67
8
445
1.51
6
292
3.82
5
384.
686
187
1.20
5
152
2.90
2
104
60.7
1
310
6.07
7
227
6.96
7
351
69.7
81

OPEC DATA 13
OPEC Production price
$/b
Year
s Nominal ORB price Real ($2015) ORB price
1982 24 22
1983 26 26
1984 24 28
1985 27 24
1986 26 26
1987 22 24
1988 26 26
1989 25 28
1990 26 27
1991 27 26
1992 29 24
1993 25 27
1994 22 29
OPEC Production price
$/b
Year
s Nominal ORB price Real ($2015) ORB price
1982 24 22
1983 26 26
1984 24 28
1985 27 24
1986 26 26
1987 22 24
1988 26 26
1989 25 28
1990 26 27
1991 27 26
1992 29 24
1993 25 27
1994 22 29
Paraphrase This Document
Need a fresh take? Get an instant paraphrase of this document with our AI Paraphraser

OPEC DATA 14
1995 24 29
1996 24 31
1997 28 27
1998 29 25
1999 30 32
2000 27.6 35.0
2001 23.1 28.8
2002 24.4 29.9
2003 28.1 34.0
2004 36.0 42.8
2005 50.6 59.1
2006 61.1 69.9
2007 69.1 77.5
2008 94.5 102.8
2009 61.1 66.4
2010 77.5 83.0
2011 107.5 112.4
1995 24 29
1996 24 31
1997 28 27
1998 29 25
1999 30 32
2000 27.6 35.0
2001 23.1 28.8
2002 24.4 29.9
2003 28.1 34.0
2004 36.0 42.8
2005 50.6 59.1
2006 61.1 69.9
2007 69.1 77.5
2008 94.5 102.8
2009 61.1 66.4
2010 77.5 83.0
2011 107.5 112.4

OPEC DATA 15
2012 109.5 112.3
2013 105.9 107.2
2014 96.3 96.4
2015 49.5 49.5
2016 40.0 39.8
2017 45.0 44.1
2018 50.0 48.8
2019 55.0 53.4
2020 60.0 57.0
2021 65.0 60.4
2022 70.8 64.4
2023 77.1 68.6
2024 83.1 72.4
2025 88.8 75.5
2026 94.3 78.3
2027 99.4 80.6
2028 104.4 82.6
2012 109.5 112.3
2013 105.9 107.2
2014 96.3 96.4
2015 49.5 49.5
2016 40.0 39.8
2017 45.0 44.1
2018 50.0 48.8
2019 55.0 53.4
2020 60.0 57.0
2021 65.0 60.4
2022 70.8 64.4
2023 77.1 68.6
2024 83.1 72.4
2025 88.8 75.5
2026 94.3 78.3
2027 99.4 80.6
2028 104.4 82.6

OPEC DATA 16
2029 109.1 84.3
2030 113.6 85.8
2031 118.2 87.1
2032 122.6 88.3
2033 126.3 88.8
2034 130.0 89.3
2035 133.9 89.8
2036 137.9 90.3
2037 142.0 90.8
2038 146.2 91.3
2039 150.5 91.8
2040 155.0 92.3
2029 109.1 84.3
2030 113.6 85.8
2031 118.2 87.1
2032 122.6 88.3
2033 126.3 88.8
2034 130.0 89.3
2035 133.9 89.8
2036 137.9 90.3
2037 142.0 90.8
2038 146.2 91.3
2039 150.5 91.8
2040 155.0 92.3
Secure Best Marks with AI Grader
Need help grading? Try our AI Grader for instant feedback on your assignments.

OPEC DATA 17
Annual
Average Crude Oil Production, Total OPEC Total production celling
Compliance
rate
(Thousand Barrels per Day)
1,983 16,718 21,916 -31%
1,984 16,653 21,978 -32%
1,985 15,539 22,040 -42%
1,986 17,753 23,650 -33%
1,987 17,886 22,436 -25%
1,988 19,900 24,200 -22%
1,989 21,615 25,005 -16%
1,990 22,768 25,321 -11%
1,991 22,716 25,638 -13%
1,992 24,028 25,954 -8%
1,993 24,782 22,102 11%
1,994 25,210 22,164 12%
1,995 25,870 22,226 14%
1,996 26,389 23,650 10%
1,997 27,697 22,436 19%
1,998 28,781 24,200 16%
1,999 27,632 26,271 5%
2,000 29,427 26,587 10%
2,001 28,581 26,903 6%
2,002 26,929 27,220 -1%
2,003 28,425 22,288 22%
2,004 31,036 22,350 28%
2,005 32,526 22,412 31%
2,006 32,187 23,650 27%
2,007 31,944 22,436 30%
2,008 33,308 20,977 37%
2,009 31,609 20,248 36%
2,010 32,500 19,519 40%
2,011 32,672 18,790 42%
2,012 33,859 18,061 47%
2,013 32,890 17,331 47%
2,014 32,935 16,602 50%
2,015 34,190 15,873 54%
2,016 35,170 15,144 57%

OPEC DATA 18
Annual
Average
Crude Oil Production, Total
OPEC Total production celling
Year (Thousand Barrels per Day)
1,983 16,718 21,916
1,984 16,653 21,978
1,985 15,539 22,040
1,986 17,753 23,650
1,987 17,886 22,436
1,988 19,900 24,200
1,989 21,615 25,005
1,990 22,768 25,321
1,991 22,716 25,638
1,992 24,028 25,954
1,993 24,782 22,102
1,994 25,210 22,164
1,995 25,870 22,226
1,996 26,389 23,650
1,997 27,697 22,436
1,998 28,781 24,200
1,999 27,632 26,271
2,000 29,427 26,587
2,001 28,581 26,903
2,002 26,929 27,220
2,003 28,425 22,288
2,004 31,036 22,350
2,005 32,526 22,412
2,006 32,187 23,650
2,007 31,944 22,436
2,008 33,308 20,977
2,009 31,609 20,248
2,010 32,500 19,519
2,011 32,672 18,790
2,012 33,859 18,061
2,013 32,890 17,331
2,014 32,935 16,602
2,015 34,190 15,873
2,016 35,170 15,144

OPEC DATA 19
Years
Nominal ORB
price
Compliance
rate
1983 26 -31%
1984 24 -32%
1985 27 -42%
1986 26 -33%
1987 22 -25%
1988 26 -22%
1989 25 -16%
1990 26 -11%
1991 27 -13%
1992 29 -8%
1993 25 11%
1994 22 12%
1995 24 14%
1996 24 10%
1997 28 19%
1998 29 16%
1999 30 5%
2000 27.6 10%
2001 23.1 6%
2002 24.4 -1%
2003 28.1 22%
2004 36.0 28%
2005 50.6 31%
2006 61.1 27%
2007 69.1 30%
2008 94.5 37%
2009 61.1 36%
2010 77.5 40%
2011 107.5 42%
2012 109.5 47%
2013 105.9 47%
2014 96.3 50%
2015 49.5 54%
2016 40.0 57%
2017 45.0 59%
1 out of 19
Related Documents

Your All-in-One AI-Powered Toolkit for Academic Success.
 +13062052269
info@desklib.com
Available 24*7 on WhatsApp / Email
Unlock your academic potential
© 2024  |  Zucol Services PVT LTD  |  All rights reserved.