A Study on Parental Engagement and its Effect on Student Scores
VerifiedAdded on 2023/06/09
|9
|2278
|431
Report
AI Summary
This report investigates the relationship between parental engagement in a student's academic life and their academic performance, focusing on high school students. Using secondary data, the study examines the impact of factors like the length of parent-teacher meetings, student attitude, and parental attendance on student scores in mathematics and chemistry. Statistical analysis, including descriptive statistics and ordinary least squares regression, is employed to test hypotheses regarding the effect of these factors. The findings suggest that there is no significant relationship between the length of parent meetings and student performance, nor do the explored factors jointly affect student performance. The report concludes with recommendations for fostering better parental-student relationships, encouraging self-motivation in students, and ensuring that school meetings are purposeful to enhance student outcomes. Desklib provides access to this and many other student-contributed assignments.
1. Introduction
1.1 Background to study
A number of studies conducted have hypothesized and proved that student performance is often
susceptible to both individual and external influences. Factors such as student attitude towards a
subject or teacher and the amount of time spent engaging in personal study have been directly
linked to student performance. Liddell et al. (2004) on their paper on student attitudes and their
academic performance support the theory of attitude having an effect on student performance.
Elsewhere, Singh (2011) states that often “… Achievement motivation is the need to perform
well…” he further argues that such a motivation is related to a student’s discipline. Other factors
that are hypothesized to affect student performance are socio-economic and family background.
In a study conducted by Adrian, Kamilla and Marc on the effect of guardian engagement on
student performance, they note that there is mixed outcomes on parental behavioral change upon
attendance of academic meetings, however they note no effect on the performance of the student.
1.2 Scope of study
This paper will focus on the performance of high school students owing the role played by
parents in their academic life through attendance of school meetings and meeting the student
wards. It will examine whether there exists a relationship between the dependent variable
(student performance) and the independent variables (parent activities)
1.3 Purpose of study
To determine the relationship between parent engagement in student academic life with the
student’s academic performance
1.4 Research Questions
There are three sets of questions designed for this study which aid in research specificity to the
purpose, they include:
i. Does the length of parent meeting with teachers affect the student performance
ii. Is there a relationship between the student attitude together with parent meeting with
student performance
iii. Is there any relationship between factors that influence academic performance and
academic achievement of students?
Paraphrase This Document
Need a fresh take? Get an instant paraphrase of this document with our AI Paraphraser
2. Methodology
2.1 Data
The dataset for this study is developed from secondary sources from previous studies conducted
on the role of parents in a students’ academic life. There are two dependent variables, i.e.
Mathematics score and Chemistry score measured before and after parent meeting with student
wards. The independent variables include:
i. Attitude of student
ii. Length of the meeting (duration that the meeting took)
iii. Number of parents that attended the meetings
The data is coded such that parent attendance takes the value 1 if present and 0 if absent. The
variable of attitude of student assumes 1 if positive, 2 if moderate and 3 if negative, whereas the
length of meeting is measured in hours.
2.2 Research instruments
The statistical package for social sciences is used as the data analysis tool for the research
project.
2.3 Process
To examine the underlying structure of the data so as to enable hypothesis testing, the research is
designed to employ inferential statistical analysis using the ordinary least squares regression as
the statistical model. The study will also use descriptive statistical analysis to explore the
distribution of the various variables and report on the results using both visualization tools and
tables together with the analysis.
2.4 Hypotheses
There are two sets of hypotheses to enable answering of the research questions:
Null hypothesis 1
H0: The length of parent meeting with teachers has a positive effect on student performance
Alternative hypothesis 1
Ha: The length of parents’ meeting with teachers has no significant effect on student academic
performance
Null hypothesis 2
H0: Academic performance is affected by combination of individual and external factors
Ha: Academic performance is not affected by any factor be it individual or external
3. Data results and Data Analysis
3.1 Descriptive statistics
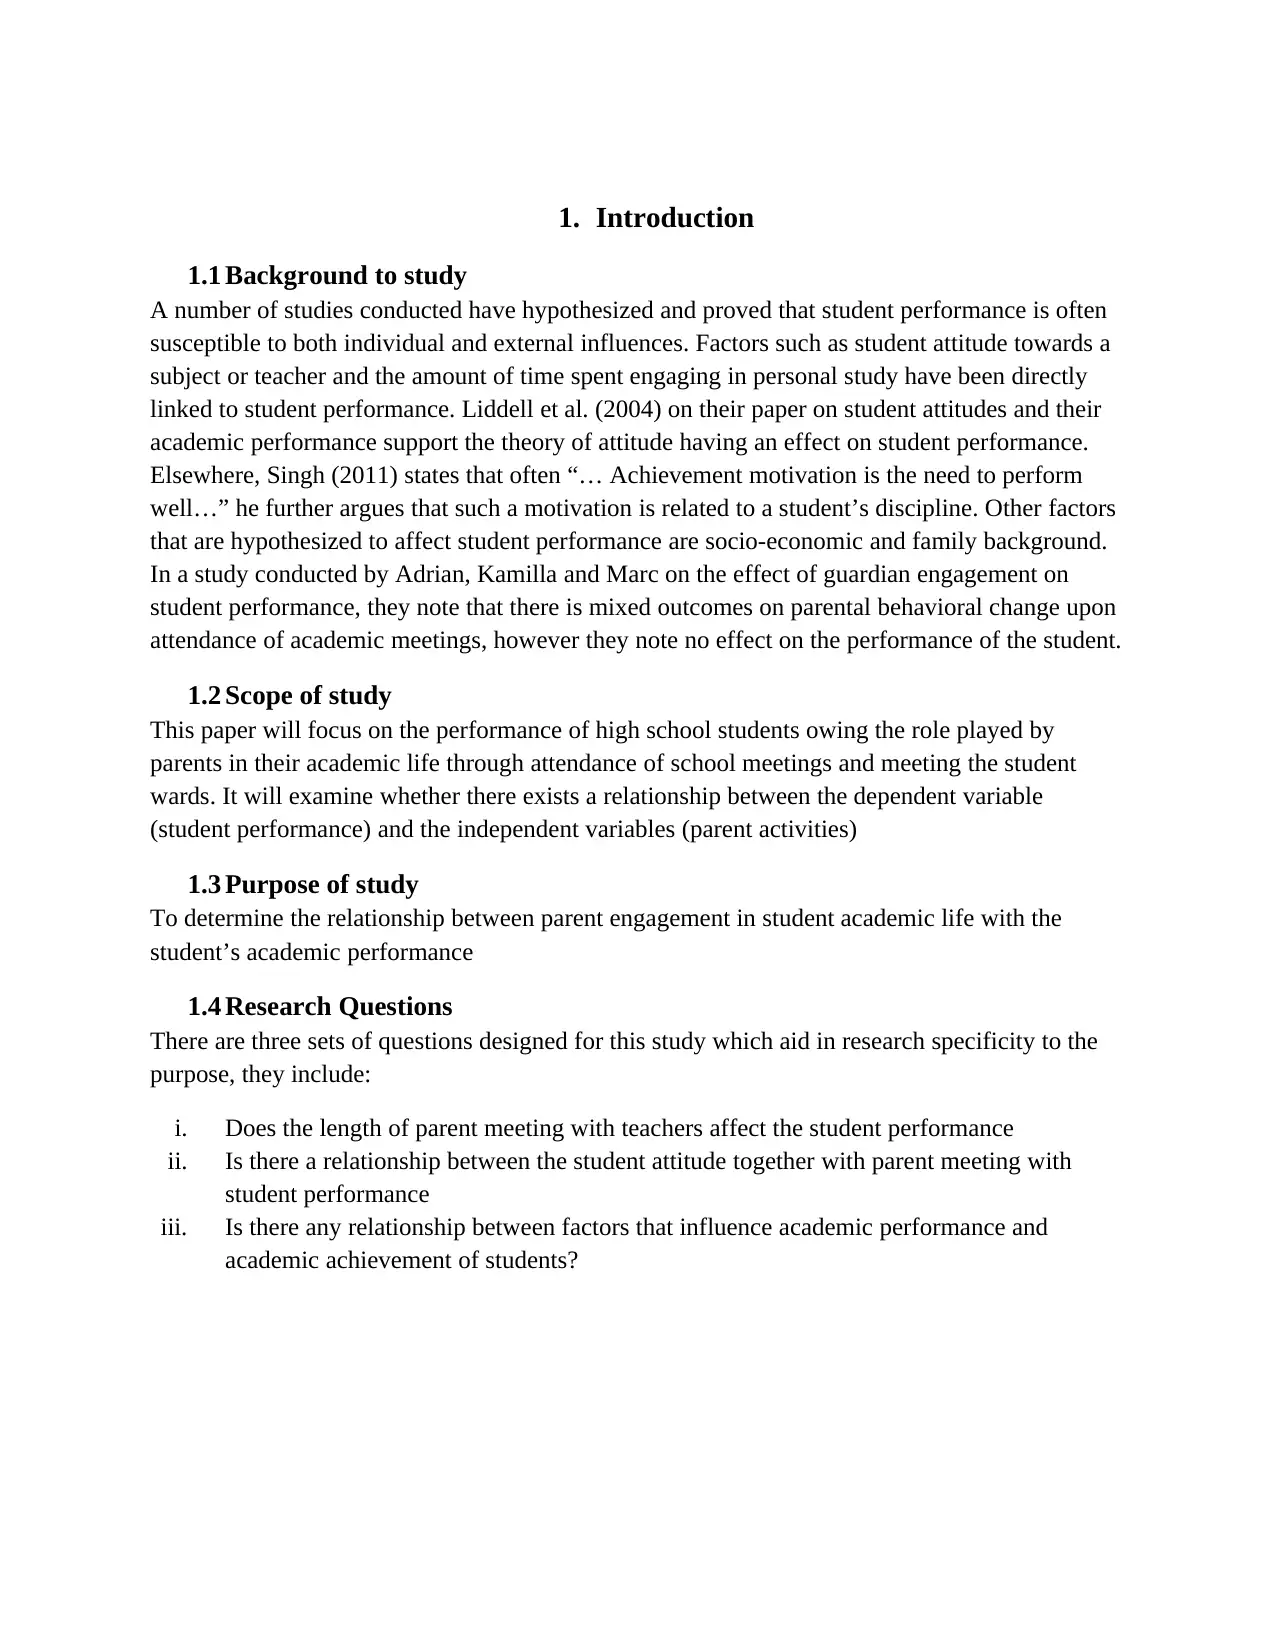
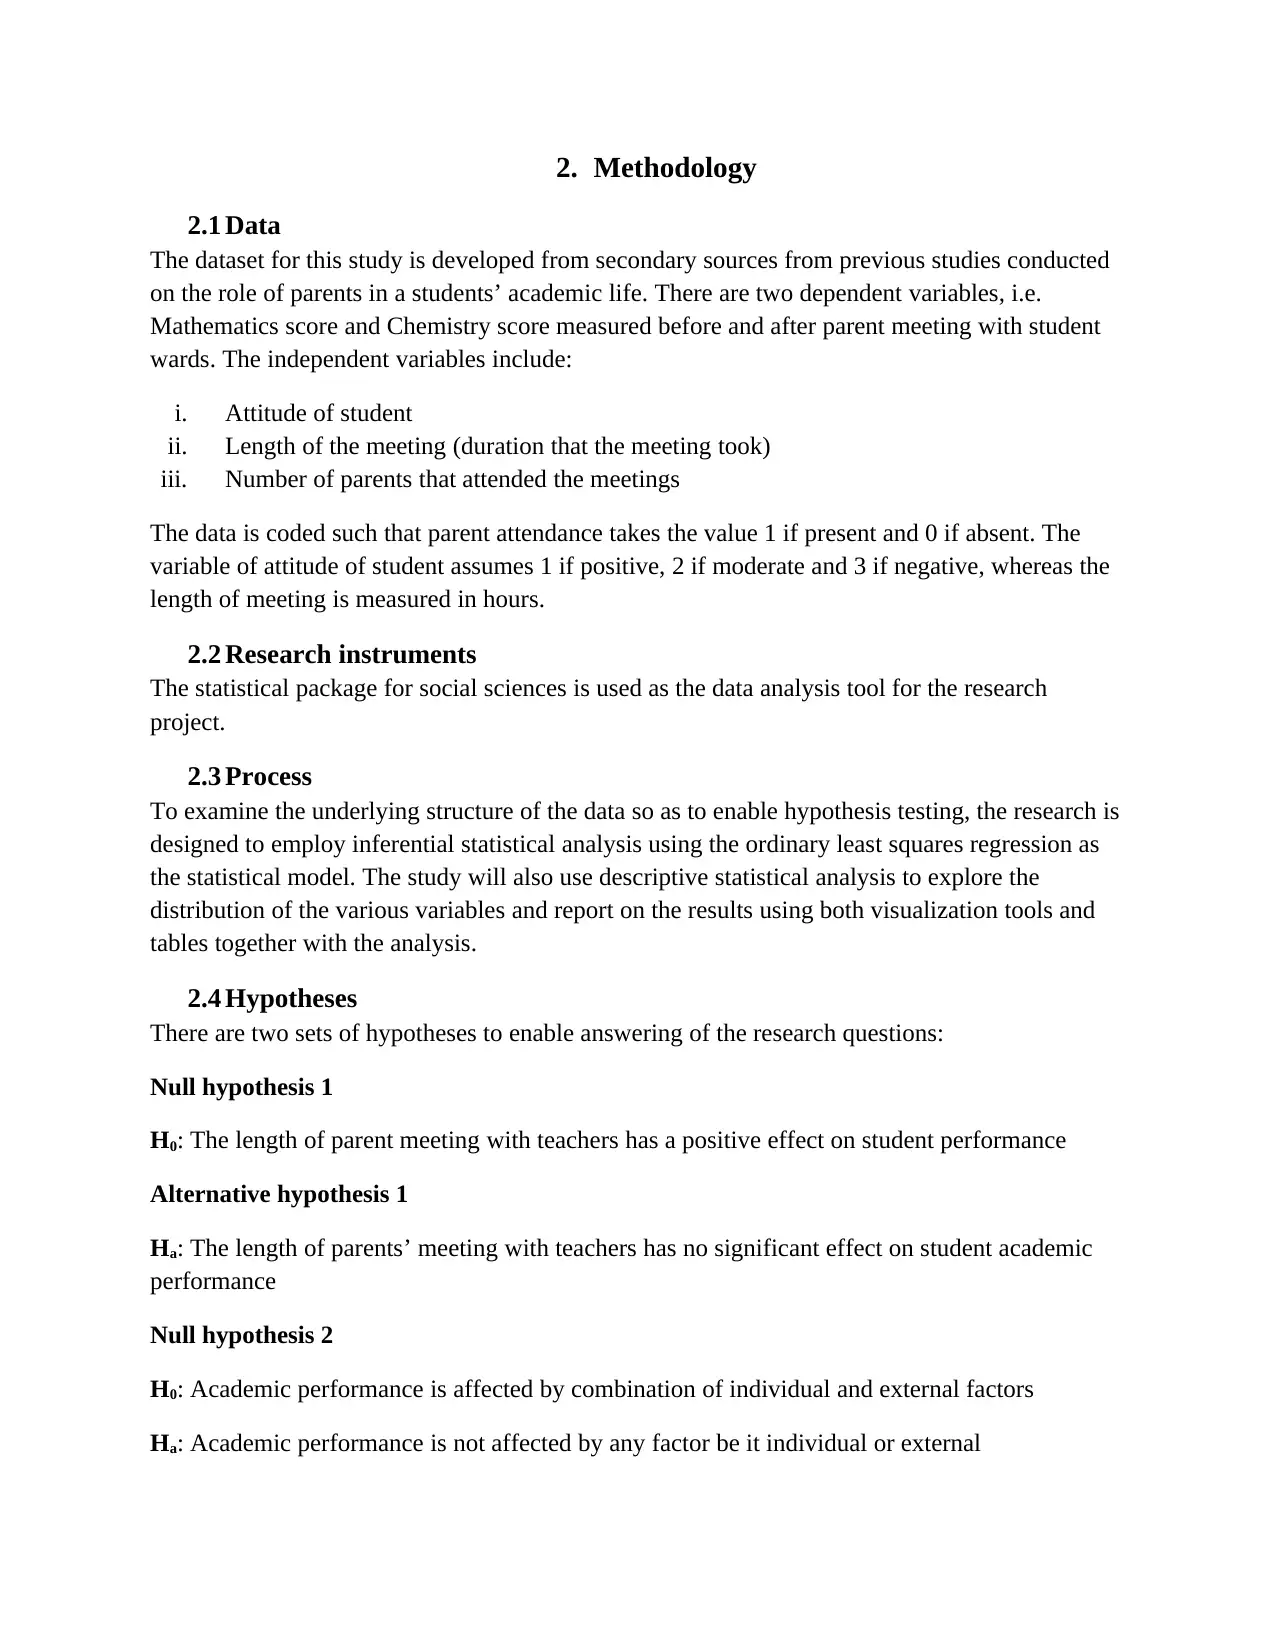
From table 1 below, the total number of parents who attended the parent-teacher meetings are 81,
the average amount of time spent by all the visiting parents to see the teachers is approximately 1
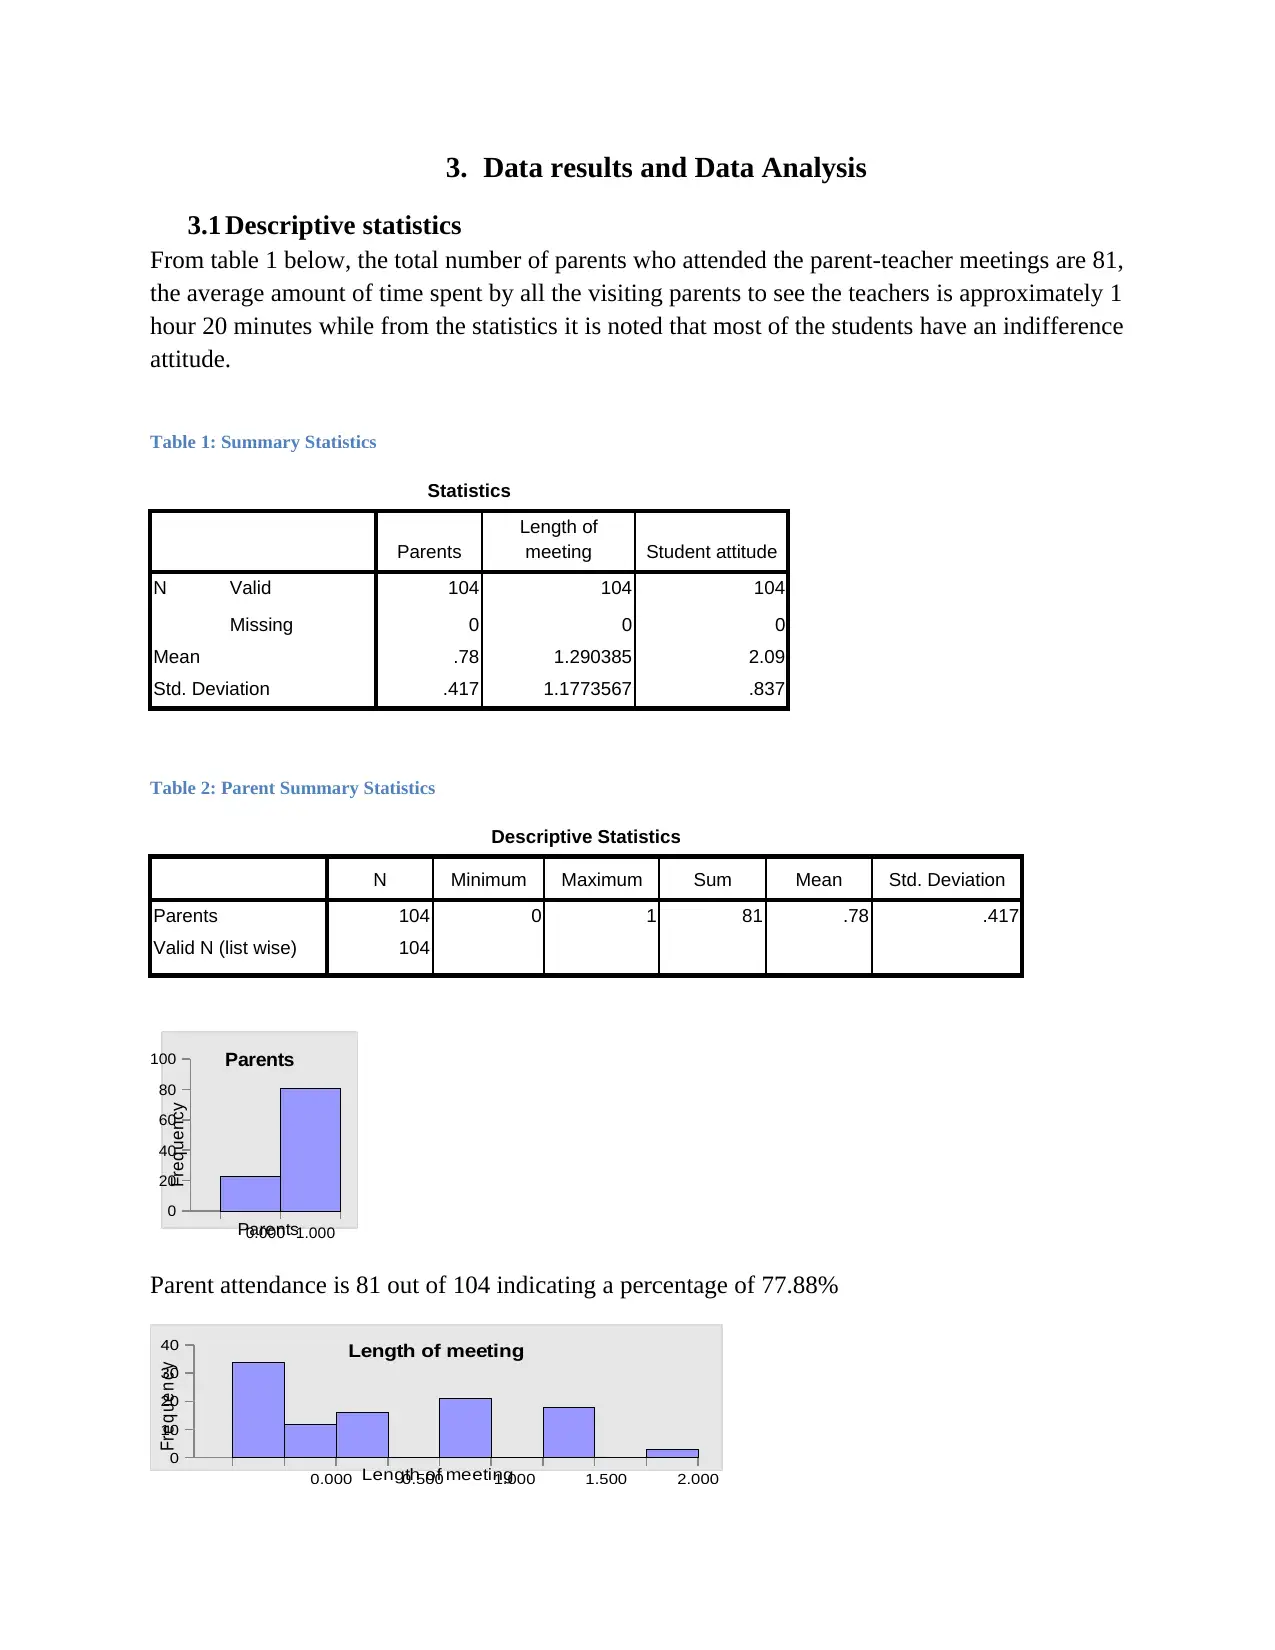
hour 20 minutes while from the statistics it is noted that most of the students have an indifference
attitude.
Table 1: Summary Statistics
Statistics
Parents
Length of
meeting Student attitude
N Valid 104 104 104
Missing 0 0 0
Mean .78 1.290385 2.09
Std. Deviation .417 1.1773567 .837
Table 2: Parent Summary Statistics
Descriptive Statistics
N Minimum Maximum Sum Mean Std. Deviation
Parents 104 0 1 81 .78 .417
Valid N (list wise) 104
0.000 1.000
0
20
40
60
80
100 Parents
Parents
Frequency
Parent attendance is 81 out of 104 indicating a percentage of 77.88%
0.000 0.500 1.000 1.500 2.000
0
10
20
30
40 Length of meeting
Length of meeting
Fre q u e n cy
3.1 Descriptive statistics
From table 1 below, the total number of parents who attended the parent-teacher meetings are 81,
the average amount of time spent by all the visiting parents to see the teachers is approximately 1
hour 20 minutes while from the statistics it is noted that most of the students have an indifference
attitude.
Table 1: Summary Statistics
Statistics
Parents
Length of
meeting Student attitude
N Valid 104 104 104
Missing 0 0 0
Mean .78 1.290385 2.09
Std. Deviation .417 1.1773567 .837
Table 2: Parent Summary Statistics
Descriptive Statistics
N Minimum Maximum Sum Mean Std. Deviation
Parents 104 0 1 81 .78 .417
Valid N (list wise) 104
0.000 1.000
0
20
40
60
80
100 Parents
Parents
Frequency
Parent attendance is 81 out of 104 indicating a percentage of 77.88%
0.000 0.500 1.000 1.500 2.000
0
10
20
30
40 Length of meeting
Length of meeting
Fre q u e n cy
⊘ This is a preview!⊘
Do you want full access?
Subscribe today to unlock all pages.
Trusted by 1+ million students worldwide
1.000 2.000 3.000
33.0
33.5
34.0
34.5
35.0
35.5
36.0
36.5 Student attitude
Student attitude
Frequency
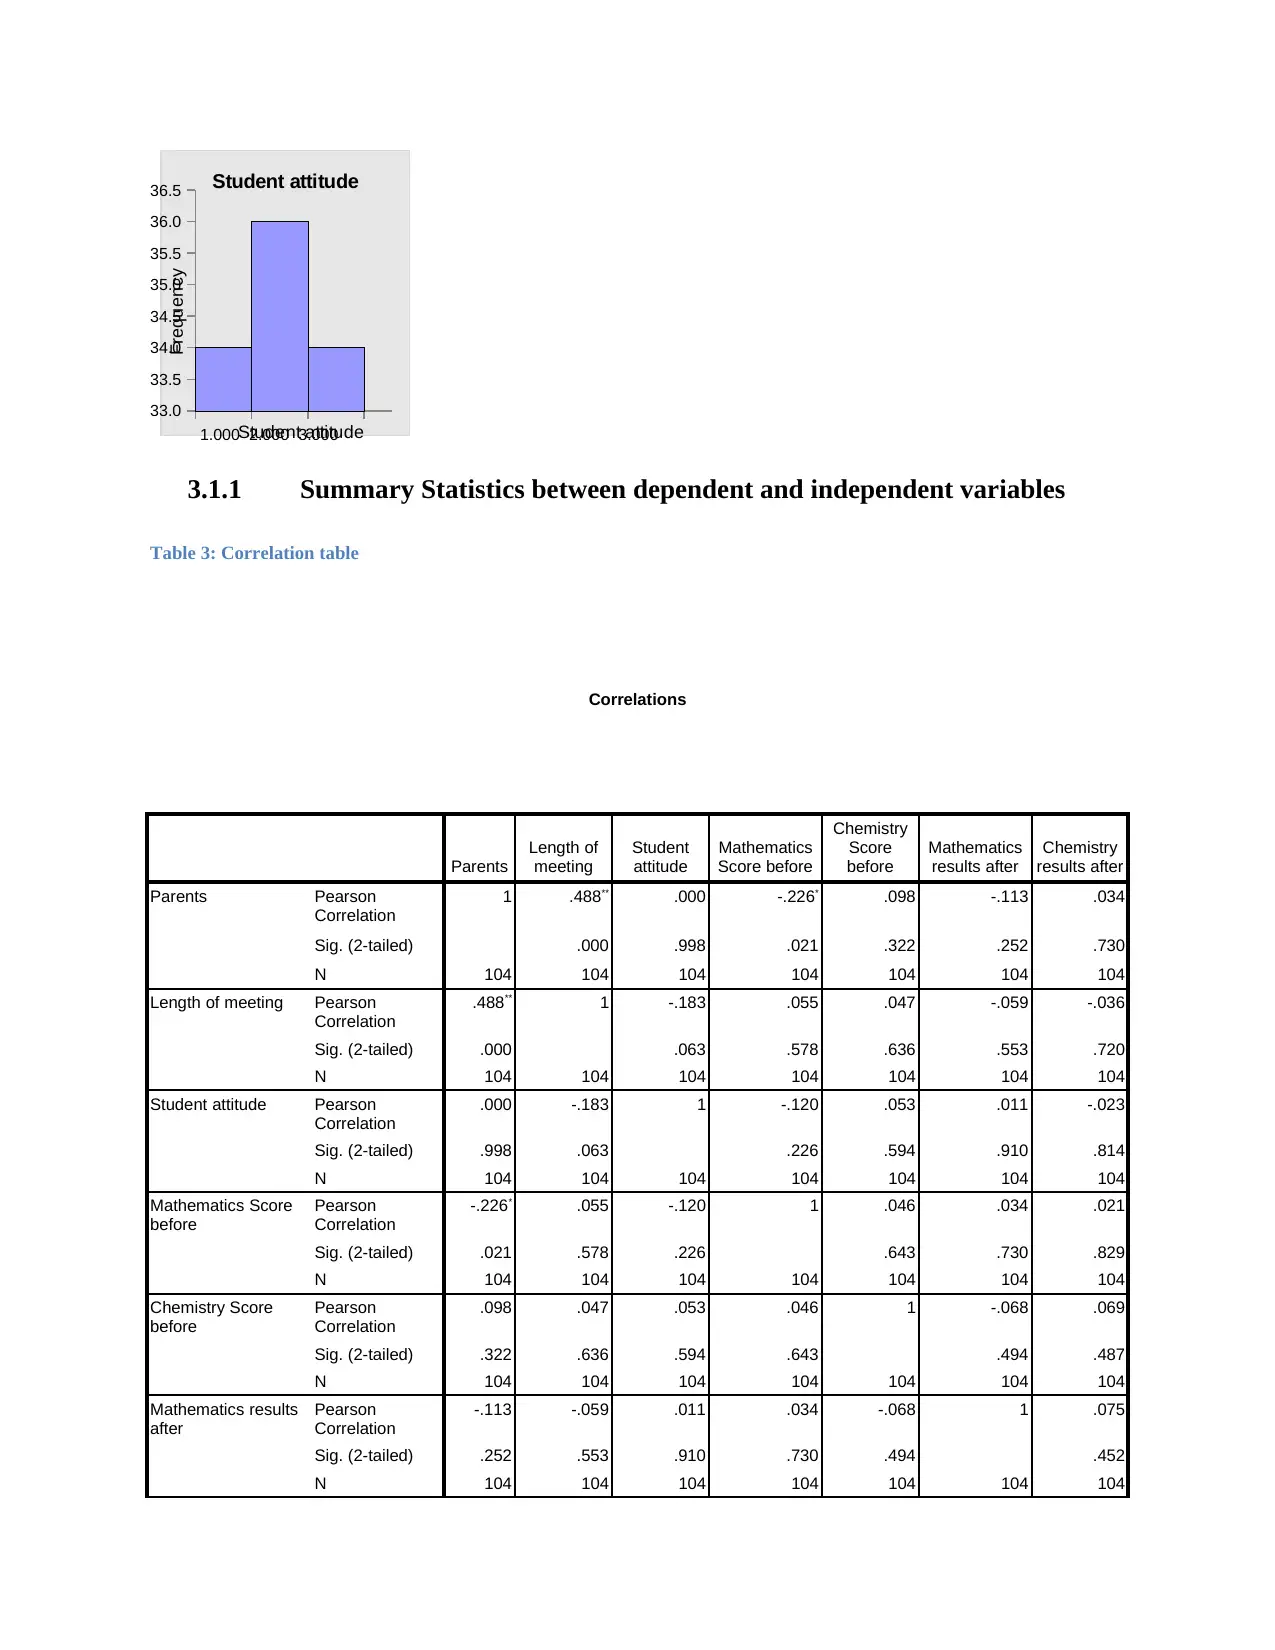
3.1.1 Summary Statistics between dependent and independent variables
Table 3: Correlation table
Correlations
Parents
Length of
meeting
Student
attitude
Mathematics
Score before
Chemistry
Score
before
Mathematics
results after
Chemistry
results after
Parents Pearson
Correlation
1 .488** .000 -.226* .098 -.113 .034
Sig. (2-tailed) .000 .998 .021 .322 .252 .730
N 104 104 104 104 104 104 104
Length of meeting Pearson
Correlation
.488** 1 -.183 .055 .047 -.059 -.036
Sig. (2-tailed) .000 .063 .578 .636 .553 .720
N 104 104 104 104 104 104 104
Student attitude Pearson
Correlation
.000 -.183 1 -.120 .053 .011 -.023
Sig. (2-tailed) .998 .063 .226 .594 .910 .814
N 104 104 104 104 104 104 104
Mathematics Score
before
Pearson
Correlation
-.226* .055 -.120 1 .046 .034 .021
Sig. (2-tailed) .021 .578 .226 .643 .730 .829
N 104 104 104 104 104 104 104
Chemistry Score
before
Pearson
Correlation
.098 .047 .053 .046 1 -.068 .069
Sig. (2-tailed) .322 .636 .594 .643 .494 .487
N 104 104 104 104 104 104 104
Mathematics results
after
Pearson
Correlation
-.113 -.059 .011 .034 -.068 1 .075
Sig. (2-tailed) .252 .553 .910 .730 .494 .452
N 104 104 104 104 104 104 104
33.0
33.5
34.0
34.5
35.0
35.5
36.0
36.5 Student attitude
Student attitude
Frequency
3.1.1 Summary Statistics between dependent and independent variables
Table 3: Correlation table
Correlations
Parents
Length of
meeting
Student
attitude
Mathematics
Score before
Chemistry
Score
before
Mathematics
results after
Chemistry
results after
Parents Pearson
Correlation
1 .488** .000 -.226* .098 -.113 .034
Sig. (2-tailed) .000 .998 .021 .322 .252 .730
N 104 104 104 104 104 104 104
Length of meeting Pearson
Correlation
.488** 1 -.183 .055 .047 -.059 -.036
Sig. (2-tailed) .000 .063 .578 .636 .553 .720
N 104 104 104 104 104 104 104
Student attitude Pearson
Correlation
.000 -.183 1 -.120 .053 .011 -.023
Sig. (2-tailed) .998 .063 .226 .594 .910 .814
N 104 104 104 104 104 104 104
Mathematics Score
before
Pearson
Correlation
-.226* .055 -.120 1 .046 .034 .021
Sig. (2-tailed) .021 .578 .226 .643 .730 .829
N 104 104 104 104 104 104 104
Chemistry Score
before
Pearson
Correlation
.098 .047 .053 .046 1 -.068 .069
Sig. (2-tailed) .322 .636 .594 .643 .494 .487
N 104 104 104 104 104 104 104
Mathematics results
after
Pearson
Correlation
-.113 -.059 .011 .034 -.068 1 .075
Sig. (2-tailed) .252 .553 .910 .730 .494 .452
N 104 104 104 104 104 104 104
Paraphrase This Document
Need a fresh take? Get an instant paraphrase of this document with our AI Paraphraser
Chemistry results
after
Pearson
Correlation
.034 -.036 -.023 .021 .069 .075 1
Sig. (2-tailed) .730 .720 .814 .829 .487 .452
N 104 104 104 104 104 104 104
**. Correlation is significant at the 0.01 level (2-tailed).
*. Correlation is significant at the 0.05 level (2-tailed).
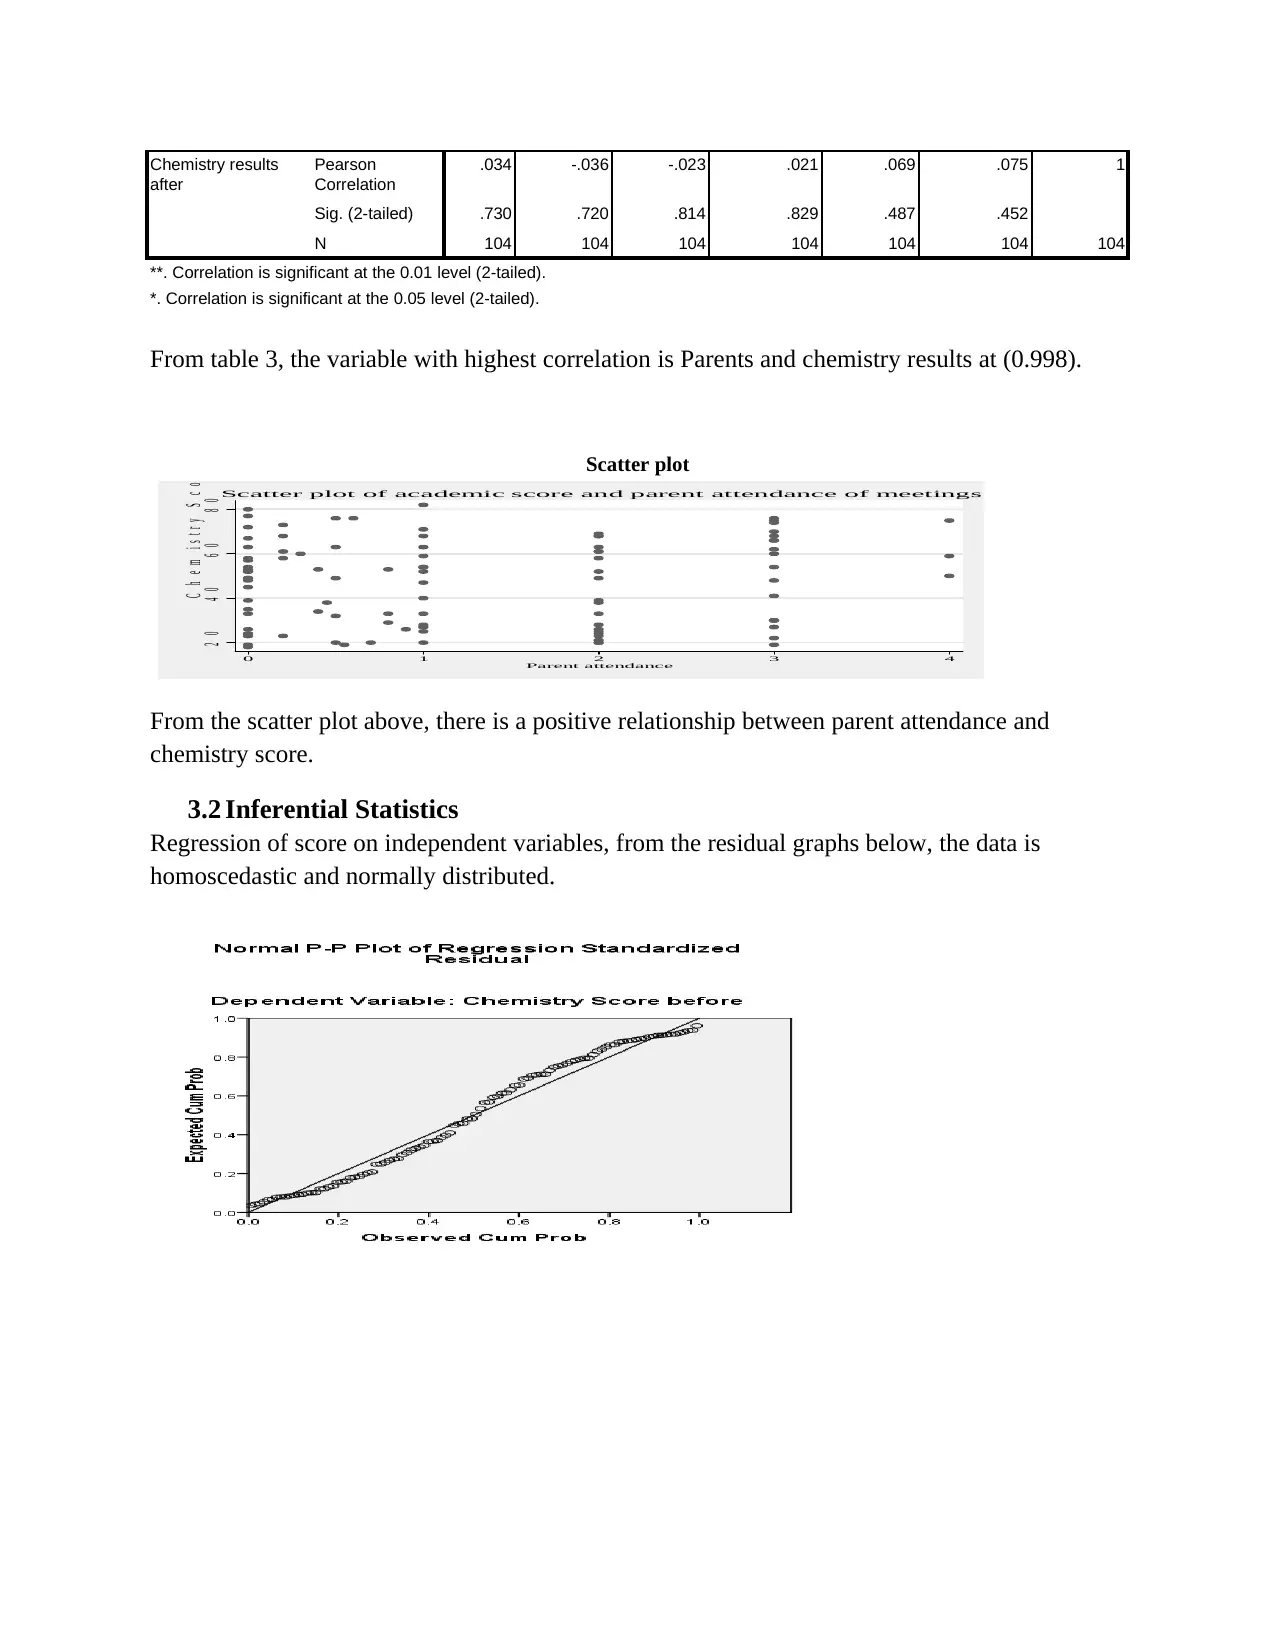
From table 3, the variable with highest correlation is Parents and chemistry results at (0.998).
Scatter plot
2 0 4 0 6 0 8 0
C h e m i s t r y S c o r e
0 1 2 3 4
Parent attendance
Scatter plot of academic score and parent attendance of meetings
From the scatter plot above, there is a positive relationship between parent attendance and
chemistry score.
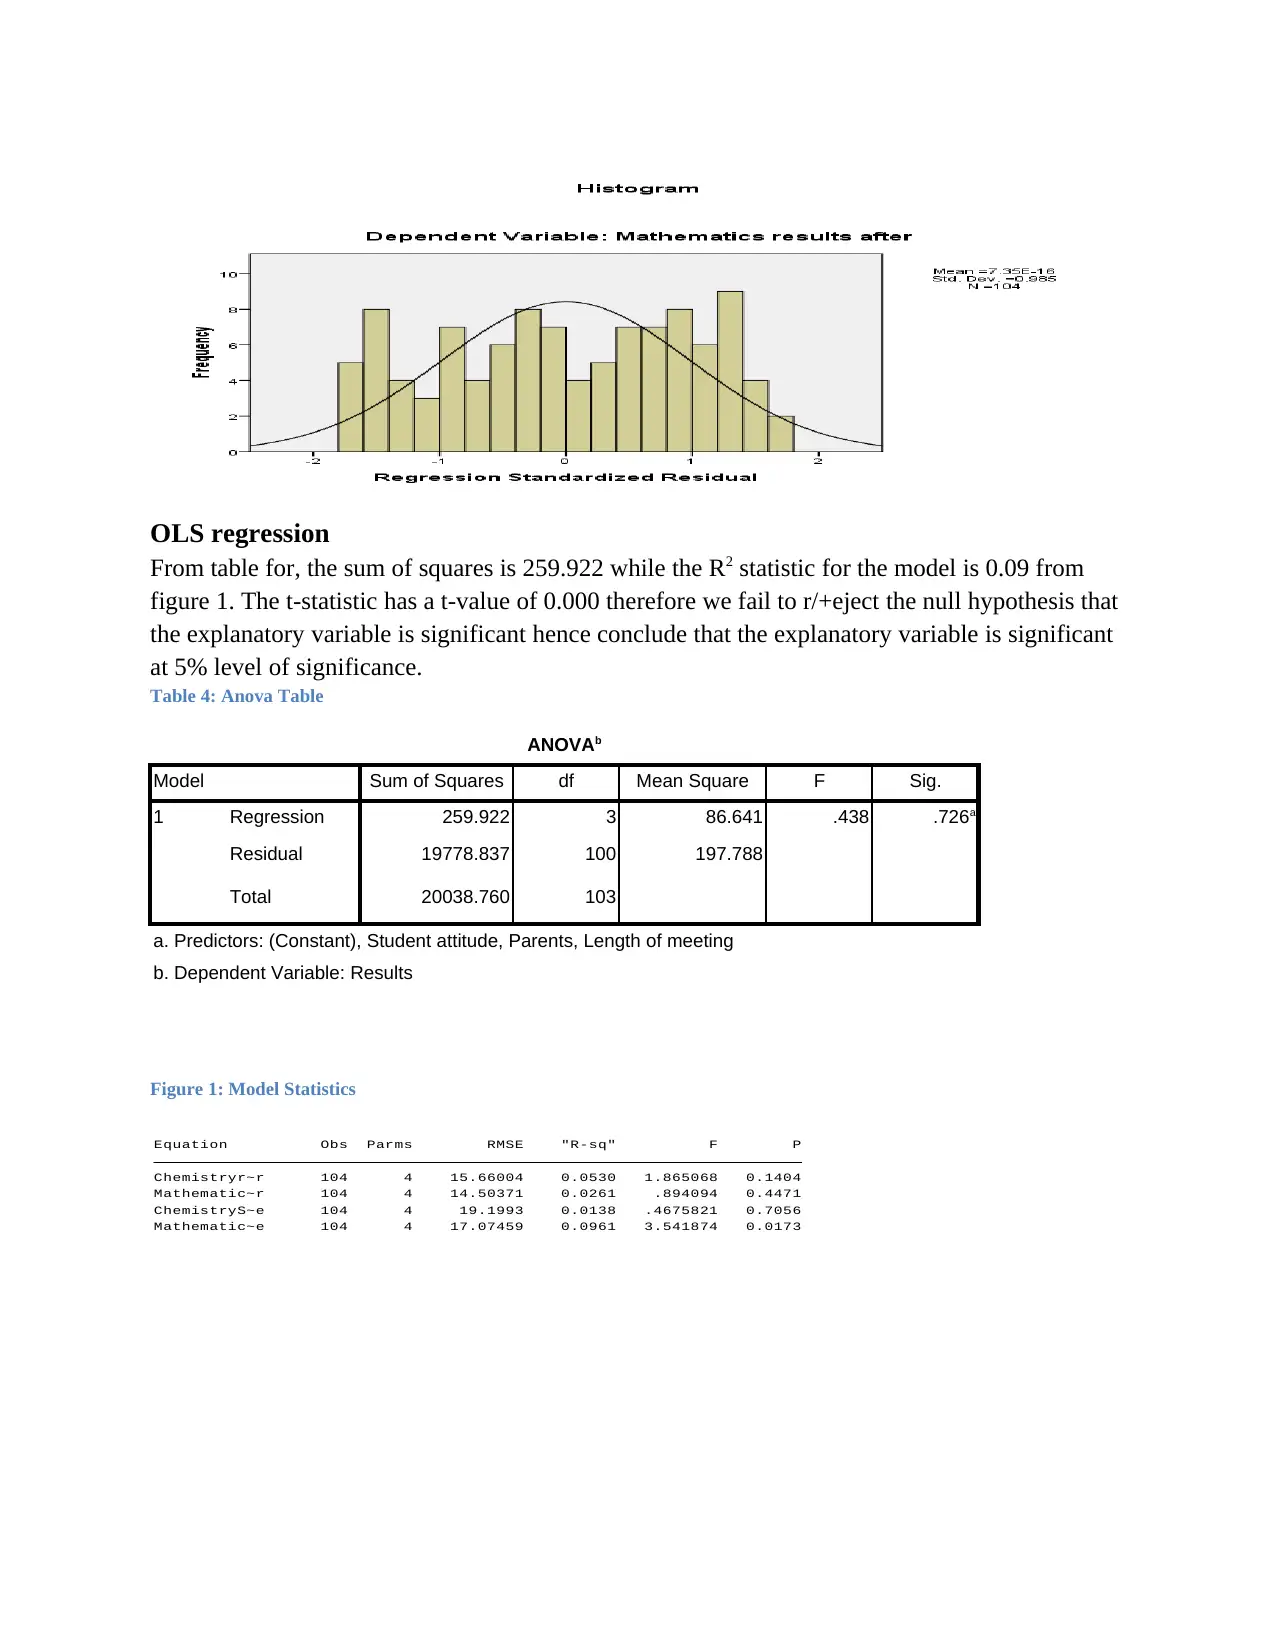
3.2 Inferential Statistics
Regression of score on independent variables, from the residual graphs below, the data is
homoscedastic and normally distributed.
after
Pearson
Correlation
.034 -.036 -.023 .021 .069 .075 1
Sig. (2-tailed) .730 .720 .814 .829 .487 .452
N 104 104 104 104 104 104 104
**. Correlation is significant at the 0.01 level (2-tailed).
*. Correlation is significant at the 0.05 level (2-tailed).
From table 3, the variable with highest correlation is Parents and chemistry results at (0.998).
Scatter plot
2 0 4 0 6 0 8 0
C h e m i s t r y S c o r e
0 1 2 3 4
Parent attendance
Scatter plot of academic score and parent attendance of meetings
From the scatter plot above, there is a positive relationship between parent attendance and
chemistry score.
3.2 Inferential Statistics
Regression of score on independent variables, from the residual graphs below, the data is
homoscedastic and normally distributed.
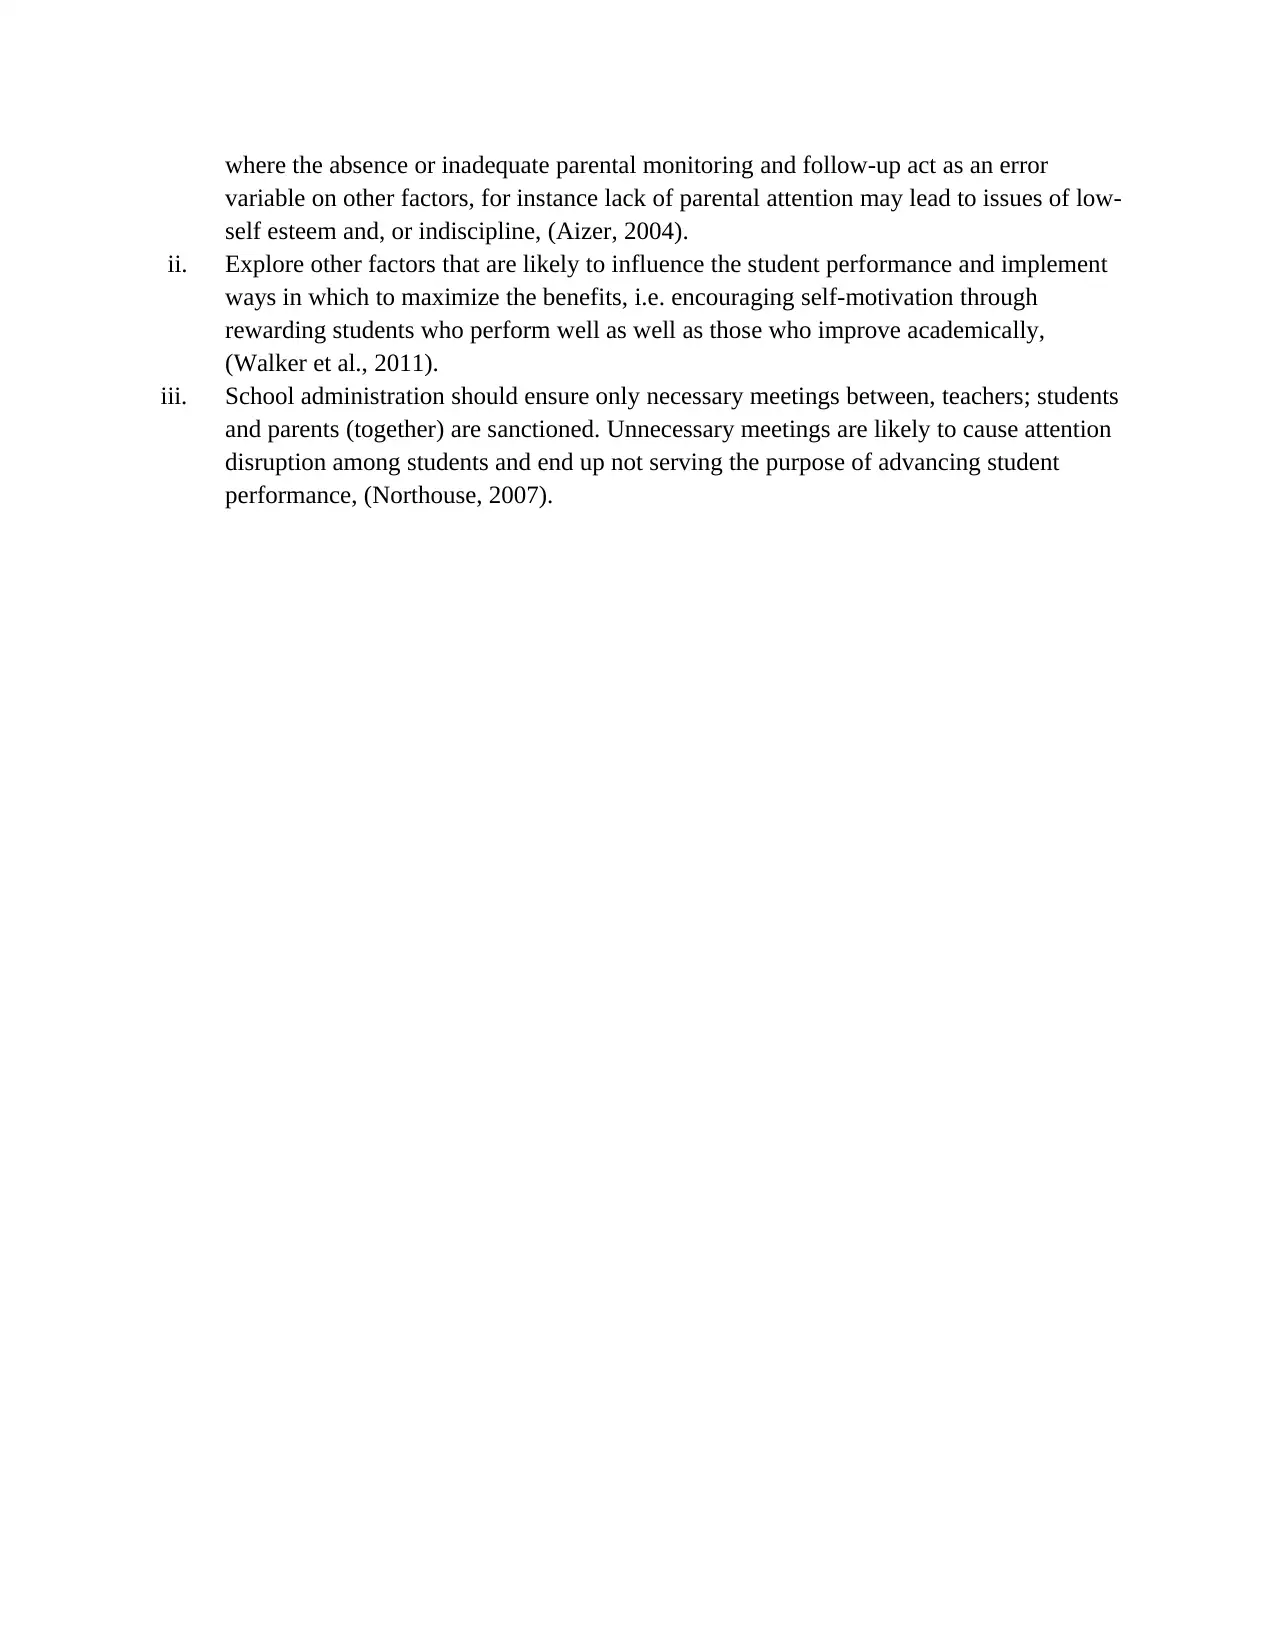
OLS regression
From table for, the sum of squares is 259.922 while the R2 statistic for the model is 0.09 from
figure 1. The t-statistic has a t-value of 0.000 therefore we fail to r/+eject the null hypothesis that
the explanatory variable is significant hence conclude that the explanatory variable is significant
at 5% level of significance.
Table 4: Anova Table
ANOVAb
Model Sum of Squares df Mean Square F Sig.
1 Regression 259.922 3 86.641 .438 .726a
Residual 19778.837 100 197.788
Total 20038.760 103
a. Predictors: (Constant), Student attitude, Parents, Length of meeting
b. Dependent Variable: Results
Figure 1: Model Statistics
Mathematic~e 104 4 17.07459 0.0961 3.541874 0.0173
ChemistryS~e 104 4 19.1993 0.0138 .4675821 0.7056
Mathematic~r 104 4 14.50371 0.0261 .894094 0.4471
Chemistryr~r 104 4 15.66004 0.0530 1.865068 0.1404
Equation Obs Parms RMSE "R-sq" F P
⊘ This is a preview!⊘
Do you want full access?
Subscribe today to unlock all pages.
Trusted by 1+ million students worldwide
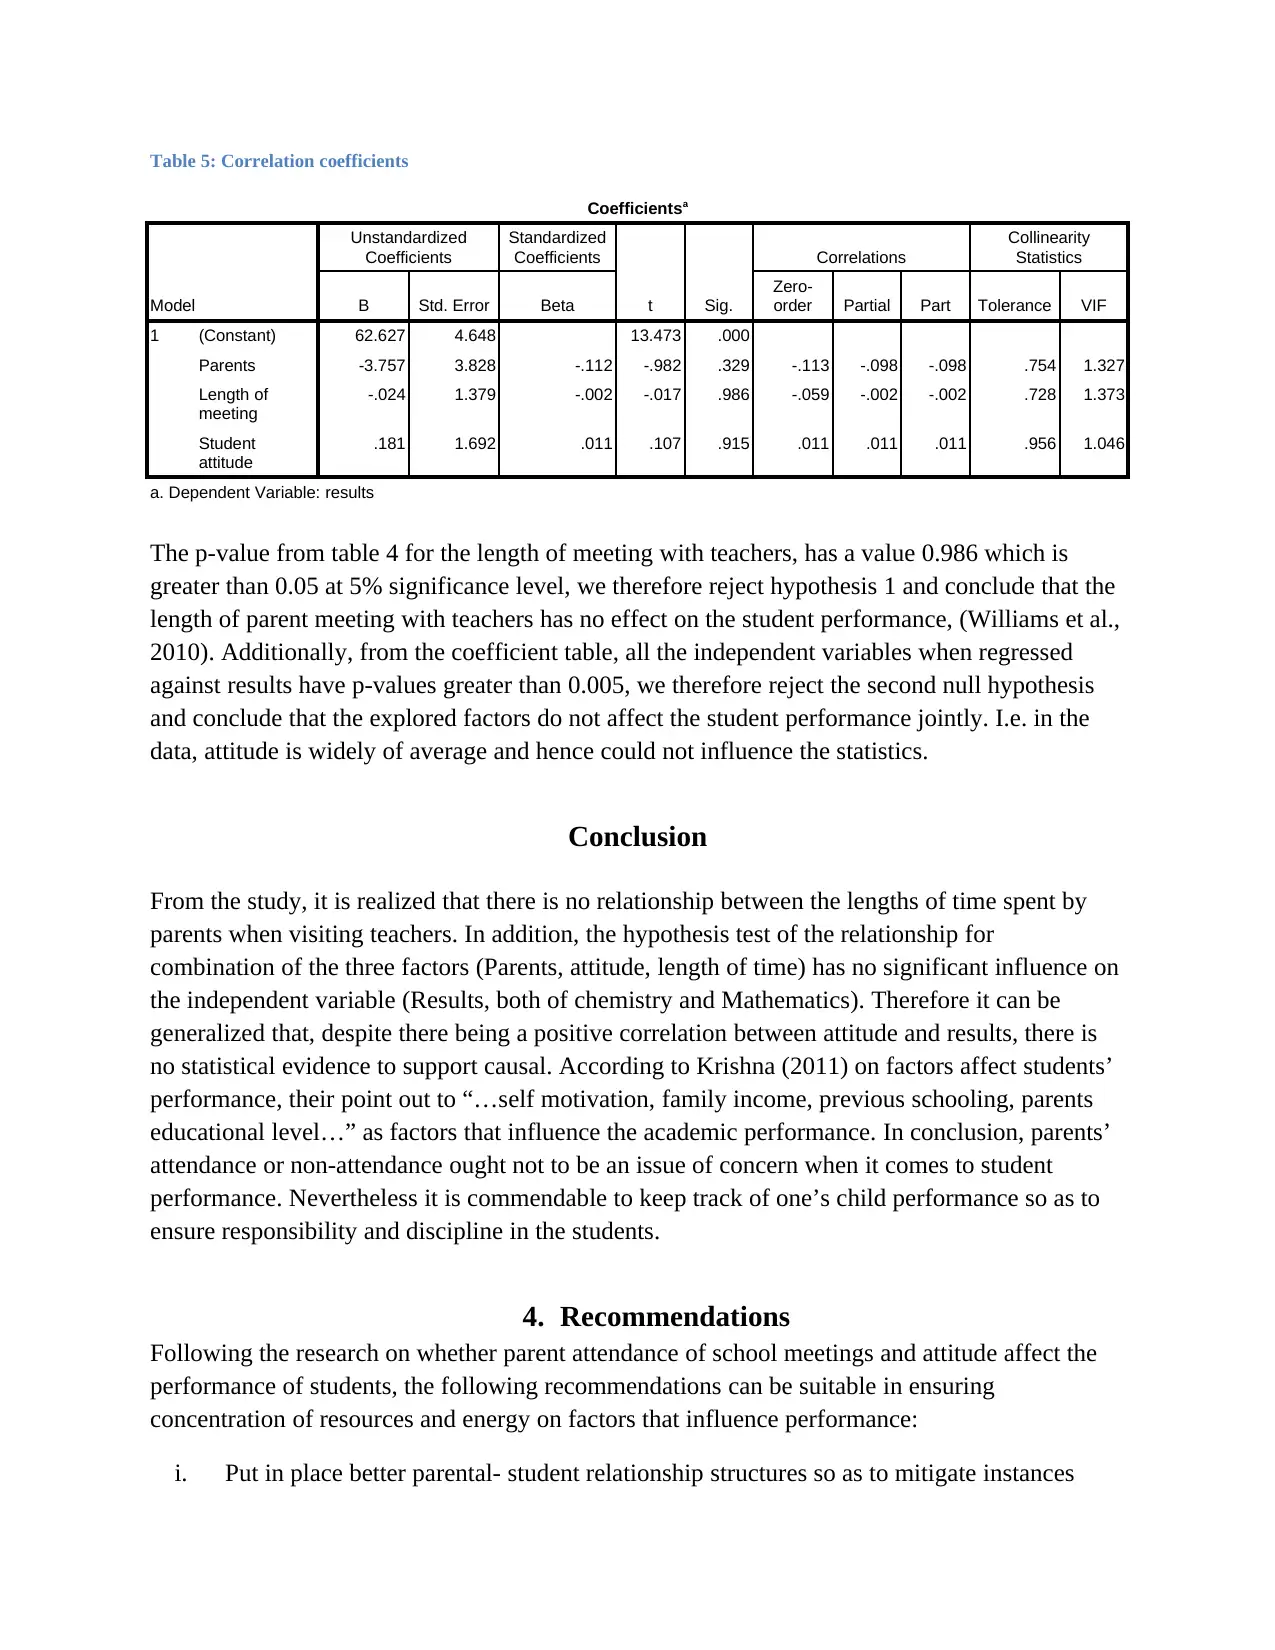
Table 5: Correlation coefficients
Coefficientsa
Model
Unstandardized
Coefficients
Standardized
Coefficients
t Sig.
Correlations
Collinearity
Statistics
B Std. Error Beta
Zero-
order Partial Part Tolerance VIF
1 (Constant) 62.627 4.648 13.473 .000
Parents -3.757 3.828 -.112 -.982 .329 -.113 -.098 -.098 .754 1.327
Length of
meeting
-.024 1.379 -.002 -.017 .986 -.059 -.002 -.002 .728 1.373
Student
attitude
.181 1.692 .011 .107 .915 .011 .011 .011 .956 1.046
a. Dependent Variable: results
The p-value from table 4 for the length of meeting with teachers, has a value 0.986 which is
greater than 0.05 at 5% significance level, we therefore reject hypothesis 1 and conclude that the
length of parent meeting with teachers has no effect on the student performance, (Williams et al.,
2010). Additionally, from the coefficient table, all the independent variables when regressed
against results have p-values greater than 0.005, we therefore reject the second null hypothesis
and conclude that the explored factors do not affect the student performance jointly. I.e. in the
data, attitude is widely of average and hence could not influence the statistics.
Conclusion
From the study, it is realized that there is no relationship between the lengths of time spent by
parents when visiting teachers. In addition, the hypothesis test of the relationship for
combination of the three factors (Parents, attitude, length of time) has no significant influence on
the independent variable (Results, both of chemistry and Mathematics). Therefore it can be
generalized that, despite there being a positive correlation between attitude and results, there is
no statistical evidence to support causal. According to Krishna (2011) on factors affect students’
performance, their point out to “…self motivation, family income, previous schooling, parents
educational level…” as factors that influence the academic performance. In conclusion, parents’
attendance or non-attendance ought not to be an issue of concern when it comes to student
performance. Nevertheless it is commendable to keep track of one’s child performance so as to
ensure responsibility and discipline in the students.
4. Recommendations
Following the research on whether parent attendance of school meetings and attitude affect the
performance of students, the following recommendations can be suitable in ensuring
concentration of resources and energy on factors that influence performance:
i. Put in place better parental- student relationship structures so as to mitigate instances
Paraphrase This Document
Need a fresh take? Get an instant paraphrase of this document with our AI Paraphraser
where the absence or inadequate parental monitoring and follow-up act as an error
variable on other factors, for instance lack of parental attention may lead to issues of low-
self esteem and, or indiscipline, (Aizer, 2004).
ii. Explore other factors that are likely to influence the student performance and implement
ways in which to maximize the benefits, i.e. encouraging self-motivation through
rewarding students who perform well as well as those who improve academically,
(Walker et al., 2011).
iii. School administration should ensure only necessary meetings between, teachers; students
and parents (together) are sanctioned. Unnecessary meetings are likely to cause attention
disruption among students and end up not serving the purpose of advancing student
performance, (Northouse, 2007).
5. Bibliography
Adrien, B., Kamilla, G. and Marc, G. (2015). Parent’s Participation, Involvement and Impact on
Student Achievement: Evidence from a Randomized Evaluation in South Africa. Paris
School of Economics, 1(3): 45-36
Walker, S. P., Chang, S. M., Vera-Hernandez, M., and Grantham-McGregor, S. (2011). Early
childhood stimulation benefits adult competence and reduces violent behavior.
Pediatrics, 127(5):845-857
Nye, C., Turner, H., and Schwartz, J. (2006). Approaches to parent involvement for improving
the academic performance of elementary school age children. Technical report. The
Campbell Collaboration.
Northouse, P. (2007). Leadership Theory and Practice. Thousand Oaks, CA: Sage
Publications, Inc.
Krishna Y.(2011). The impact of parental involvement on student achievement. ProQuest LLC,
789 East Eisenhower Parkway: Ann Habor
Christenson, S., & Sheridan, S. (2001). Schools and Families: Creating essential connections for
learning. NY: Guilford.
Aizer, A. (2004). Home alone: supervision after school and child behavior. Journal of Public
Economics, 88(9-10):1835–1848
Williams, B., Onsman, A., & Brown, T. (2010). Exploratory factor analysis: A five-step guide
for novices. Australasian Journal of Paramedicine, 8(3).
Cunha, F., Heckman, J. J., and Schennach, S. M. (2010). Estimating the Technology of
Cognitive and Noncognitive Skill Formation. Econometrica, 78(3):883–931
Banerjee, A. V., Banerji, R., Duflo, E., Glennerster, R., and Khemani, S. (2010). Pitfalls of
Participatory Programs: Evidence from a Randomized Evaluation in Education in India.
American Economic Journal: Economic Policy, 2(1):1–30
⊘ This is a preview!⊘
Do you want full access?
Subscribe today to unlock all pages.
Trusted by 1+ million students worldwide
1 out of 9
Related Documents


Your All-in-One AI-Powered Toolkit for Academic Success.
+13062052269
info@desklib.com
Available 24*7 on WhatsApp / Email
![[object Object]](/_next/static/media/star-bottom.7253800d.svg)
Unlock your academic potential
Copyright © 2020–2026 A2Z Services. All Rights Reserved. Developed and managed by ZUCOL.