Project Management Financial Strategy: Good Motors Analysis - PMAN 650

Verified

Added on  2022/09/16

|9
|1261
|16
Homework Assignment
AI Summary
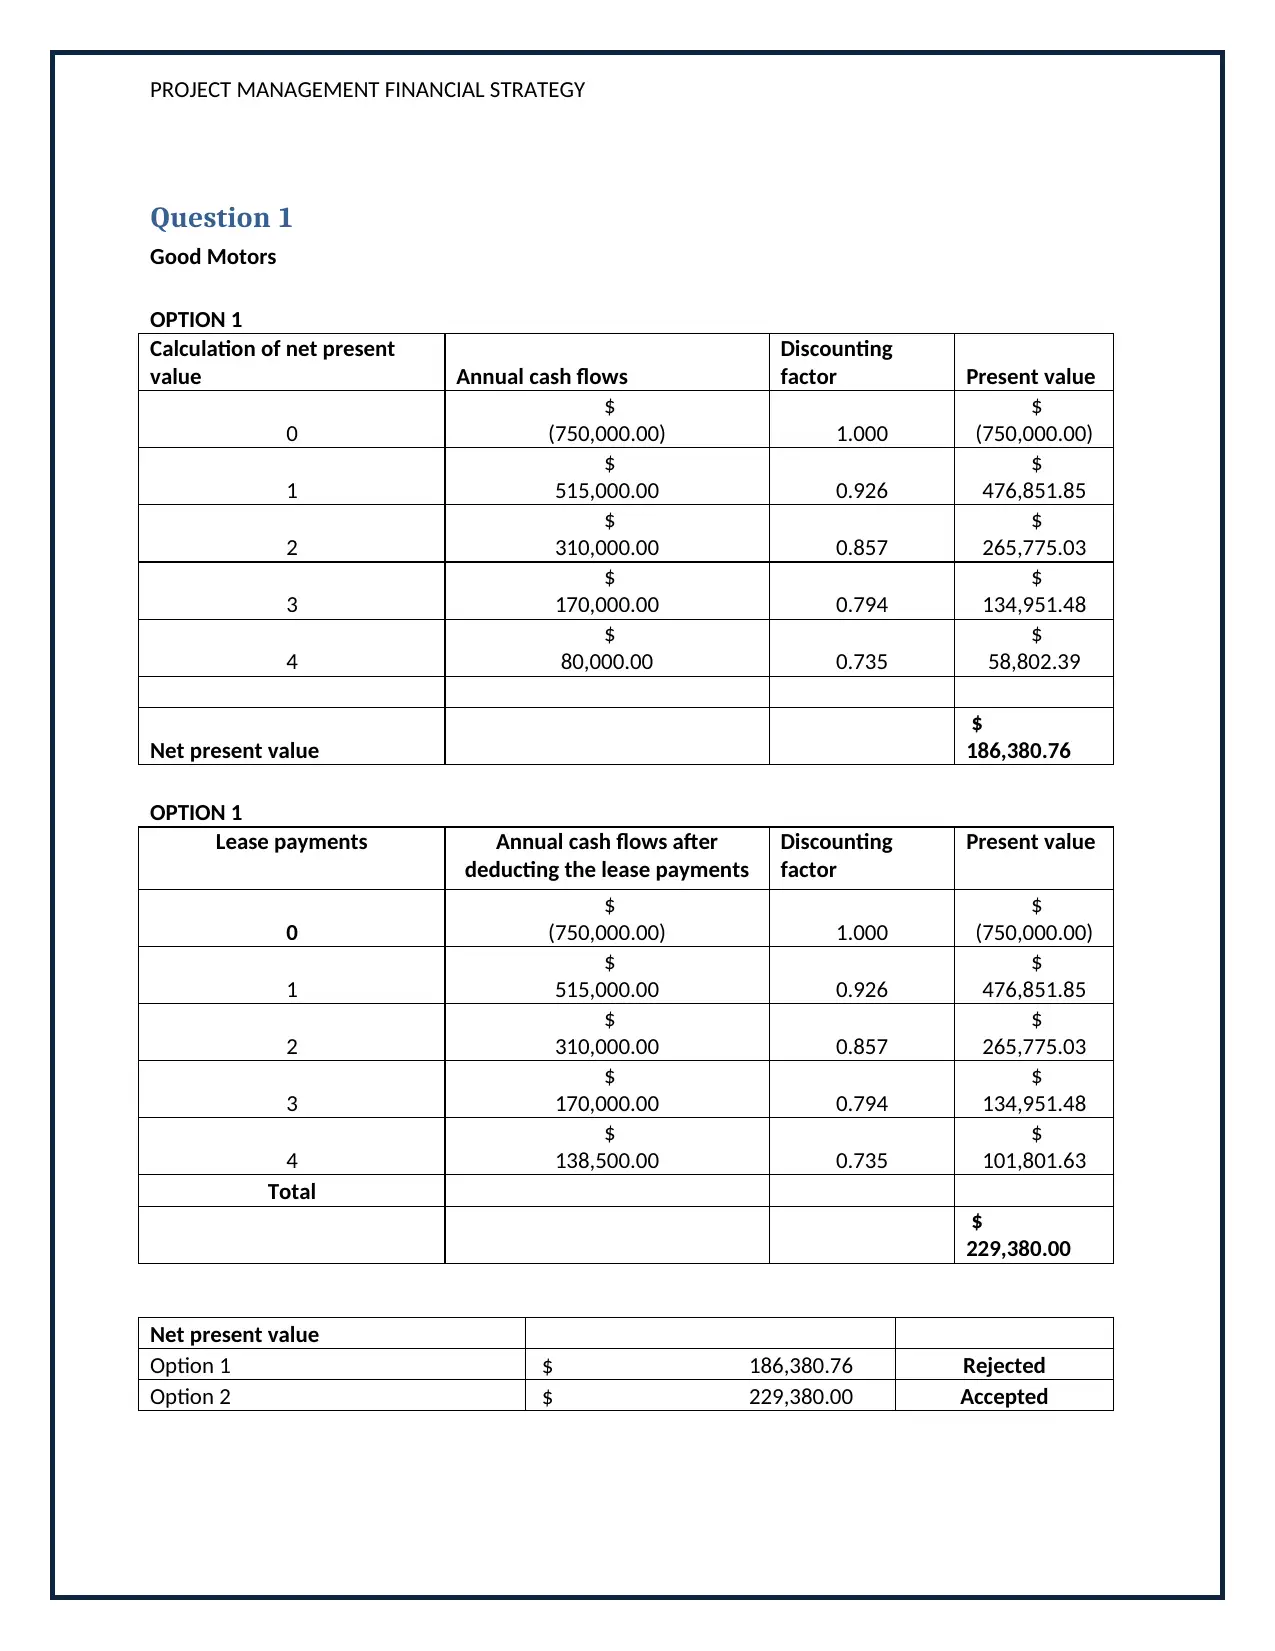
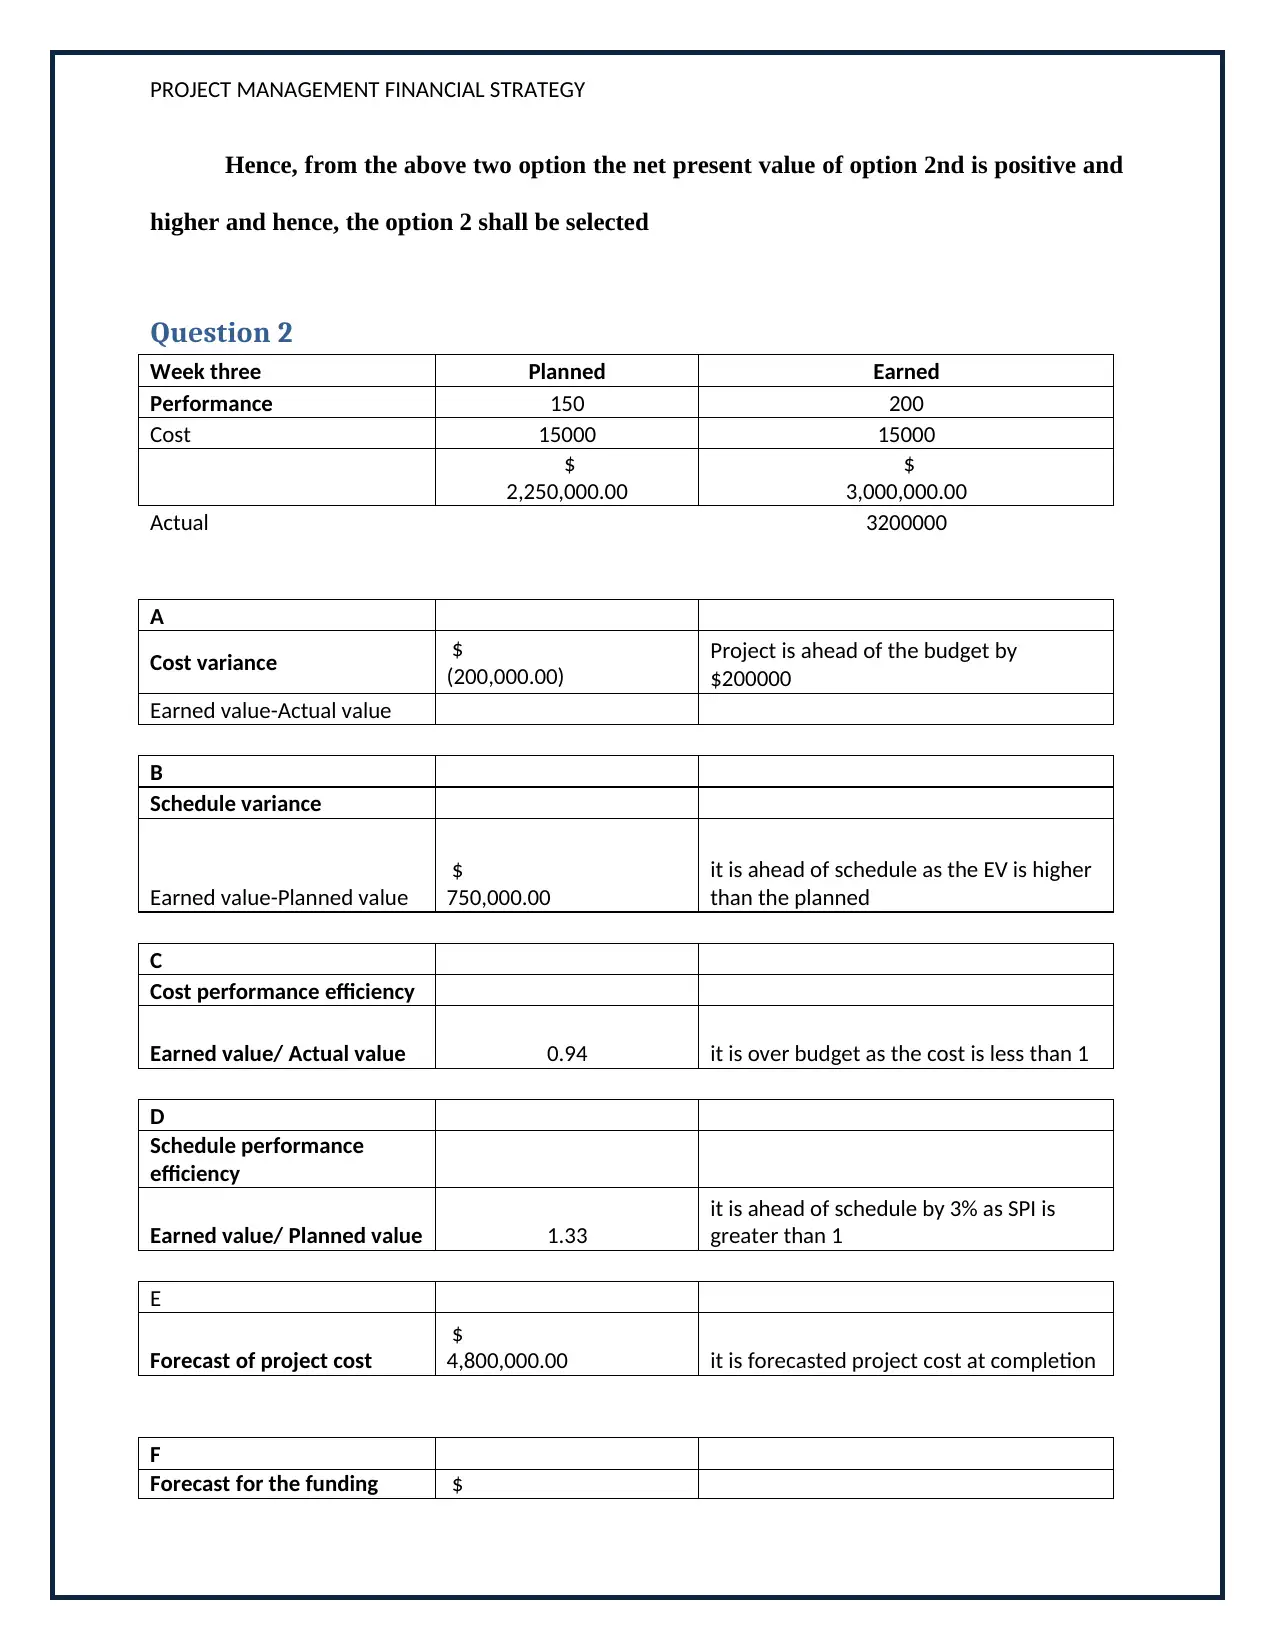
This assignment provides a comprehensive analysis of project management financial strategies for Good Motors. It begins with calculating the Net Present Value (NPV) of two options: purchasing and leasing equipment, determining the best financial decision. The assignment also includes a detailed analysis of Project Oxygen, evaluating cost and schedule variances using Earned Value Management (EVM) techniques, and forecasting project costs. Furthermore, the assignment delves into financial ratio analysis for Green Solar Inc., assessing liquidity, solvency, and profitability ratios to determine the company's financial health and performance compared to industry standards. The analysis covers ratios like current ratio, quick ratio, debt to total assets, return on assets, and price-to-earnings ratio, providing insights for investment decisions. The assignment concludes with a review of key project management concepts like scope, schedule, budget, and cost performance indices (CPI).
tabler-icon-diamond-filled.svg

Contribute Materials

Your contribution can guide someone’s learning journey. Share your documents today.
Document Page
Running head: PROJECT MANAGEMENT FINANCIAL STRATEGY
1
PROJECT MANAGEMENT FINANCIAL STRATEGY
tabler-icon-diamond-filled.svg

Secure Best Marks with AI Grader

Need help grading? Try our AI Grader for instant feedback on your assignments.
Document Page
PROJECT MANAGEMENT FINANCIAL STRATEGY
Table of Contents
Question 1........................................................................................................................................3
Question 2........................................................................................................................................3
Question 3........................................................................................................................................4
Analysis...........................................................................................................................................4
Question 4........................................................................................................................................4
Answer.........................................................................................................................................4
Question 5........................................................................................................................................4
Answer.........................................................................................................................................4
Question 6........................................................................................................................................4
Answer.........................................................................................................................................4
Question 7........................................................................................................................................5
Question 8........................................................................................................................................5
Document Page
PROJECT MANAGEMENT FINANCIAL STRATEGY
Question 1
Good Motors
OPTION 1
Calculation of net present
value Annual cash flows
Discounting
factor Present value
0
$
(750,000.00) 1.000
$
(750,000.00)
1
$
515,000.00 0.926
$
476,851.85
2
$
310,000.00 0.857
$
265,775.03
3
$
170,000.00 0.794
$
134,951.48
4
$
80,000.00 0.735
$
58,802.39
Net present value
$
186,380.76
OPTION 1
Lease payments Annual cash flows after
deducting the lease payments
Discounting
factor
Present value
0
$
(750,000.00) 1.000
$
(750,000.00)
1
$
515,000.00 0.926
$
476,851.85
2
$
310,000.00 0.857
$
265,775.03
3
$
170,000.00 0.794
$
134,951.48
4
$
138,500.00 0.735
$
101,801.63
Total
$
229,380.00
Net present value
Option 1 $ 186,380.76 Rejected
Option 2 $ 229,380.00 Accepted
Document Page
PROJECT MANAGEMENT FINANCIAL STRATEGY
Hence, from the above two option the net present value of option 2nd is positive and
higher and hence, the option 2 shall be selected
Question 2
Week three Planned Earned
Performance 150 200
Cost 15000 15000
$
2,250,000.00
$
3,000,000.00
Actual 3200000
A
Cost variance $
(200,000.00)
Project is ahead of the budget by
$200000
Earned value-Actual value
B
Schedule variance
Earned value-Planned value
$
750,000.00
it is ahead of schedule as the EV is higher
than the planned
C
Cost performance efficiency
Earned value/ Actual value 0.94 it is over budget as the cost is less than 1
D
Schedule performance
efficiency
Earned value/ Planned value 1.33
it is ahead of schedule by 3% as SPI is
greater than 1
E
Forecast of project cost
$
4,800,000.00 it is forecasted project cost at completion
F
Forecast for the funding $
tabler-icon-diamond-filled.svg

Secure Best Marks with AI Grader

Need help grading? Try our AI Grader for instant feedback on your assignments.
Document Page
PROJECT MANAGEMENT FINANCIAL STRATEGY
needed to 1,600,000.00
complete the project
G
In order to maintain the CPI we need to
target for over budget of 10%, this can be
done by increasing resources or doing
resource utilization.
Cost performance efficiency
Question 3
Green Solar Inc.
Liquidity Ratios 2016 2016 Industry
Current Ratio Current Assets 725 1.908 2.5
Current Liabilities 380 times Times
Quick Ratio Quick Assets 425 1.118 1 times
Current Liabilities 380 times
Solvency ratios 2016 2016
Debt to Total Assets Debt 1180 0.5 1
Total Assets 2125 Times Times
Profitability 2016 2016
Price to earnings ratio Market price 29.5 10.24 11.25
EPS 2.88 times Times
Return on assets Net income 112 5.27% 9%
Average total Assets 2125
Analysis
Ratio analysis is a technique that is used to measure the performance of any enterprise
and the same have been applied by Green Solar Inc. As per the table above it can be seen that the
management has calculated five ratios which have been apt to determine the financial health of
the company. These ratios are compared against the industry standards to find out whether the
company is performing below, average or beyond standards (Min, Min, Joo & Kim, 2019).
Document Page
PROJECT MANAGEMENT FINANCIAL STRATEGY
First the liquidity position of the company has been analyzed, which states that the
current ratio of the company is 1.90 times and the quick ratio is 1.11 times. Generally the
liquidity ratios define the ability of the company to pay back the current liabilities on time. As
per the table the industry is performing well at 2.5 times and the company must get rid of
obsolete assets and focus on paying the liabilities more.
The total debt to assets ratio is the ratio which determines how well the debt is used to
finance the assets. The company must take care of the fact that the total debt to asset ratio have
been 1 times for industry and 0.56 times for the company and this suggests that the company is
still behind and it is a positive result. Too much of leverage can burden company with too many
financial costs and hence, debt to total assets shall be lower (Feroz, Kim & Raab, 2013).
Profitability is the key determinant for any company, and profit of the company is an
important element as all the users are interested in the profitability of the business. As per the
current study, the profitability ratio is ascertained through return on assets and price earnings
ratio.
The return on assets is a ratio that defines how much income has been generated with the
help of the total assets. The above table describes that return on assets is 5.27 times and that of
the industry is 9. This implies that the net return on asset is lower than the industry average and
this also means that the company needs to increase the efficiency by increasing the sales volume
and the must use the assets efficiently (Linares-Mustarós, Coenders & Vives-Mestres, 2018).
The price earnings ratio is a combination of share price and the earnings per share. The
share price prevailing in the market currently is $29.50 and the EPS that is received by the
shareholder is $2.88 per share. Overall P/E ratio of the industry is 11.5 times, whereas that of the
Document Page
PROJECT MANAGEMENT FINANCIAL STRATEGY
company is 10.24 times. This states that the company is not too far in achieving the target and
hence the company must focus on paying dividends, as this would increase the value of the price.
From the overall analysis it can be stated that the financial performance of the company
is smooth but needs to be improved a bit in case of liquidity and for that the company needs to
focus on funding the long term borrowings, and avoid short term liabilities. Hence it can be said
that from the point of view of an investor, the investment can be made (Patil & Mohanthy, 2017).
Question 4
Answer
A Precise Scope of work, a Schedule, a Budget, and a CAP Manager
Question 5
Answer
Allows the project to equate the defined scope with authorized resources, both
within the master schedule
Question 6
Answer
Actual Cost, Earned Value, and Planned Value
Question 7
Earned value $ 350,000.00
Planned value $ 750,000.00
Answer 0.47
Question 8
Budget at completion (BAC) $ 12,500,000.00
Cumulative cost performance index (CPI) 0.47
tabler-icon-diamond-filled.svg

Paraphrase This Document

Need a fresh take? Get an instant paraphrase of this document with our AI Paraphraser
Document Page
PROJECT MANAGEMENT FINANCIAL STRATEGY
EAC $ 26,785,714.29
Document Page
PROJECT MANAGEMENT FINANCIAL STRATEGY
References
Feroz, E. H., Kim, S., & Raab, R. L. (2013). Financial statement analysis: A data envelopment
analysis approach. Journal of the operational Research Society, 54(1), 48-58.
Linares-Mustarós, S., Coenders, G., & Vives-Mestres, M. (2018). Financial performance and
distress profiles. From classification according to financial ratios to compositional
classification. Advances in Accounting, 40, 1-10.
Min, H., Min, H., Joo, S. J., & Kim, J. (2019). Evaluating the financial performances of Korean
luxury hotels using data envelopment analysis. The Service Industries Journal, 29(6),
835-845.
Patil, D., & Mohanthy, J. N. (2017). Analysis of Financial Statements in the Sugar
Industry. Available at SSRN 2962855.
chevron_up_icon
1 out of 9
circle_padding
hide_on_mobile
zoom_out_icon
logo.png

Your All-in-One AI-Powered Toolkit for Academic Success.

Available 24*7 on WhatsApp / Email

[object Object]