Economics and Quantitative Analysis: Linear Regression on Retention

Verified

Added on  2023/04/20

|8
|1518
|244
Report
AI Summary
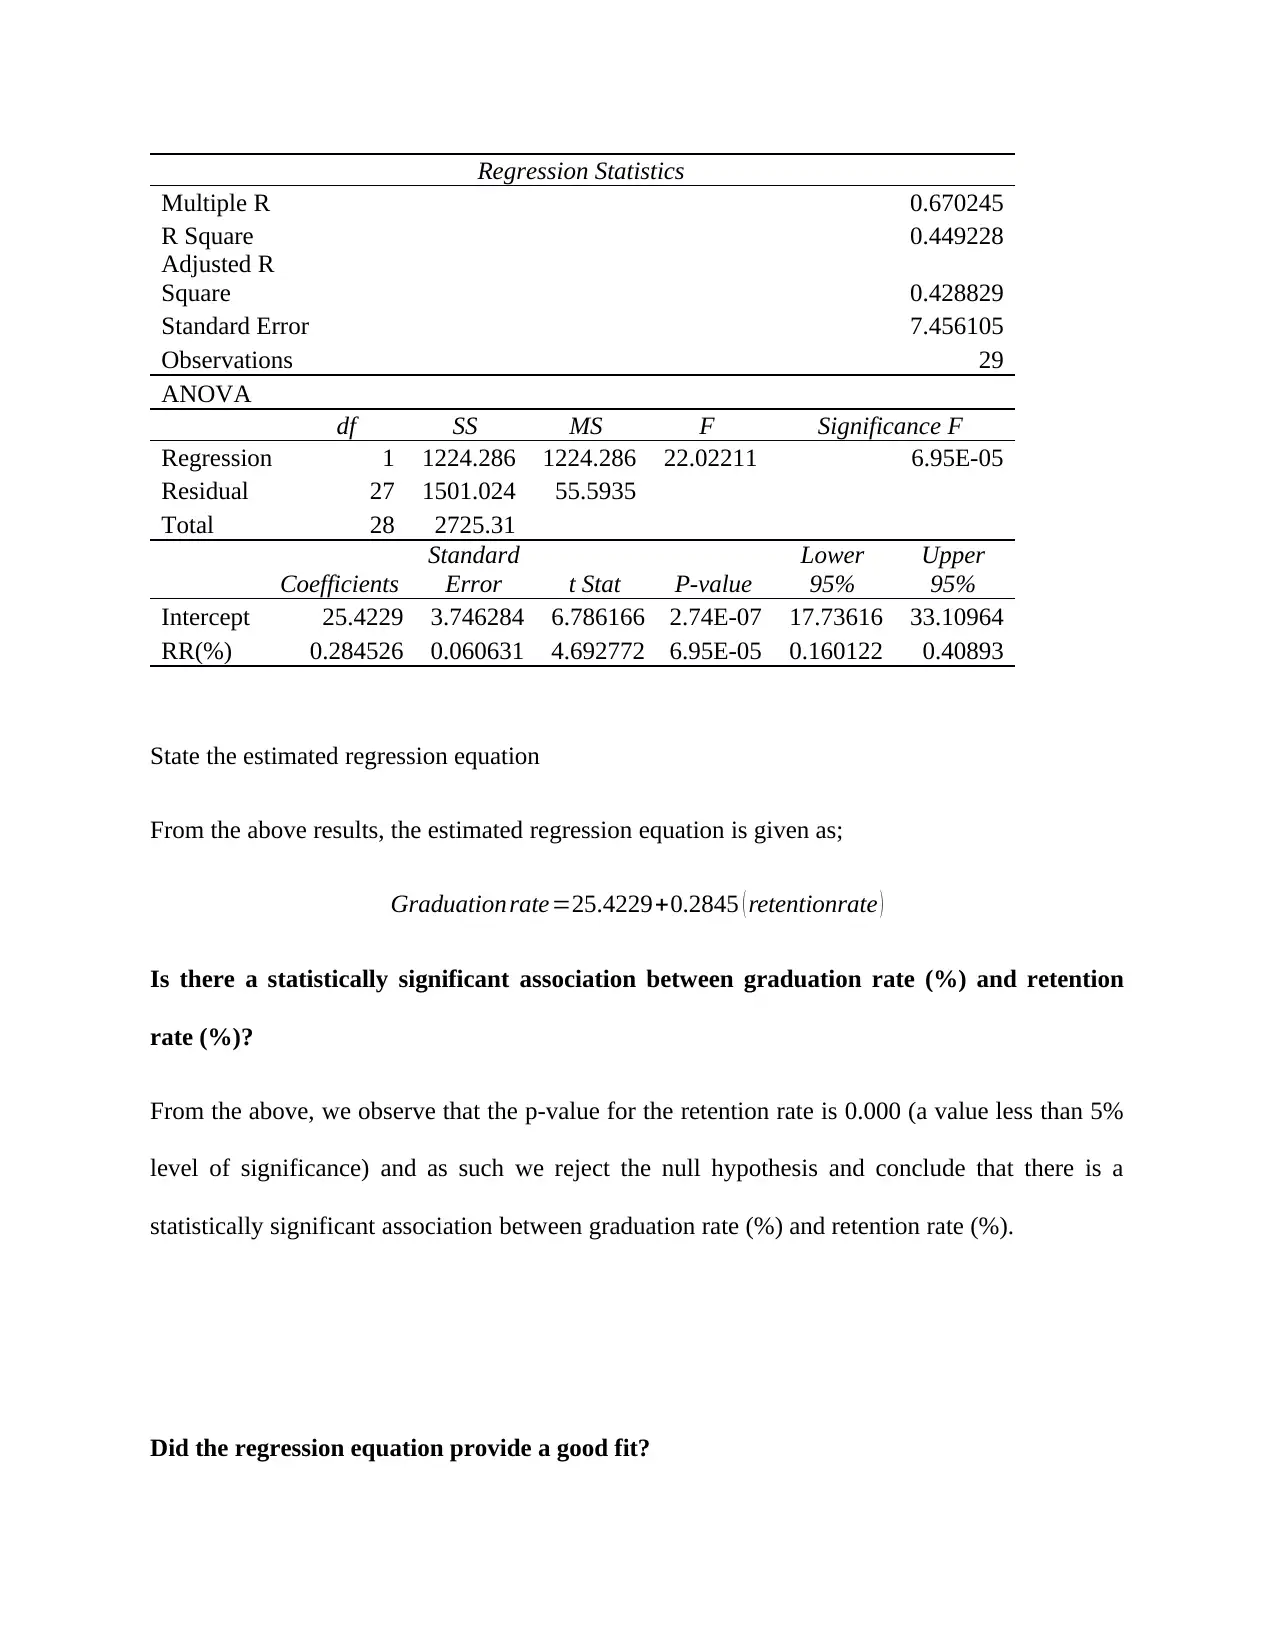
This report conducts a simple linear regression analysis to examine the association between the retention rate (independent variable) and the graduation rate (dependent variable) using data from 29 online colleges in the United States. The study investigates the relationship between these rates, highlighting their importance to economists due to their impact on income, employment, and the intergenerational transfer of educational attainment. Descriptive statistics, scatter plots, and regression analysis are employed to test the hypothesis that a significant relationship exists. The findings indicate a statistically significant positive association between retention and graduation rates, leading to the rejection of the null hypothesis. The estimated regression equation is presented, and the fit of the model is evaluated using ANOVA. The report concludes with a discussion of the results, policy implications, and recommendations for universities to focus on improving retention and graduation rates through strategic planning and resource allocation. It also suggests future research should use larger sample sizes for more generalizable conclusions. The analysis also considers the specific performance of South University and the University of Phoenix relative to the average, revealing concerns about their below-average rates.
Document Page
Economics and quantitative analysis
Name:
Institution:
9th February 2019
tabler-icon-diamond-filled.svg

Paraphrase This Document

Need a fresh take? Get an instant paraphrase of this document with our AI Paraphraser
Document Page
Purpose
The purpose of this study is to Conduct a simple linear regression analysis to examine the
association between the ‘retention rate’ (the independent variable) and the ‘graduation rate’ (the
dependent variable). We utilize data from the Online Education Database which is an
independent organization whose mission is to build a comprehensive list of accredited online
colleges.
Background
Different analysts have associated educational accomplishment and achievements with student'
persistence in campus, and these two components clarified effects from most other understudy
foundation properties. The association between retention and graduation should be a major
concern to the economists because it serves as an advantage to the growth of economy in three
key ways. First is because of the well-known structure of salary and employment that is
associated with various education levels. The second reason is the less well known but very
crucial relationship that exists between parents’ educational status and the chances that their
children will graduate. Lastly is the huge scholarly increase experienced by college graduates
eventually end up contributing to the economic and civic growth of our country (Penrose, 2012).
All these factors are very crucial to the growth of any economy hence it is a major concern for
the economists to be interested in the issue of retention and graduation (Ting, 2010).
Method
A sample of 30 universities was collected to investigate whether there is association between
retention rate and graduation rate. The hypothesis that this study sought to test is;
H0: There is no significant relationship between retention rate and graduation rate
Document Page
HA: There is significant relationship between retention rate and graduation rate
To test the above hypothesis, the study performed both Pearson Correlation test and regression
analysis test in order to identify the relationship that exists if any.
For the regression analysis, the study sought to fit a regression model that would attempt to
predict the graduation rate based on the retention rate. The model that we sought to fit is;
Y = β0 + β1 ( X ) +ε
Where
Y =Graduationrate , X=Retentionrate , β0=Intercept ( constant ) coefficent , β1=Coefficientforretentionrate ε=e
Results
Descriptive analysis
Table 1 below gives the descriptive statistics for the two variables. As can be seen, the average
retention rate for the sampled universities was found to be 57.41% with an average graduation
rate of 41.76%. The median retention rate was 60% with the most frequent retention rate (mode)
reported across the 30 universities being 51%. The skewness values for both the retention rate
and the graduation rate shows that the two variables are close to being normally distributed since
the skewness values were either less than 0.5 or greater than -0.5 and closer to zero.
Table 1: Descriptive (summary) statistics
RR(%) GR(%)
Mean 57.41 41.76
Standard Error 4.32 1.83
Median 60.00 39.00
Mode 51.00 36.00
Standard Deviation 23.24 9.87
Sample Variance 540.11 97.33
Kurtosis 0.46 -0.88
Document Page
Skewness -0.31 0.18
Range 96.00 36.00
Minimum 4.00 25.00
Maximum 100.00 61.00
Sum 1665 1211
Count 29 29
Scatter diagram
In this section we present a scatter plot to try and visualize the relationship between graduation
rate and retention rate.
As can be seen from the plot, there is a positive linear relationship between the two variables
(graduation rate and retention rate).
Estimate of the regression equation
To estimate the regression equation that can be used to predict the graduation rate (%) given the
retention rate (%) a regression analysis was done (Armstrong, 2012). The results are given below;
SUMMARY OUTPUT
tabler-icon-diamond-filled.svg

Paraphrase This Document

Need a fresh take? Get an instant paraphrase of this document with our AI Paraphraser
Document Page
Regression Statistics
Multiple R 0.670245
R Square 0.449228
Adjusted R
Square 0.428829
Standard Error 7.456105
Observations 29
ANOVA
df SS MS F Significance F
Regression 1 1224.286 1224.286 22.02211 6.95E-05
Residual 27 1501.024 55.5935
Total 28 2725.31
Coefficients
Standard
Error t Stat P-value
Lower
95%
Upper
95%
Intercept 25.4229 3.746284 6.786166 2.74E-07 17.73616 33.10964
RR(%) 0.284526 0.060631 4.692772 6.95E-05 0.160122 0.40893
State the estimated regression equation
From the above results, the estimated regression equation is given as;
Graduationrate=25.4229+0.2845 ( retentionrate )
Is there a statistically significant association between graduation rate (%) and retention
rate (%)?
From the above, we observe that the p-value for the retention rate is 0.000 (a value less than 5%
level of significance) and as such we reject the null hypothesis and conclude that there is a
statistically significant association between graduation rate (%) and retention rate (%).
Did the regression equation provide a good fit?
Document Page
Yes from the ANOVA table we can conclude that the regression equation provided a good fit.
This is based on the fact that p-value for the F-Statistics is 0.000 (a value less than 5% level of
significance) leading to rejection of the null hypothesis for model being equal to zero.
Suppose you were the president of South University. After reviewing the results, would you
have any concerns about the performance of your university compared to other online
universities?
Yes I would be concerned about the performance of my university. According to records, South
University had a retention rate of 51% and a graduation rate of 25%. These figures are below the
average for all the 29 universities considered in this study hence this would an issue of concern
to me as the president of the university.
Suppose you were the president of the University of Phoenix. After reviewing the results,
would you have any concerns about the performance of your university compared to other
online universities?
Yes I would be concerned about the performance of my university. According to records,
University of Phoenix had a retention rate of mere 4% and a graduation rate of 28%. These
figures are way below the average for all the 29 universities considered in this study hence this
would be a great issue to worry about.
Discussion
The aim of this study was to investigate the relationship that exists between retention rate and the
graduation rate. The results shows that there is significant relationship that exists between the
retention rate and the graduation rate for the online universities. The key strengths of this
analysis lies on the fact that the data was randomly collected hence avoiding selection bias. The
Document Page
key weaknesses of this study include a small sample size. This study only utilized a small sample
to draw its analysis and conclusions which might result to bias.
The study is however, in agreement with previous studies that have shown that a positive
relationship exists between retention rate and graduation rates (Hoyt & Winn, 2009). The findings
of the study have clear policy implications since it shows that much focus should be put on
retention as it affects the graduation rate.
Recommendations
Based on the above findings, it is clear that most of universities are still very far from reaching
the 100% retention or graduation rate. The following recommendations therefore should be put
in use:
There is need for the universities to bring statistically sound and empirically-based
approaches in the strategic planning process for the student retention and graduation.
There is need for institutions to start putting more energy on retention and graduation
rates. The current problem comes as a result of many universities focusing more on
admitting more students and not putting extra efforts when it comes to the retention and
graduation rates.
There is need for future research to use a larger sample size to draw conclusions that can
be generalized across regions and countries.
tabler-icon-diamond-filled.svg

Paraphrase This Document

Need a fresh take? Get an instant paraphrase of this document with our AI Paraphraser
Document Page
References
Armstrong, J. S., 2012. Illusions in Regression Analysis. International Journal of Forecasting ,
28(3), p. 689.
Hoyt, J. E. & Winn, B. A., 2009. Understanding retention and college student bodies:
Differences between drop-outs, stop-outs, opt-outs, and transfer-outs. NASPA Journal, 41(3), pp.
111-125.
Penrose, A., 2012. Academic literacy perceptions and performance: Comparing firstgeneration
and continuing-generation college students. Research in the Teaching of English, 36(4), pp. 437-
461.
Ting, S., 2010. Predicting Asian Americans’ academic performance in the first year of college:
An approach combining SAT scores and non-cognitive variables. Journal of College Student
Development, 41(5), pp. 442-449.
chevron_up_icon
1 out of 8
circle_padding
hide_on_mobile
zoom_out_icon
[object Object]