The Relationship Between Wages and Years of Education: A Report

Verified

Added on  2020/05/16

|9
|1692
|139
Report
AI Summary
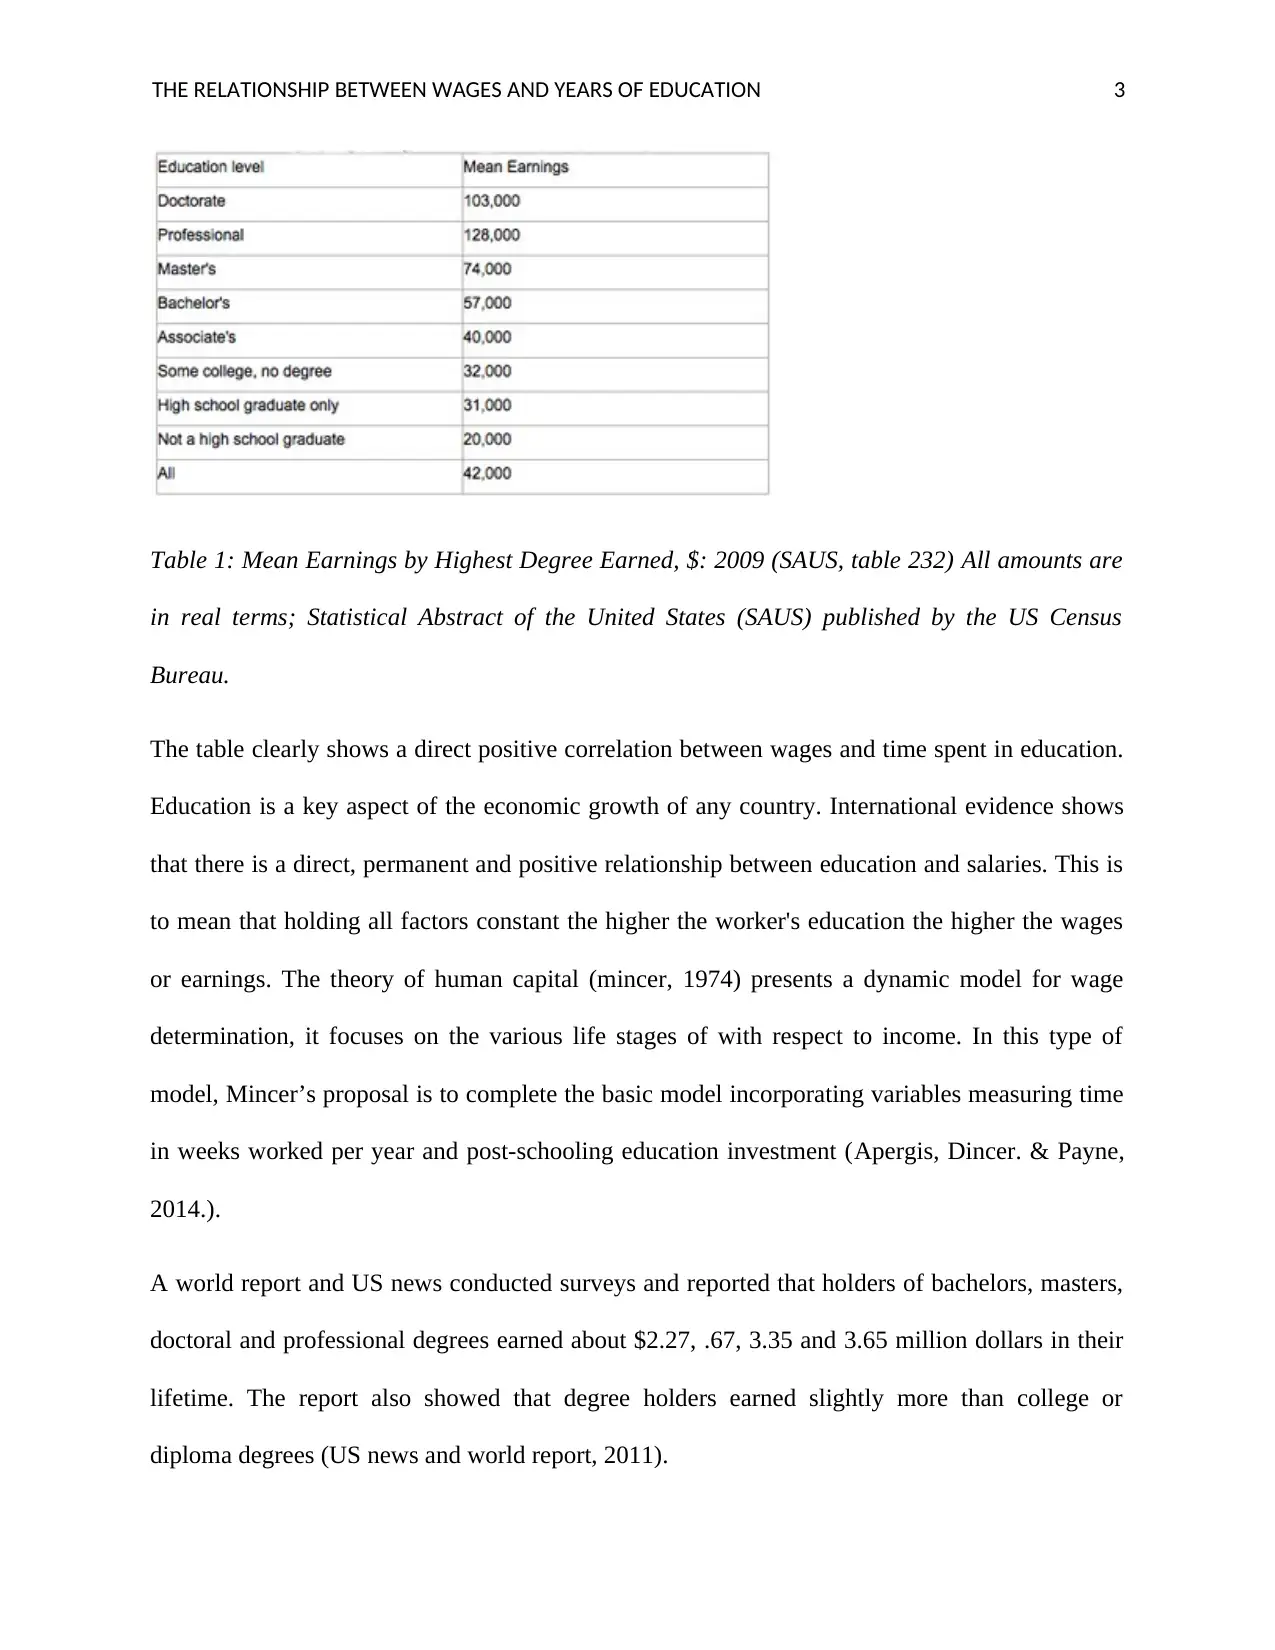
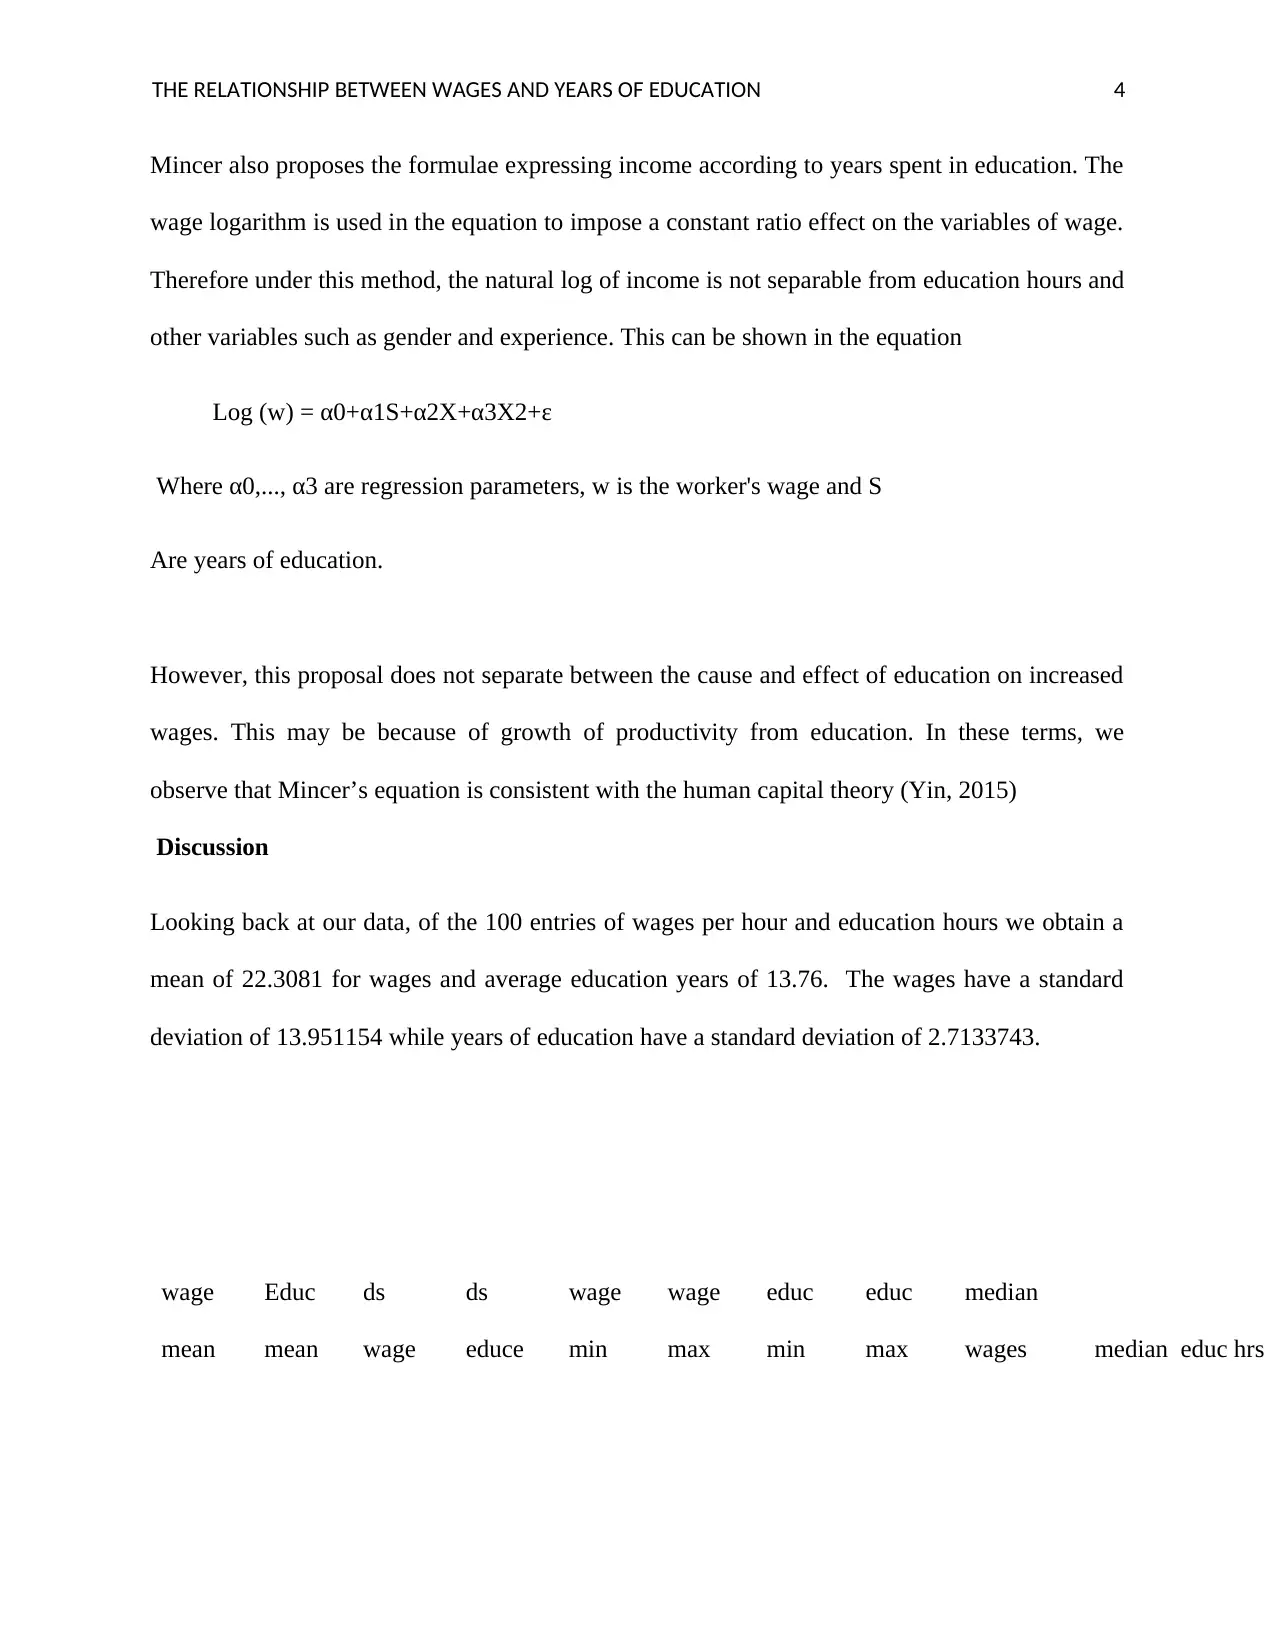
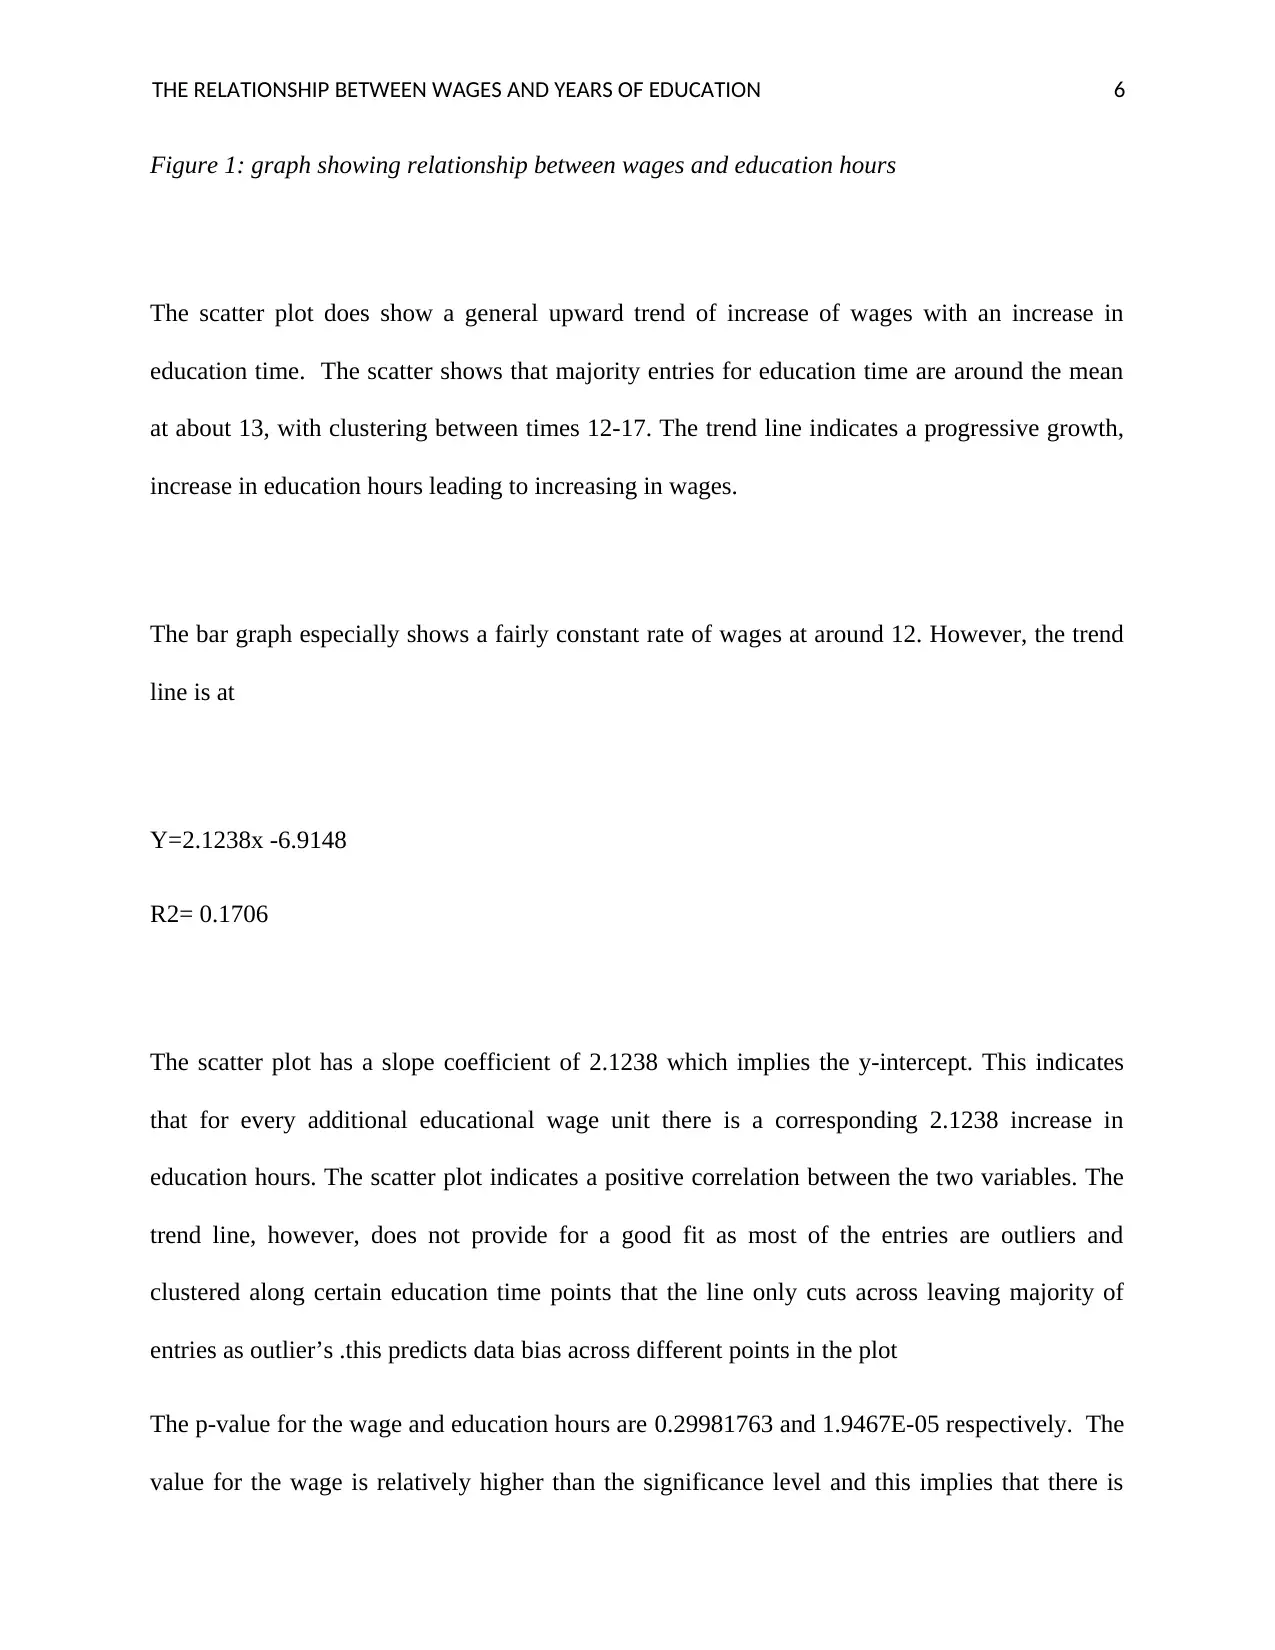
This report examines the correlation between wages and years of education. It begins with an introduction discussing the varying beliefs on the influence of education on income, aiming to clarify the relationship through data analysis. The background section highlights the rising value of education, particularly in developed countries, and its association with higher skill levels and cognitive abilities. The report references human capital theory and Mincer's model, which presents a dynamic model for wage determination, incorporating variables like time spent in education. Data analysis is performed on a dataset of 100 entries, showing a positive correlation between wages and education hours, visualized through a scatter plot and trend line. The analysis reveals a positive correlation between wages and education, although the trend line does not provide a good fit, suggesting data bias. The report concludes that the methodology is efficient and simple for any researcher to analyze the relationship between wages and education. The study suggests collecting data in different fields separately for more precision.
Document Page
Running Head: THE RELATIONSHIP BETWEEN WAGES AND YEARS OF EDUCATION 1
The Relationship Between wages and Years of Education
Name
Professor
Institution
Subject
Date
tabler-icon-diamond-filled.svg

Secure Best Marks with AI Grader

Need help grading? Try our AI Grader for instant feedback on your assignments.
Document Page
THE RELATIONSHIP BETWEEN WAGES AND YEARS OF EDUCATION 2
REPORT TO SHOW THE RELATIONSHIP BETWEEN WAGES AND YEARS OF
EDUCATION
Introduction
There have been several contradicting beliefs on how the level of education influences the
incomes of individuals. there have been varied opinions on the subject with those insinuating a
measurable relationship between the two variables of level of education and wages while others
suggesting that there is no direct correlation between the two (whether positive or negative )
( Easterbrook, Kuppens, & Manstead, 2016). We, therefore, aim to clarify this aspect through
data analysis to explicitly verify if there is a correlation or not and if there is then what form is it.
Background
In recent decades especially in advanced countries, the value of education has risen effectively
putting a higher wage premium on education. this because higher education is often associated
with a higher understanding and mastery of the subject as well as higher skill level and cognitive
abilities (Goldin & Katz, 2009). Education is a right that enables people to develop themselves,
improve productivity and therefore living conditions as well (Martí Linares, 2015). Since the
development of human capital theory, the study of effects of education in the field of economics
has been of great interest .the level of education influences the type of jobs and therefore wages
(Machlup, 2014).). For instance, in certain fields, the amount of specialized education directly
translates to higher earnings eg. The health sector where specialists almost earn double what the
general practitioners earn. (Philippon, & Reshef, 2012)
Document Page
THE RELATIONSHIP BETWEEN WAGES AND YEARS OF EDUCATION 3
Table 1: Mean Earnings by Highest Degree Earned, $: 2009 (SAUS, table 232) All amounts are
in real terms; Statistical Abstract of the United States (SAUS) published by the US Census
Bureau.
The table clearly shows a direct positive correlation between wages and time spent in education.
Education is a key aspect of the economic growth of any country. International evidence shows
that there is a direct, permanent and positive relationship between education and salaries. This is
to mean that holding all factors constant the higher the worker's education the higher the wages
or earnings. The theory of human capital (mincer, 1974) presents a dynamic model for wage
determination, it focuses on the various life stages of with respect to income. In this type of
model, Mincer’s proposal is to complete the basic model incorporating variables measuring time
in weeks worked per year and post-schooling education investment (Apergis, Dincer. & Payne,
2014.).
A world report and US news conducted surveys and reported that holders of bachelors, masters,
doctoral and professional degrees earned about $2.27, .67, 3.35 and 3.65 million dollars in their
lifetime. The report also showed that degree holders earned slightly more than college or
diploma degrees (US news and world report, 2011).
Document Page
THE RELATIONSHIP BETWEEN WAGES AND YEARS OF EDUCATION 4
Mincer also proposes the formulae expressing income according to years spent in education. The
wage logarithm is used in the equation to impose a constant ratio effect on the variables of wage.
Therefore under this method, the natural log of income is not separable from education hours and
other variables such as gender and experience. This can be shown in the equation
Log (w) = α0+α1S+α2X+α3X2+ε
Where α0,..., α3 are regression parameters, w is the worker's wage and S
Are years of education.
However, this proposal does not separate between the cause and effect of education on increased
wages. This may be because of growth of productivity from education. In these terms, we
observe that Mincer’s equation is consistent with the human capital theory (Yin, 2015)
Discussion
Looking back at our data, of the 100 entries of wages per hour and education hours we obtain a
mean of 22.3081 for wages and average education years of 13.76. The wages have a standard
deviation of 13.951154 while years of education have a standard deviation of 2.7133743.
wage
mean
Educ
mean
ds
wage
ds
educe
wage
min
wage
max
educ
min
educ
max
median
wages median educ hrs
tabler-icon-diamond-filled.svg

Secure Best Marks with AI Grader

Need help grading? Try our AI Grader for instant feedback on your assignments.
Document Page
THE RELATIONSHIP BETWEEN WAGES AND YEARS OF EDUCATION 5
22.308
1
13.76
13.951
2
2.7133
7
4.33 76.39 6 21
19.39 13
The wage standard deviation is very high (13.951154) about the same value as the mean, this
shows high variance/dispersion in the wage entries among different levels of education hours.
This is further enhanced by the huge margin between the minimum wage value (4.33) and the
max (76.39) bringing a very high range of 72.06. The standard deviation for the education hours
is relatively lower at 2.71 while the min and max are 6 and 21 respectively. This show a minimal
variance but still a high range of 15.
4 6 8 10 12 14 16 18 20 22
0
10
20
30
40
50
60
70
80
90
f(x) = 2.1237563837879 x − 6.91478784092146
R² = 0.170611590067958
wage
education time
wagesi
Document Page
THE RELATIONSHIP BETWEEN WAGES AND YEARS OF EDUCATION 6
Figure 1: graph showing relationship between wages and education hours
The scatter plot does show a general upward trend of increase of wages with an increase in
education time. The scatter shows that majority entries for education time are around the mean
at about 13, with clustering between times 12-17. The trend line indicates a progressive growth,
increase in education hours leading to increasing in wages.
The bar graph especially shows a fairly constant rate of wages at around 12. However, the trend
line is at
Y=2.1238x -6.9148
R2= 0.1706
The scatter plot has a slope coefficient of 2.1238 which implies the y-intercept. This indicates
that for every additional educational wage unit there is a corresponding 2.1238 increase in
education hours. The scatter plot indicates a positive correlation between the two variables. The
trend line, however, does not provide for a good fit as most of the entries are outliers and
clustered along certain education time points that the line only cuts across leaving majority of
entries as outlier’s .this predicts data bias across different points in the plot
The p-value for the wage and education hours are 0.29981763 and 1.9467E-05 respectively. The
value for the wage is relatively higher than the significance level and this implies that there is
Document Page
THE RELATIONSHIP BETWEEN WAGES AND YEARS OF EDUCATION 7
insufficient evidence to assume a non-zero correlation. The p-value of education time I however
significantly low indicating the data is statistically significant.
For a person with 12 years of education, the wage would be
Y=2.1238x -6.9148
Y (12) =2.1238(12)-6.9148= 18.5708
For a person with 14 years of education, predicted wages would be
Y (14) =2.1238(14) -6.9148=22.8184
The difference in hourly rate is 22.8184-18.5708=4.2476
Conclusion
This method of data analysis is a simple and straight-forward with minimal chance of error, the
method allows for analysis of one data set while the ANOVA allows comparison of different
data sets but with homogeneity. The data analysis presentations are in line with previous studies.
Our data show a correlation coefficient of R2 = 0.1706 .this denoted a positive correlation
though to a small extent. It denotes a small variability of the data from the mean, a variation of
17% .however this results vary in different disciplines and professions. For more precision, the
data should be collected in the different fields separately and analyzed separately to see a clearer
picture of this scenario. The methodology, however, is efficient and simple for any researcher.
tabler-icon-diamond-filled.svg

Paraphrase This Document

Need a fresh take? Get an instant paraphrase of this document with our AI Paraphraser
Document Page
THE RELATIONSHIP BETWEEN WAGES AND YEARS OF EDUCATION 8
References
Goldin, C. D., & Katz, L. F. (2009). The future of inequality: The other reason education matters
so much.
Martí Linares, R. M. (2015). An empirical examination of the relationship between wages and
education.
Mincer, J. (1974). Schooling, Experience, and Earnings. Human Behavior & Social Institutions
No. 2.
Schultz, T. W. (1960). Capital formation by education. Journal of political economy, 68(6), 571-
583.
Philippon, T., & Reshef, A. (2012). Wages and human capital in the US finance industry: 1909–
2006. The Quarterly Journal of Economics, 127(4), 1551-1609.
Yin, R. K. (2015). Qualitative research from start to finish. Guilford Publications
Machlup, F. (2014). Knowledge: Its creation, distribution and economic significance, Volume
III: The economics of information and human capital (Vol. 3). Princeton University Press.
Apergis, N., Dincer, O., & Payne, J. E. (2014). Economic freedom and income inequality
revisited: Evidence from a panel error correction model. Contemporary Economic Policy, 32(1),
67-75.
Document Page
THE RELATIONSHIP BETWEEN WAGES AND YEARS OF EDUCATION 9
Easterbrook, M. J., Kuppens, T., & Manstead, A. S. (2016). The education effect: Higher
educational qualifications are robustly associated with beneficial personal and socio-political
outcomes. Social Indicators Research, 126(3), 1261-1298.
Lee, J. W., & Wie, D. (2015). Technological change, skill demand, and wage inequality:
Evidence from Indonesia. World Development, 67, 238-250.
Kampelmann, S., Rycx, F., Saks, Y., & Tojerow, I. (2018). Does education raise productivity
and wages equally? The moderating role of age and gender. IZA Journal of Labor Economics,
7(1), 1.
chevron_up_icon
1 out of 9
circle_padding
hide_on_mobile
zoom_out_icon
[object Object]