Business Decision Making Report: Restaurant Expansion Strategy

Verified

Added on  2019/12/28

|24
|4223
|280
Report
AI Summary
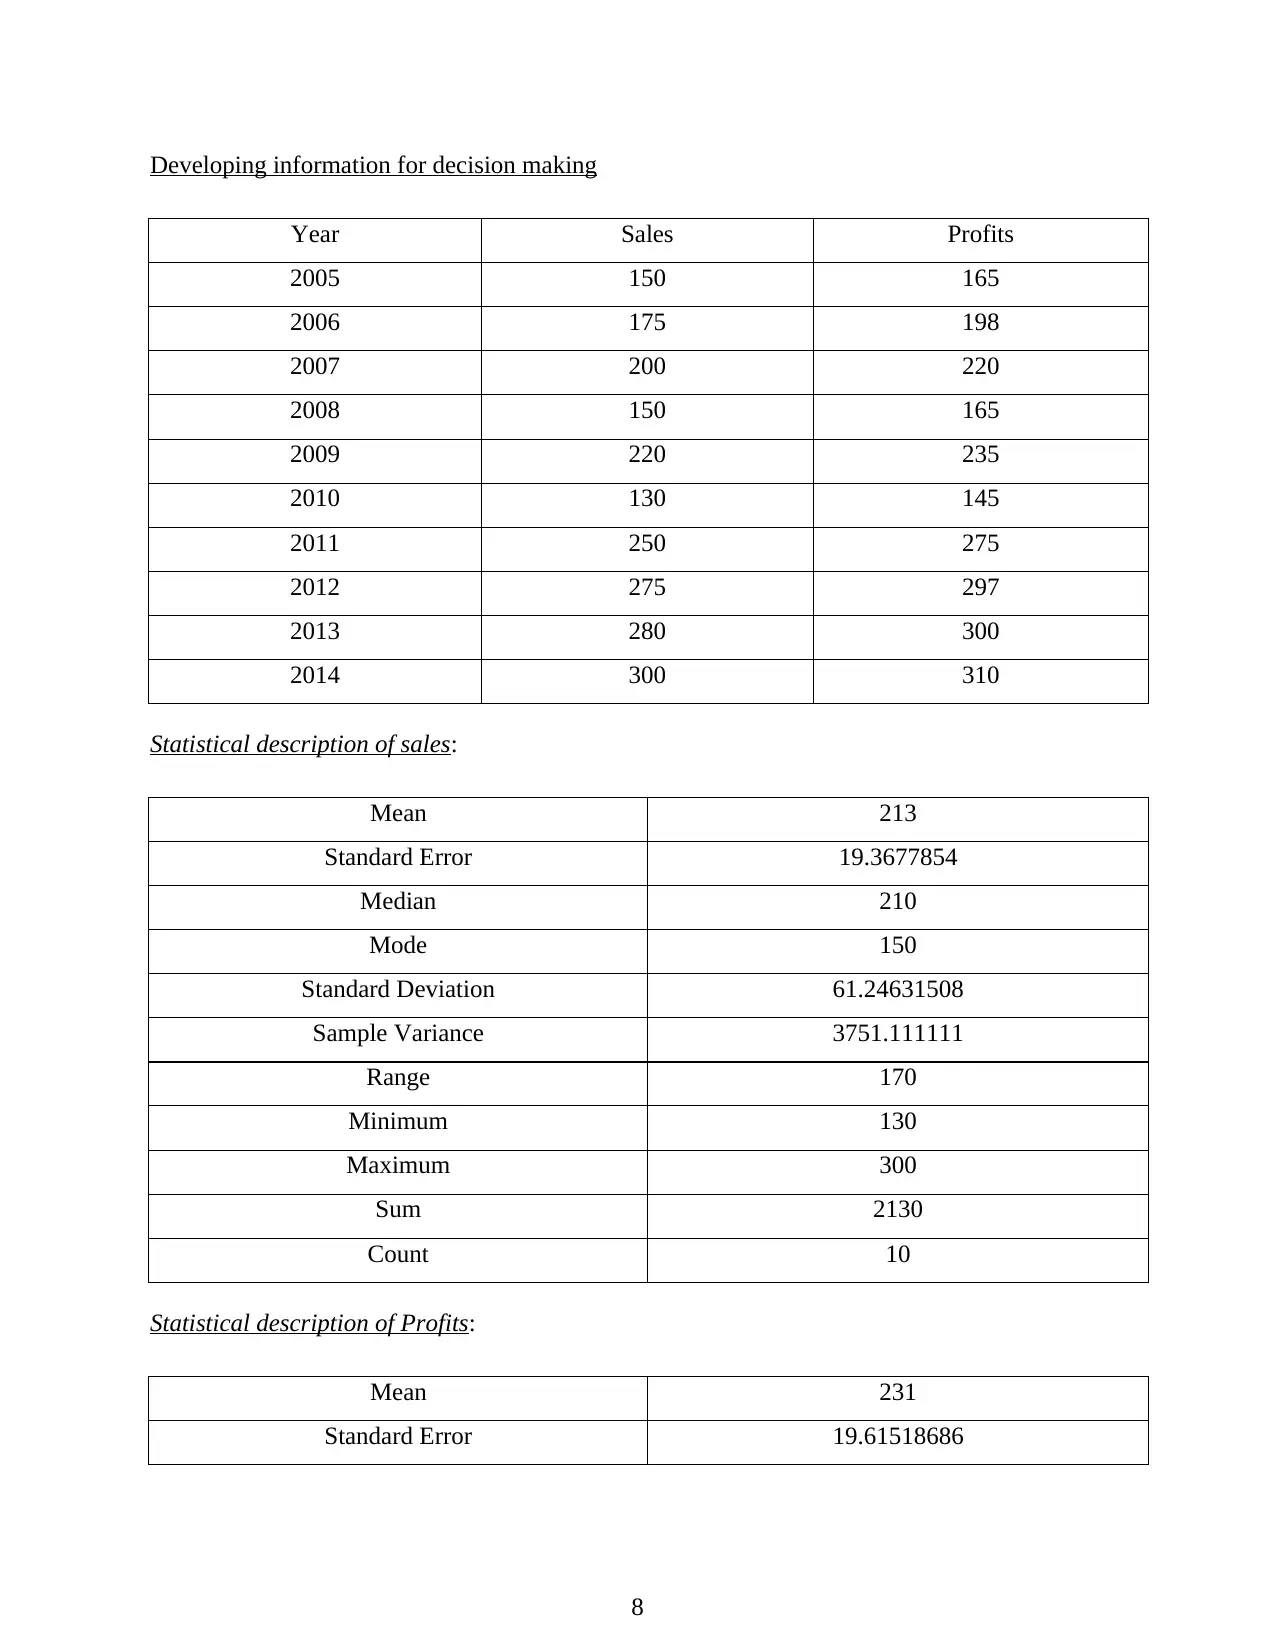
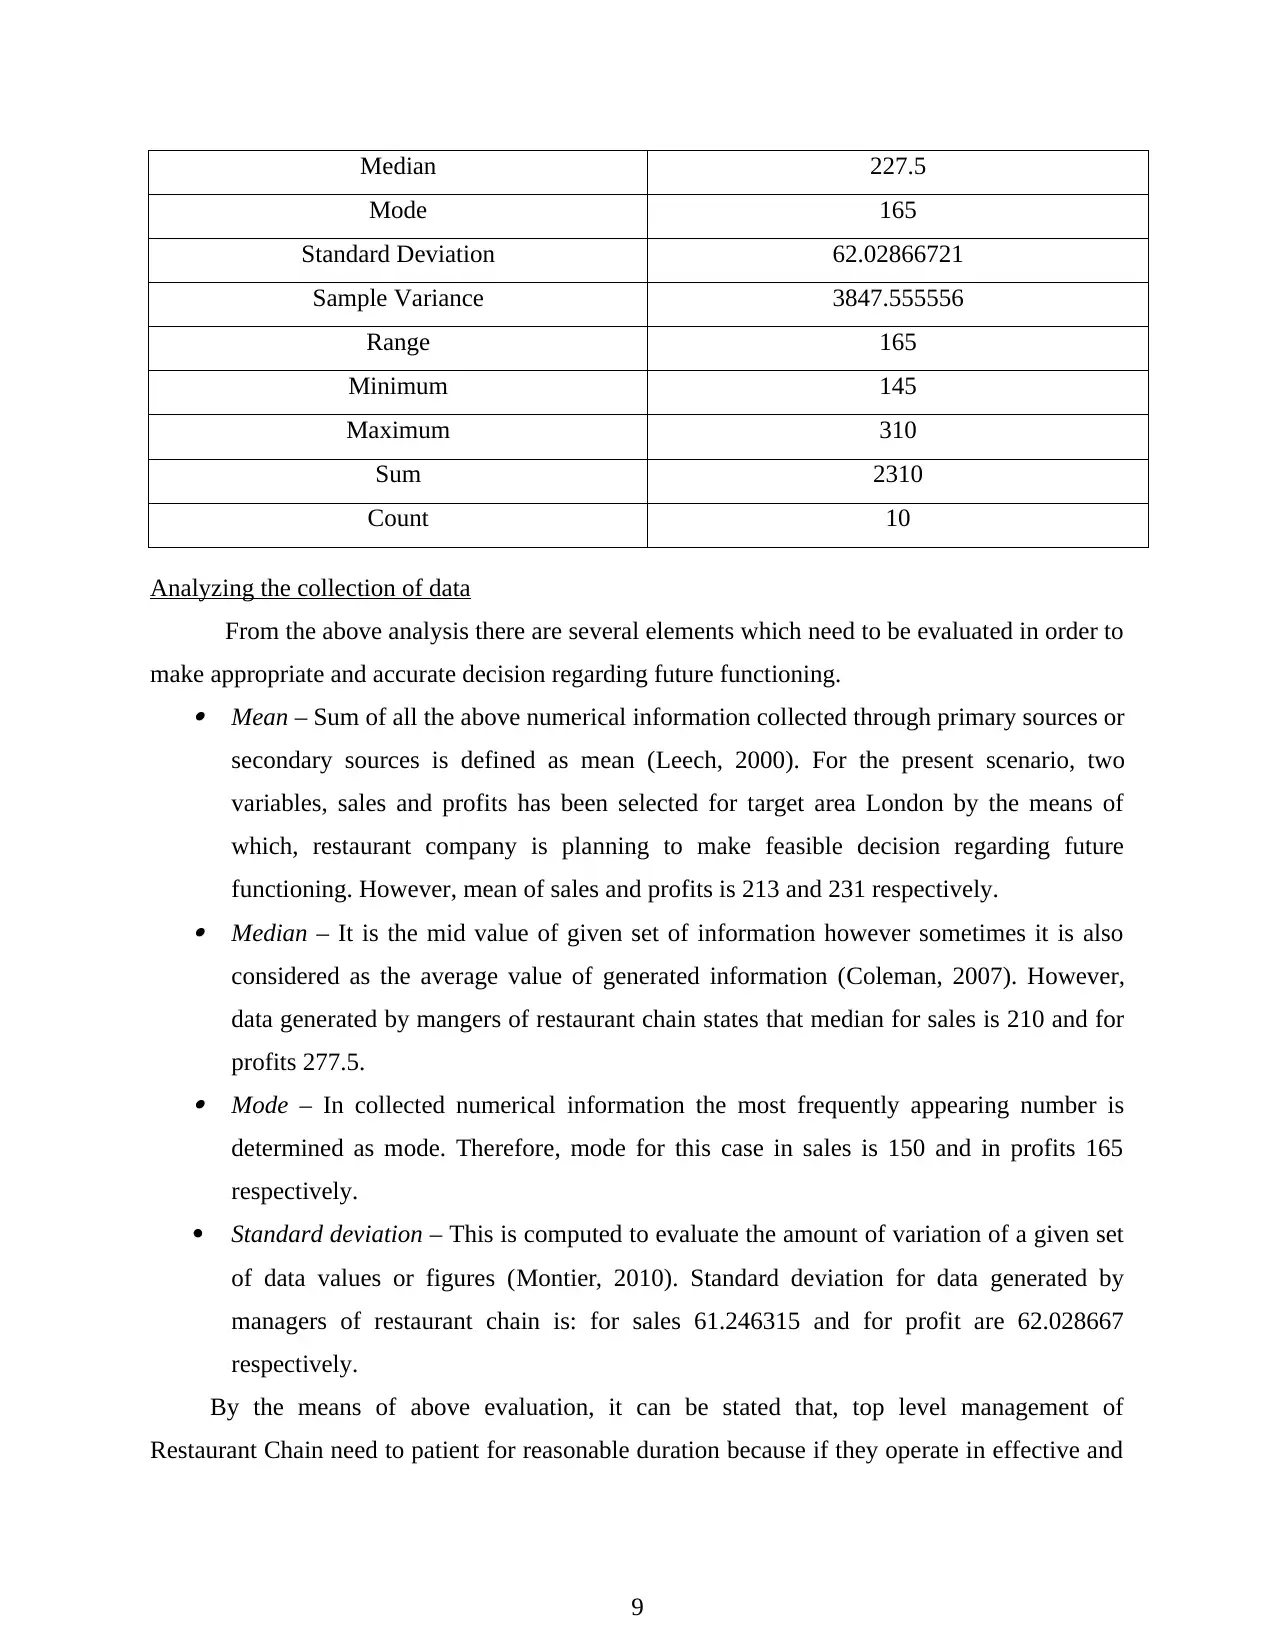
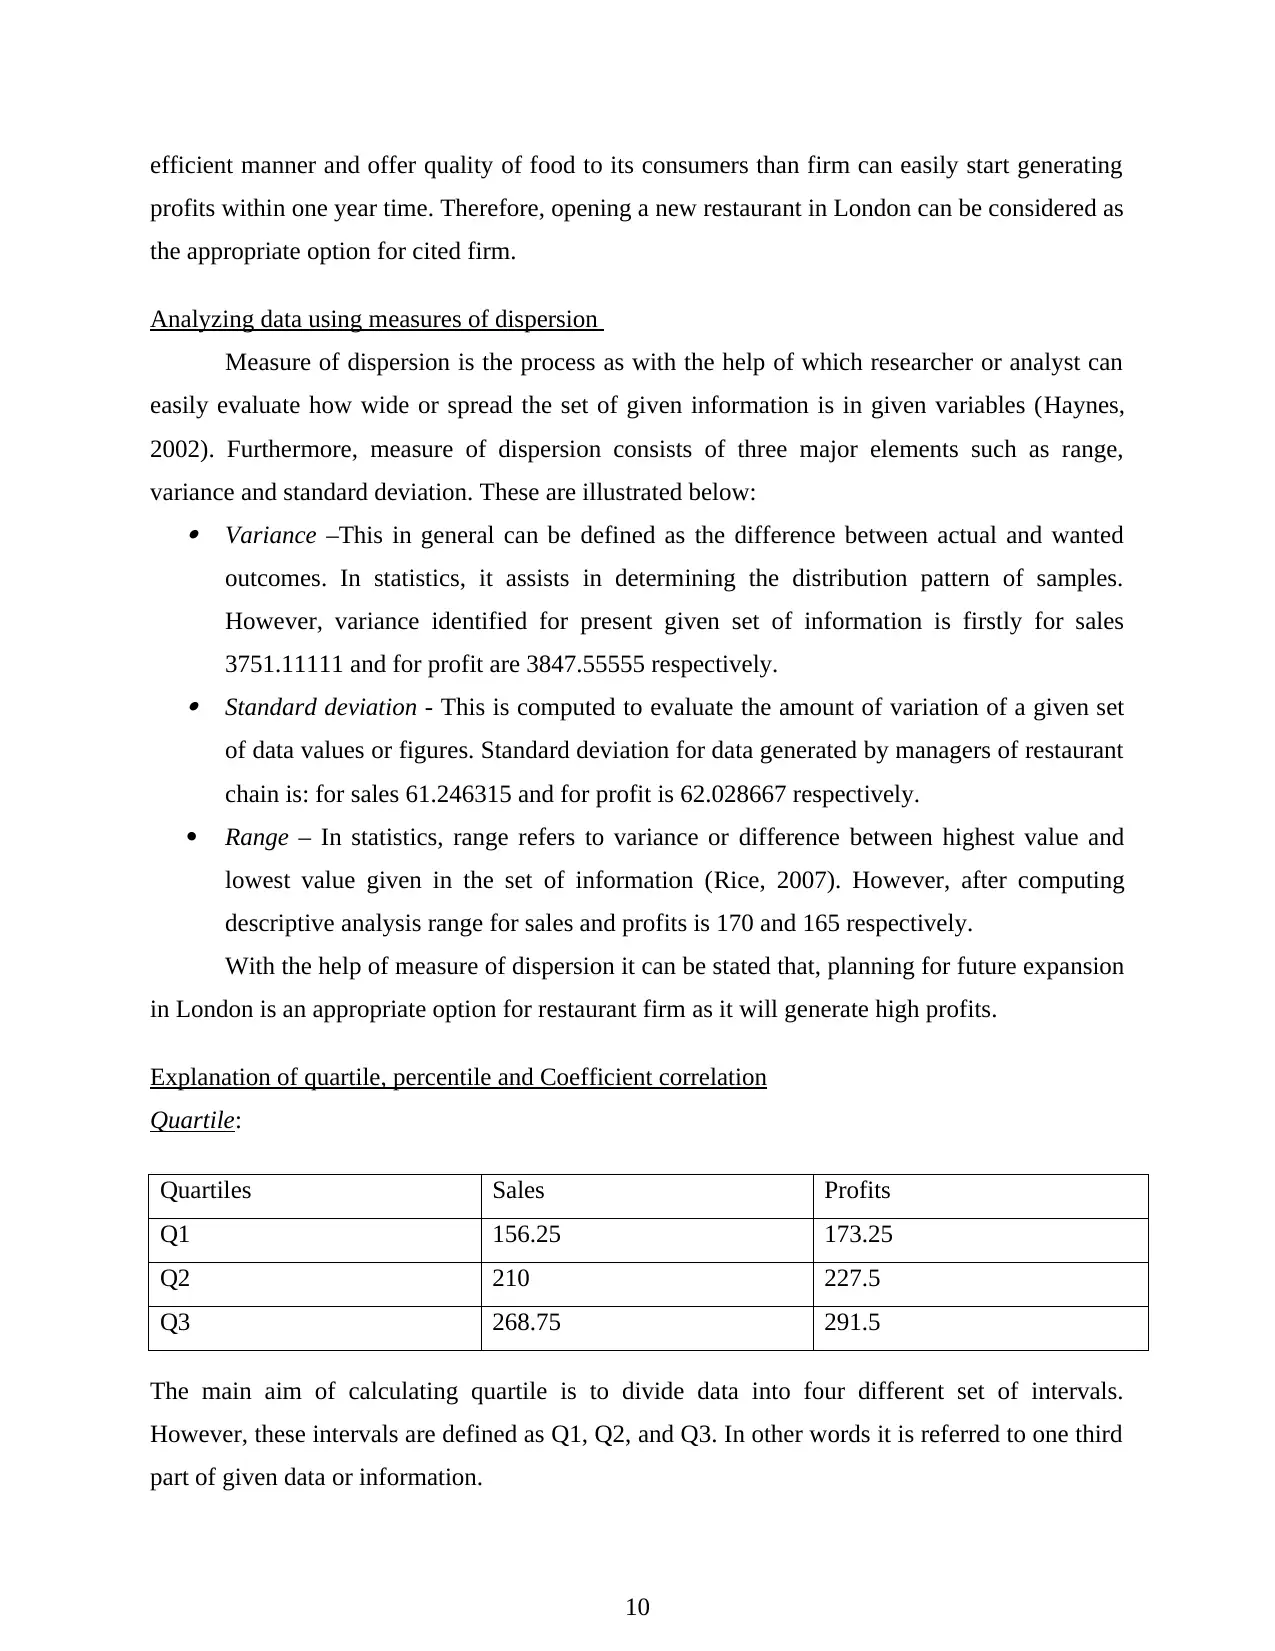
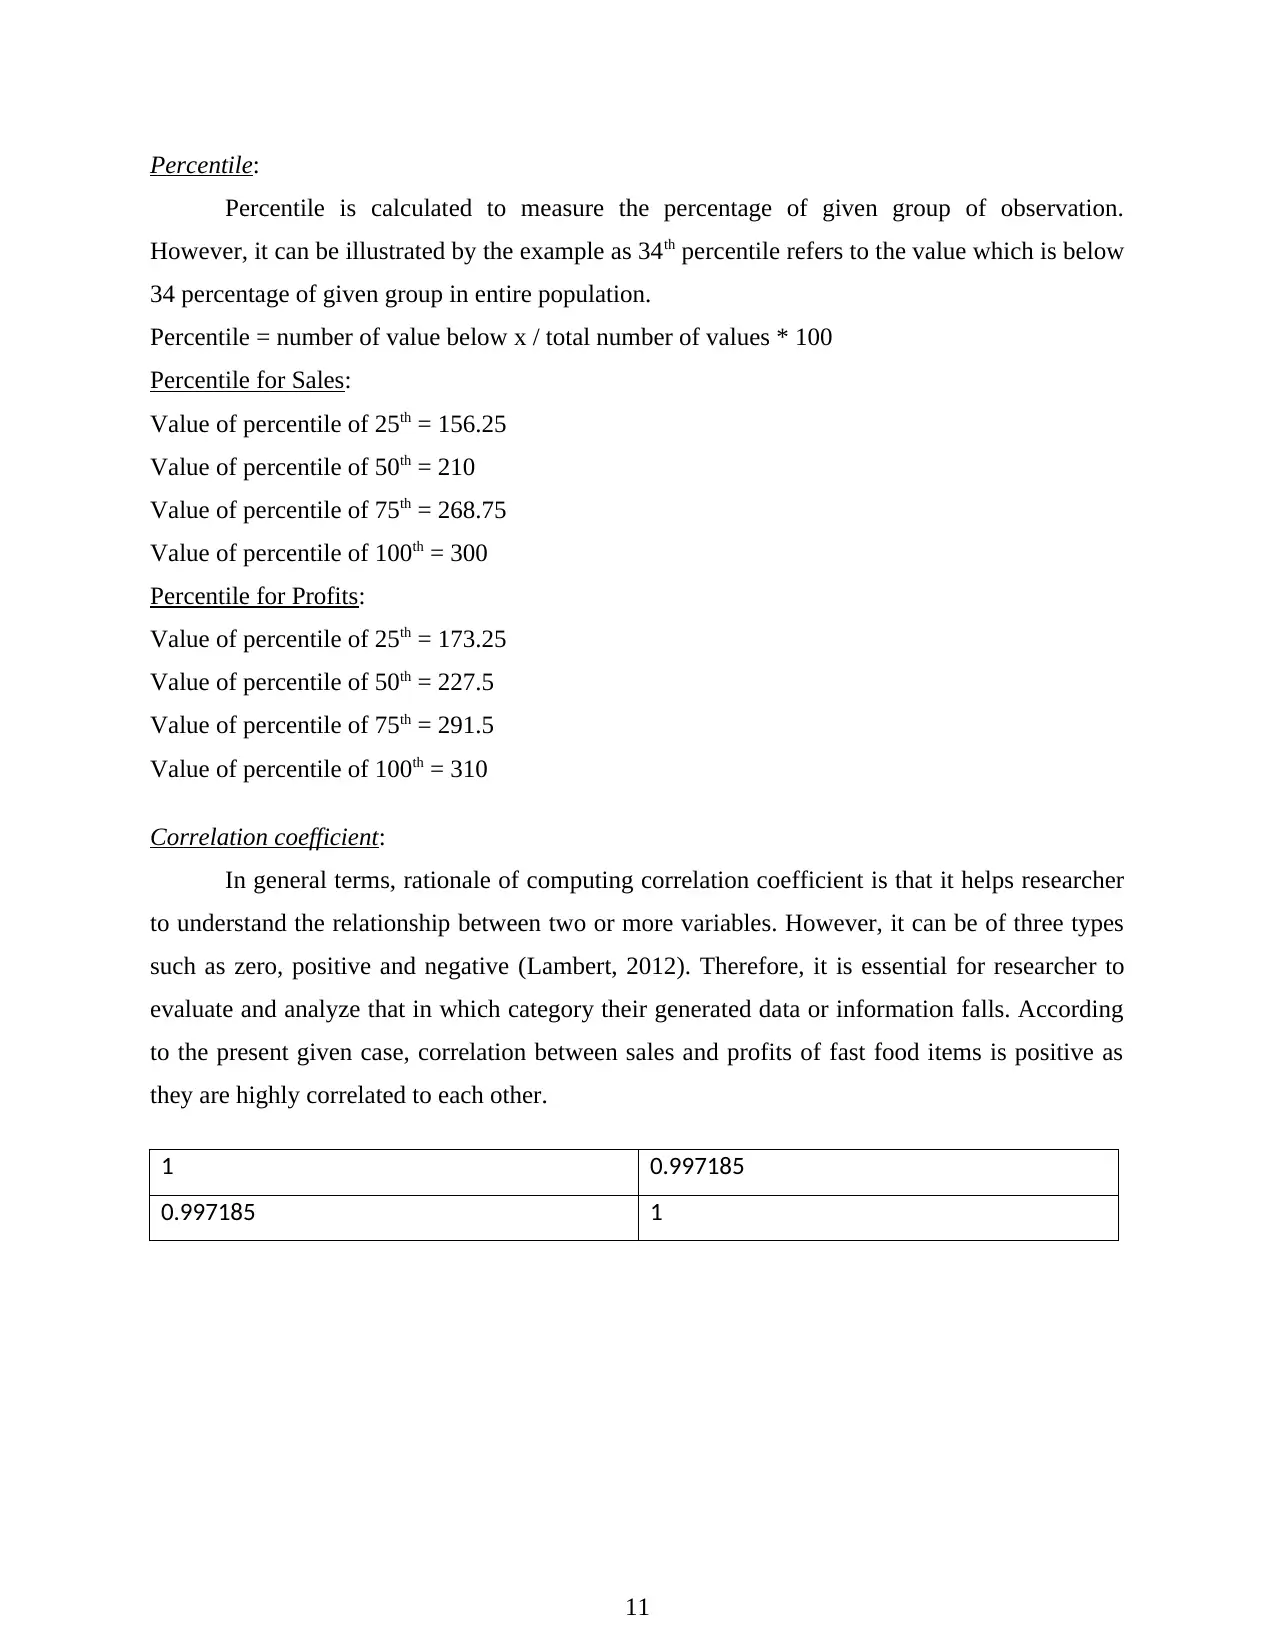
This report delves into the critical aspects of business decision-making within a restaurant chain, focusing on the strategic expansion of its operations. The report begins with an introduction to the significance of decision-making in a dynamic business environment, emphasizing the role of functional managers in achieving desired outcomes. The first task explores the use of diverse data sources, including primary data collected through survey methodologies and secondary data from financial reports, to assess market feasibility and customer preferences. It presents a detailed survey methodology with a sampling frame, a questionnaire, and the development of information for decision-making. Data analysis is performed using measures of dispersion, including mean, median, mode, and standard deviation, as well as quartiles, percentiles, and correlation coefficients. The second task focuses on the application of statistical graphs and reports, such as bar graphs, line charts, and spreadsheets, to visualize and interpret market trends. The report concludes with the use of financial tools and a formal business report to support strategic decisions. The analysis supports the feasibility of expanding the restaurant chain in London, based on positive market indicators and consumer preferences. The report is a comprehensive analysis of the restaurant's current and future business prospects.
tabler-icon-diamond-filled.svg

Contribute Materials

Your contribution can guide someone’s learning journey. Share your documents today.
Document Page
BUSINESS DECISION MAKING
tabler-icon-diamond-filled.svg

Secure Best Marks with AI Grader

Need help grading? Try our AI Grader for instant feedback on your assignments.
Document Page
TABLE OF CONTENTS
INTRODUCTION ..........................................................................................................................4
TASK 1: ABILITY TO USE VARIETY OF SOURCES FOR COLLECTION OF DATA AND
USING DIFFERENT TOOLS FOR DECISION MAKING...........................................................4
Plan for primary and secondary data and presenting the survey methodology and sampling
frame............................................................................................................................................4
Questionnaire...............................................................................................................................5
Developing information for decision making..............................................................................6
Analyzing the collection of data..................................................................................................7
Analyzing data using measures of dispersion .............................................................................8
Explanation of quartile, percentile and Coefficient correlation ..................................................9
TASK 2: USE OF STATISTICAL GRAPHS AND REPORTS FOR DECISION MAKING
AND SOFTWARE GENERATED INFORMATION FOR DECISION MAKING ...................10
Graphs and Spreadsheets ..........................................................................................................10
Trend lines.................................................................................................................................13
Formal business report...............................................................................................................15
Information processing tools .....................................................................................................16
Network diagram ...................................................................................................................16
Use of different financial tools..................................................................................................18
CONCLUSION .............................................................................................................................19
REFERENCES .............................................................................................................................20
Document Page
Document Page
4
tabler-icon-diamond-filled.svg

Secure Best Marks with AI Grader

Need help grading? Try our AI Grader for instant feedback on your assignments.
Document Page
INTRODUCTION
Top level management in an organization has several responsibilities to carry out in order
to attain successful run of business enterprise. Out of all, decision making is considered as the
most important aspect of business enterprise (Nicholson and Aman, 2012). However, in such
constantly changing environment, functional managers of an association has to make appropriate
judgment regarding conducting business activities so that desired results and outcomes can be
generated and company can attain sustainability. Present study highlights the importance of
decisions making in expanding business operations of a restaurant chain. Furthermore, with the
help of various financial and statistical tools and techniques each and every aspect of market and
restaurant business has been analyzed.
TASK 1: ABILITY TO USE VARIETY OF SOURCES FOR COLLECTION
OF DATA AND USING DIFFERENT TOOLS FOR DECISION
MAKING
Plan for primary and secondary data and presenting the survey methodology and sampling frame
In general terms, for a researcher to carry out feasible and suitable research it is essential
for him or her to adopt appropriate means of collecting data. However, there are two major
sources by the means of which managers of restaurant chain can generate data or information.
These are: Primary data collection method – Several experts and researcher states that, collecting
data through primary sources assist in generating accurate, quality and wide range of
information for carrying out overall research (Borhan, Mohamed and Azmi, 2014). In the
present given scenario, survey methodology has been selected in order to generate
primary data. Specific group of people and experts will be selected and on their reaction
and information decision will be made of expanding restaurant chain in London. By the
means of this, taste and preferences of people in cited location will be evaluated so that
top level management of restaurant can be recommended to open similar type of
restaurant to meet the needs and expectations of customers to a great extent. Secondary data collection method – At times in a research it is essential to generate
secondary data because it states records and past information related to the topic which is
considered as valuable while making any decisions. For the present study, annual reports
5
Document Page
and financial data of other existing restaurant will be used in order to evaluate the
feasibility of project (Schraeder and Morrison, 2005). By the means of this, entrepreneur
can make decision regarding future sales growth, demand and costs associated with the
functioning of a restaurant in London.
Survey Methodology:
Survey methodology helps in gathering accurate and feasible data on a particular topic.
However, in the present research report, by the means of survey methodology top level
management of restaurant chain can collect variety of information regarding taste and
preferences of customers, financial aspect of existing restaurants and current trend in food
industry etc (Vroom, 2003). Furthermore, making this approach more accurate, questionnaire
will be framed by the managers and can spread to selected bunch of respondents which will
answer different types of questions regarding specific topic and ensuring in making appropriate
futuristic decisions.
Sampling frame:
From the study of scenario given, random sampling would be an appropriate option for
researcher to undertake because it will assist him or her in selecting best possible group or
population by the means of which information can be generated. However, for the present study,
20 respondents have been selected which are differentiated in categories like employees, industry
experts and consumers (Burcher and Lee, 2000). Out of these 20 customers, 14 are male and 6
are female candidates. Further, it is the responsibility of functional managers of Restaurant
Company to ensure that both these methods are used in effective and appropriate manner so that
feasible information can be generated and correct and smart decisions can be made.
Questionnaire
Name:
Gender:
Age:
6
Document Page
Quest 1: Do you go in a restaurant for dinner or lunch?
Once in a week
Twice in 15 days
Once in a month
Quest 2: Rate the following food from 1-5 as per your preference?
1 2 3 4 5
Starter
Main course
Fried food
Quest 3: Do you prefer take away facilities?
Yes
No
Quest 4: Would you like to have online booking facilities in an restaurant?
Yes
No
Quest 5: Rate the following ranges (In terms of food) that would to you like to prefer?
1 2 3 4 5
Italian
Mexican
Spanish
Quest 6: What attracts you to go in a restaurant?
Food quality
Efficient services
Price
All of the above
Quest 7: What do you expect in a new restaurant?
_________________________________________________________________________
_________________________________________________________________________
7
tabler-icon-diamond-filled.svg

Paraphrase This Document

Need a fresh take? Get an instant paraphrase of this document with our AI Paraphraser
Document Page
Developing information for decision making
Year Sales Profits
2005 150 165
2006 175 198
2007 200 220
2008 150 165
2009 220 235
2010 130 145
2011 250 275
2012 275 297
2013 280 300
2014 300 310
Statistical description of sales:
Mean 213
Standard Error 19.3677854
Median 210
Mode 150
Standard Deviation 61.24631508
Sample Variance 3751.111111
Range 170
Minimum 130
Maximum 300
Sum 2130
Count 10
Statistical description of Profits:
Mean 231
Standard Error 19.61518686
8
Document Page
Median 227.5
Mode 165
Standard Deviation 62.02866721
Sample Variance 3847.555556
Range 165
Minimum 145
Maximum 310
Sum 2310
Count 10
Analyzing the collection of data
From the above analysis there are several elements which need to be evaluated in order to
make appropriate and accurate decision regarding future functioning. Mean – Sum of all the above numerical information collected through primary sources or
secondary sources is defined as mean (Leech, 2000). For the present scenario, two
variables, sales and profits has been selected for target area London by the means of
which, restaurant company is planning to make feasible decision regarding future
functioning. However, mean of sales and profits is 213 and 231 respectively. Median – It is the mid value of given set of information however sometimes it is also
considered as the average value of generated information (Coleman, 2007). However,
data generated by mangers of restaurant chain states that median for sales is 210 and for
profits 277.5. Mode – In collected numerical information the most frequently appearing number is
determined as mode. Therefore, mode for this case in sales is 150 and in profits 165
respectively.
Standard deviation – This is computed to evaluate the amount of variation of a given set
of data values or figures (Montier, 2010). Standard deviation for data generated by
managers of restaurant chain is: for sales 61.246315 and for profit are 62.028667
respectively.
By the means of above evaluation, it can be stated that, top level management of
Restaurant Chain need to patient for reasonable duration because if they operate in effective and
9
Document Page
efficient manner and offer quality of food to its consumers than firm can easily start generating
profits within one year time. Therefore, opening a new restaurant in London can be considered as
the appropriate option for cited firm.
Analyzing data using measures of dispersion
Measure of dispersion is the process as with the help of which researcher or analyst can
easily evaluate how wide or spread the set of given information is in given variables (Haynes,
2002). Furthermore, measure of dispersion consists of three major elements such as range,
variance and standard deviation. These are illustrated below: Variance –This in general can be defined as the difference between actual and wanted
outcomes. In statistics, it assists in determining the distribution pattern of samples.
However, variance identified for present given set of information is firstly for sales
3751.11111 and for profit are 3847.55555 respectively. Standard deviation - This is computed to evaluate the amount of variation of a given set
of data values or figures. Standard deviation for data generated by managers of restaurant
chain is: for sales 61.246315 and for profit is 62.028667 respectively.
Range – In statistics, range refers to variance or difference between highest value and
lowest value given in the set of information (Rice, 2007). However, after computing
descriptive analysis range for sales and profits is 170 and 165 respectively.
With the help of measure of dispersion it can be stated that, planning for future expansion
in London is an appropriate option for restaurant firm as it will generate high profits.
Explanation of quartile, percentile and Coefficient correlation
Quartile:
Quartiles Sales Profits
Q1 156.25 173.25
Q2 210 227.5
Q3 268.75 291.5
The main aim of calculating quartile is to divide data into four different set of intervals.
However, these intervals are defined as Q1, Q2, and Q3. In other words it is referred to one third
part of given data or information.
10
tabler-icon-diamond-filled.svg

Secure Best Marks with AI Grader

Need help grading? Try our AI Grader for instant feedback on your assignments.
Document Page
Percentile:
Percentile is calculated to measure the percentage of given group of observation.
However, it can be illustrated by the example as 34th percentile refers to the value which is below
34 percentage of given group in entire population.
Percentile = number of value below x / total number of values * 100
Percentile for Sales:
Value of percentile of 25th = 156.25
Value of percentile of 50th = 210
Value of percentile of 75th = 268.75
Value of percentile of 100th = 300
Percentile for Profits:
Value of percentile of 25th = 173.25
Value of percentile of 50th = 227.5
Value of percentile of 75th = 291.5
Value of percentile of 100th = 310
Correlation coefficient:
In general terms, rationale of computing correlation coefficient is that it helps researcher
to understand the relationship between two or more variables. However, it can be of three types
such as zero, positive and negative (Lambert, 2012). Therefore, it is essential for researcher to
evaluate and analyze that in which category their generated data or information falls. According
to the present given case, correlation between sales and profits of fast food items is positive as
they are highly correlated to each other.
1 0.997185
0.997185 1
11
Document Page
TASK 2: USE OF STATISTICAL GRAPHS AND REPORTS FOR
DECISION MAKING AND SOFTWARE GENERATED INFORMATION
FOR DECISION MAKING
Graphs and Spreadsheets
Year 2012 (In millions) 2013 (In millions) 2014 (In millions)
Hot Dog 2 9 8
Chow Mein 4 5 9
Chicken Rolls 6 4 5
Ravioli pasta 6 3 5
2012:
Figure 1: 2012
2013:
12
Document Page
Figure 1:2013
2014:
Figure 1: 2014
Bar Graph:
13
tabler-icon-diamond-filled.svg

Paraphrase This Document

Need a fresh take? Get an instant paraphrase of this document with our AI Paraphraser
Document Page
Figure 1: Bar Graph
Line Chart:
Figure 1: Line Graph
Summary:
Graphical presentation can provide appropriate results if used in an effective manner.
However, it is the duty of managers to understand trend lines and pie charts to evaluate and
analyze the actual position of market regarding specific topic. In the present case, Restaurant
14
Document Page
Company’s manager has evaluated various graphs and pie charts in order to make accurate
decision regarding expanding business operations in London.
By the means of above graphical presentation it can be stated that, population of London
are consuming fast food at high rate. This can be a positive sign and an opportunity for top level
management of cited restaurant. Furthermore, from the pie charts and bar graph it can be stated
that, Ravioli Pasta, hot dog and Chowmein are showing great results as they are highly in
demand at present. Along with that if chef of restaurant chain can bring innovation and creativity
within its food than it can be an appropriate option for business enterprise in launching a new
restaurant in London. It is essential for top level management to understand the taste and
preferences of customers and according to that, offer them fast food in order to create better
customer base.
Evaluation:
On the perspective of economic outcomes opening a new restaurant is a feasible option
for management of restaurant chain. However, rationale to this is the overall turnover in last
three years. The above stated figures clearly indicates that, restaurant providing quality of food
and as per the needs and wants of customers will assist in generating higher profit margins.
Along with that, from the above analysis it can be said that people of London are ready to spend
high money on quality of fast food. Therefore, it is the duty of top level management to ensure
that restaurant provides quality of food at affordable prices so that large audience can be
attracted in short span of time. Moreover, bringing innovation and creativity within food will
help firm to attract customers and consumers on routine basis. Therefore, expanding business
operations by establishing new restaurant is appropriate and effective move by Board of
Directors.
Trend lines
Hot Dog:
15
Document Page
Figure 1: Forecast of Hot Dog
Chicken Rolls:
Figure 1: Forecast of Chicken Rolls
Chow Mein:
16
tabler-icon-diamond-filled.svg

Secure Best Marks with AI Grader

Need help grading? Try our AI Grader for instant feedback on your assignments.
Document Page
Figure 1: Forecast of Chow Mein
Ravioli Pasta:
Figure 1: Forecast of Ravioli Pasta
Formal business report
To
Board of directors of restaurant chain
Date: 22nd March, 2016
Introduction: This report details the results of research findings in relation to restaurant
17
Document Page
chain. It will help to assess the consumer needs, their demand, taste and preferences so as to
attain high growth in the future period.
Methods: For the research, survey methodology has been adopted to gather specific
kind of information. Along with this, sampling method has been used to select an adequate size
of sample and gather information. For the present study, sample of 20 respondents has been
selected. In this, questionnaire has been constructed and filled up by 20 respondents who are
using products offered by restaurant chain to a great extent. However, secondary information
has been generated by using web facility and previous historical records.
Findings: On the basis of above research, it has been found that Chowmein has a rising
trend while other food products such as Ravioli pasta and chicken rolls shows an fluctuating
trend. On the other hand, Hot dog selling shows a fluctuating trend as in the year 2013, it has
been inclined while in 2014, it resulted in declining trend and affects the fast food restaurant in
an adverse manner. Thus, it says that Chowmein is highly demanded by large number of people
as compared to other food products.
Along with this, trend line predicted that in future years, sales of Chowmein will be
significantly increased. However, sales for hot dog will be increased at lower rate as compared
to this product. However, other food items such as Ravioli pasta and Chicken rolls show a
declining trend due to lower demand.
Conclusion: On the basis of above findings, it can be reported that Fast food restaurant
chain needs to offer Chow Mein and Hot dog products to meet large number of consumer's
demand. It will lead to enhance consumer satisfaction and to attain long run sustainability.
The main aim of managers behind undertaking graphical presentation and statistical
presentation is that, these tools helps in understanding and evaluating taste and preferences of
customers appropriately (Narayanan and Nanda, 2006). Along with that, financial aspect has
been evaluated and it clearly indicates that if restaurant firm operates effectively and provide
quality of food then they can easily generate profits.
However, the main aim of restaurant chain is to provide quality of fast food items to its
customers in order to create loyalty and faith. As well as offering them attractive offers with
variety of food to create competitive edge within target market. Furthermore, in order to enhance
level of restaurant service, top level management can undertake various methods such as live
music, happy hours etc. to attract customers and generate high sales for attaining sustainability
(Zelman, McCue and Noah, 2009).
18
Document Page
Information processing tools
Information technology plays a significant role in an organisation. At present there are
various IT tools available to the firms through which efficiency of business operations can be
improved (Mclean, 2002). According to present given scenario, restaurant chain undertaking IT
technology will assist in taking orders electronically as well as showing the menu electronically
so that people can easily generate the information regarding variety of the food. Apart from this,
management information system can be used at different levels of business such as: Strategic level – MIS helps senior authority to generate current information regarding
market and trends so that they make decision regarding bringing change and
modifications within approach of fast food restaurant (Manshu, 2010). Tactical level – By the means of MIS, functional managers can make decisions regarding
routine activities appropriately as well as understand the actual position of firm in
comparison to corporate aims and objectives.
Operational level – At this level, MIS can help front line mangers to deal with its
subordinate effectively. Along with that, managers can easily monitor the performance of
junior employees by the help of MIS (John, 2012).
Network diagram
Activities Time required Preceding activities
Conducting market research 2 month -
Identifying location for
restaurant
4 months -
Recruiting staff members 3 months -
Modification in Ambience 3 month 1
Implementing the plan of setting
restaurant
0.5 month 2
Training sessions for staff
members
1months 3,4
Implementation of various rules 2 month 5
Proper Final documentation 0.5 month 7,6
19
tabler-icon-diamond-filled.svg

Paraphrase This Document

Need a fresh take? Get an instant paraphrase of this document with our AI Paraphraser
Document Page
process
Starting of restaurant 1 month 8
Monitoring 1.5 month 9
Preparation of opening 0.5 month 10
Gantt chart:
Figure 1: Gantt chart
Network diagram:
Figure 1: Network Diagram
Use of different financial tools
Investment appraisal techniques have been used in the present report to evaluate the best
possible investment proposal for the top level management of the company so that they can
selected best suitable proposal and invest in it to generate better financial results in near future.
20
Document Page
Cash flows:
Year Project I Project Z
2014 600 450
2015 750 700
2016 850 950
2017 1150 1250
NPV:
In general, net present value is one of the most significant investment appraisal
techniques of all because it considers the time value for money. However, investors mostly uses
this tool to evaluate the feasibility and reliability of the investment project so that they can make
accurate and smart decisions.
Initial investment
Project I: 1800000
Project Z: 1200000
Project I:
Table 1: NPV of Project I
Year Cash flows (£000) Pv factor 10% Present value (£000)
2014 600 0.909 545.4
2015 750 0.826 619.5
2016 850 0.751 638.3
2017 1150 0.606 696.9
Total value 2500
(-)Initial investment 1800
NPV 700
Project Z:
Table 1: NPV of Project Z
Year Cash flows (£000) Pv factor 10% Present value (£000)
2014 450 0.909 409
2015 700 0.826 578.2
2016 950 0.751 713.4
2017 1250 0.606 757.5
Total value 2458.1
(-)Initial investment 1200
NPV 1258.1
Internal rate of return:
21
Document Page
Internal rate of return is another capital budgeting technique that is used to evaluate the
rate at which project will generate the return. However, this technique makes all the cash flows
of the project equal to zero.
Table 1: IRR of Both Projects
Project I (£000) Project Z (£000)
0 1800 1200
1 600 450
2 750 700
3 850 950
4 1150 1250
Internal rate of return 12% 26%
Interpretation:
By the means of above computation, it can be stated that, Restaurant Company should
invest in the project Z. The rationale behind this project is that, it is showing high net present
value which considers time value for money as well reliable in terms of generating accurate
results and outcomes.
CONCLUSION
From the above research report, it can be stated that, decision making is one of the most
important aspect in an organisation and it is the responsibility of top level managers to make
correct and smart decisions for attaining success in near future. In the present report, financial
feasibility of new restaurant launch has been evaluated and by the means of which it can be said
to top level management of restaurant chain that, they should open a new restaurant in London
because it is showing positive results in terms of demand and revenue generation.
22
tabler-icon-diamond-filled.svg

Secure Best Marks with AI Grader

Need help grading? Try our AI Grader for instant feedback on your assignments.
Document Page
REFERENCES
Journal
Borhan, H., Mohamed, N. R. and Azmi, N., 2014. The impact of financial ratios on the financial
performance of a chemical company : The case of LyondellBasell Industries. World
Journal of Entrepreneurship, Management and Sustainable Development. 10(2). pp. 154
– 160.
Burcher, G. P. and Lee, L. G., 2000. Competitiveness strategies and AMT investment decisions.
Integrated Manufacturing Systems. 11(5). pp. 340 – 347
Coleman, L., 2007. Risk and decision making by finance executives: a survey study.
International Journal of Managerial Finance. 3(1). pp. 108 – 124.
Leech, J. T., 2000. Managing risk and making money. Balance Sheet. 8(2). pp. 28 – 30.
Nicholson, B. and Aman, A., 2012. Managing attrition in offshore finance and accounting
outsourcing: Exploring the interplay of competing institutional logics. Strategic
Outsourcing: An International Journal. 5(3). pp.232 - 247.
Schraeder, M. and Morrison, R, 2005. Commander's evaluation in the context of business
decision-making: a multi-perspective approach. Development and Learning in
Organizations, 19 (4). pp.14 – 16.
Vroom, H. V., 2003. Educating managers for decision making and leadership. Management
Decision. 41(10). pp. 968 – 978.
Books
Haynes, E. M., 2002. Project Management: Practical Tools for Success. Cengage Learning.
Lambert, A. R., 2012. Financial Literacy for Managers: Finance and Accounting for Better
Decision-Making. Wharton Digital Press.
Mclean, R., 2002. Financial Management in Health Care Organizations. Cengage Learning
Montier, J., 2010. Value Investing: Tools and Techniques for Intelligent Investment. John Wiley
& Sons.
Narayanan, P. M. and Nanda, K. V., 2006. Finance For Strategic Decision Making: What Non-
Financial Managers Need To Know. John Wiley & Sons.
Rice, A. J. 2007. Mathematical Statistics and Data Analysis. Cengage Learning.
Zelman, N. W., McCue, J. M. and Noah D. G., 2009. Financial Management of Health Care
Organizations: An Introduction to Fundamental Tools, Concepts and Applications. John
Wiley & Sons.
23
Document Page
Online
John, W., 2012. Financial information and the decision making process. [PDF]. Available
through: <http://samples.jbpub.com/9780763789299/82999_ch01_FINAL.pdf>.
[Accessed on 29th January 2015].
Manshu, 2010. What is IRR and how is it calculated. [Online] Available through:
<http://www.onemint.com/2010/11/23/what-is-irr-and-how-is-it-calculated/>. [Accessed
on 29th January 2015].
24
chevron_up_icon
1 out of 24
circle_padding
hide_on_mobile
zoom_out_icon
logo.png

Your All-in-One AI-Powered Toolkit for Academic Success.

Available 24*7 on WhatsApp / Email

[object Object]