Comprehensive Risk Assessment: Comparative Analysis of Bank Ratios
VerifiedAdded on 2023/06/03
|23
|5344
|196
Report
AI Summary
This report provides a comparative risk assessment of four major Australian banks—National Australia Bank (NAB), ANZ, Commonwealth Bank, and Westpac—focusing on strategic risk, interest rate risk, market risk, credit risk, and liquidity risk. The assessment utilizes financial ratios calculated from publicly available data to identify potential 'red flags' requiring management attention. The analysis covers capital ratios, operational ratios, liquidity ratios, and asset ratios over a 12-year period. Key findings include ANZ's high Tier 1 ratio indicating strong loss absorption capacity, NAB's consistent equity to total assets ratio, and a comparative evaluation of net interest margins and return on equity. The report concludes with recommendations to the Board based on these analyses, offering insights into the banks' financial stability and risk management strategies.

Running Head: INSTITUTIONAL ASSETS AND LIABILITIES
0
INSTITUTIONAL ASSETS AND LIABILITIES
0
INSTITUTIONAL ASSETS AND LIABILITIES
Paraphrase This Document
Need a fresh take? Get an instant paraphrase of this document with our AI Paraphraser

Running Head: INSTITUTIONAL ASSETS AND LIABILITIES
Table of Contents
Introduction................................................................................................................................2
Strategic risk...............................................................................................................................2
Capital Ratios.........................................................................................................................2
Interest rate risk..........................................................................................................................3
Operational Ratios..................................................................................................................4
Market Risk................................................................................................................................6
Liquidity ratios.......................................................................................................................6
Credit risk...................................................................................................................................7
Asset ratios.............................................................................................................................7
Conclusion..................................................................................................................................9
References................................................................................................................................10

Running Head: INSTITUTIONAL ASSETS AND LIABILITIES
Introduction
Risk assessment is the term which is used by the company to determine the overall
process and the methods. The process is undertaken to identify the hazards and the risky
factors that the company is going to affect the organisation. Analyse and evaluate the risk
associated with the risk analysis and the risk evaluation. The report below is the analysis of
the ratios of the 4 banks which are National Australian Bank and the same is compared with
the ANZ bank, Commonwealth bank and the Westpac bank (Cohen & Scatigna, 2016).
Strategic risk
The strategic risk has been defined as the central risk of the business. The key aim of
the strategic risk management is to strengthen the earnings of the banks through the resilience
and the same has been protected with the assistance of the undue earnings volatility to gauge
the overall risk targets. For the purpose of determining the strategic risk of any bank the
leverage ratios and the CET 1 ratios are calculated (Behn, Haselmann & Vig, 2016).
Capital Ratios
Capital Adequacy ratio is also known as the Capital to Risk Weighted Asset ratio in
relation to the bank’s capital and the risk. The capital ratios are divided among the three
major categories such as the Tier 1 ratios, the equity to total assets ratio and the capital funds
by liabilities. This ratio basically determines the capital structure of the banks and from the
table below it can be analysed that the NAB’s Tier 1 ratio is has been 12.41 which are the
third highest in terms of the other comparing banks. The tier 1 ratio of the NAB increased
from 6.67 in the year 2007 to 12.41 in the year 2017 and the ANZ bank increased from 7.30
and just reached double the amount at 14.10 being the highest performer in terms of the tier 1
ratio. The CBA and the Westpac are again on the same motion at 12.3 and the 12.66
⊘ This is a preview!⊘
Do you want full access?
Subscribe today to unlock all pages.
Trusted by 1+ million students worldwide
Running Head: INSTITUTIONAL ASSETS AND LIABILITIES
respectively. The tier 1 ratio determines the ability of the company to absorb the losses
therefore higher the ratio, higher the company is able to absorb it. From the above results it
can be analysed that ANZ bank is highly capable and after that the Westpac bank in
comparison to the NBA bank for the financial year 2017 as well as the past 4 years (Estrella,
Park & Peristiani, 2012).
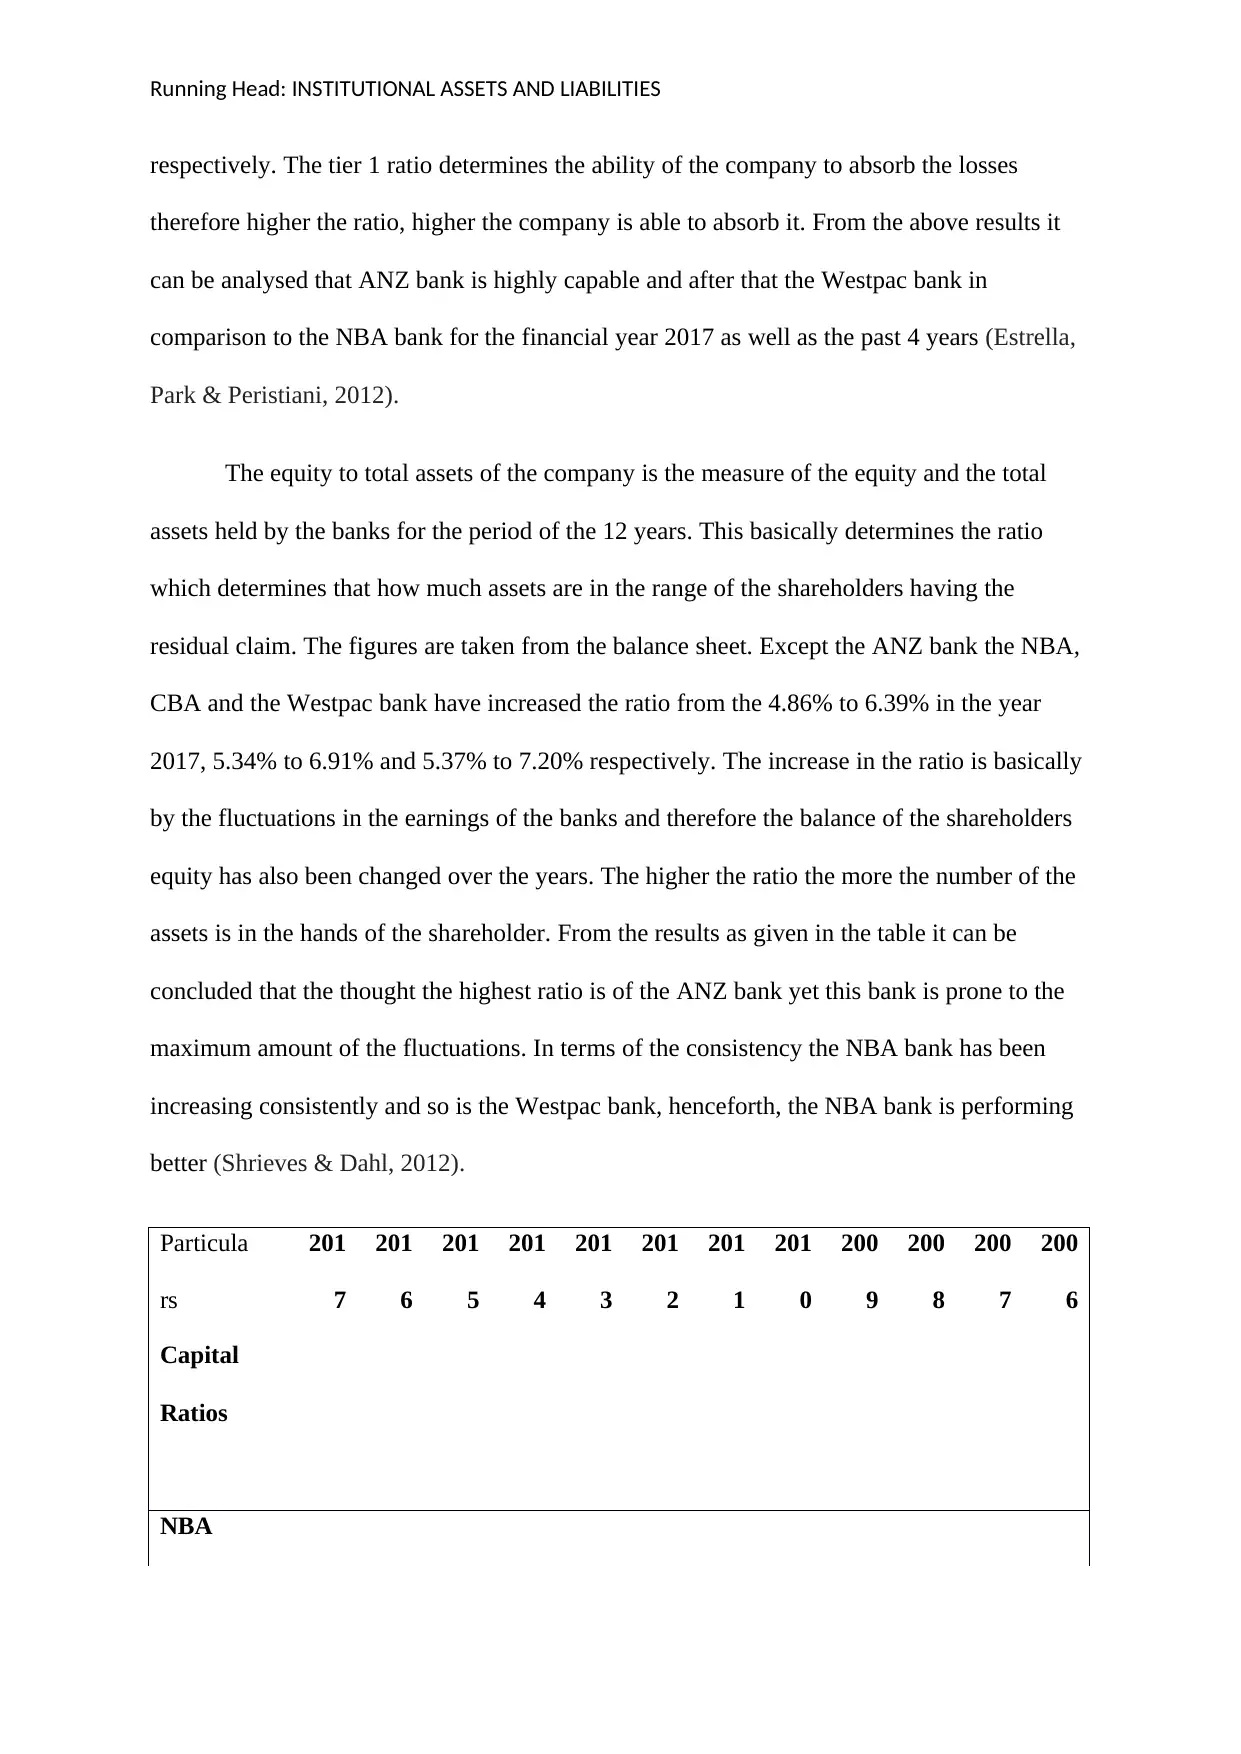
The equity to total assets of the company is the measure of the equity and the total
assets held by the banks for the period of the 12 years. This basically determines the ratio
which determines that how much assets are in the range of the shareholders having the
residual claim. The figures are taken from the balance sheet. Except the ANZ bank the NBA,
CBA and the Westpac bank have increased the ratio from the 4.86% to 6.39% in the year
2017, 5.34% to 6.91% and 5.37% to 7.20% respectively. The increase in the ratio is basically
by the fluctuations in the earnings of the banks and therefore the balance of the shareholders
equity has also been changed over the years. The higher the ratio the more the number of the
assets is in the hands of the shareholder. From the results as given in the table it can be
concluded that the thought the highest ratio is of the ANZ bank yet this bank is prone to the
maximum amount of the fluctuations. In terms of the consistency the NBA bank has been
increasing consistently and so is the Westpac bank, henceforth, the NBA bank is performing
better (Shrieves & Dahl, 2012).
Particula
rs
201
7
201
6
201
5
201
4
201
3
201
2
201
1
201
0
200
9
200
8
200
7
200
6
Capital
Ratios
NBA
respectively. The tier 1 ratio determines the ability of the company to absorb the losses
therefore higher the ratio, higher the company is able to absorb it. From the above results it
can be analysed that ANZ bank is highly capable and after that the Westpac bank in
comparison to the NBA bank for the financial year 2017 as well as the past 4 years (Estrella,
Park & Peristiani, 2012).
The equity to total assets of the company is the measure of the equity and the total
assets held by the banks for the period of the 12 years. This basically determines the ratio
which determines that how much assets are in the range of the shareholders having the
residual claim. The figures are taken from the balance sheet. Except the ANZ bank the NBA,
CBA and the Westpac bank have increased the ratio from the 4.86% to 6.39% in the year
2017, 5.34% to 6.91% and 5.37% to 7.20% respectively. The increase in the ratio is basically
by the fluctuations in the earnings of the banks and therefore the balance of the shareholders
equity has also been changed over the years. The higher the ratio the more the number of the
assets is in the hands of the shareholder. From the results as given in the table it can be
concluded that the thought the highest ratio is of the ANZ bank yet this bank is prone to the
maximum amount of the fluctuations. In terms of the consistency the NBA bank has been
increasing consistently and so is the Westpac bank, henceforth, the NBA bank is performing
better (Shrieves & Dahl, 2012).
Particula
rs
201
7
201
6
201
5
201
4
201
3
201
2
201
1
201
0
200
9
200
8
200
7
200
6
Capital
Ratios
NBA
Paraphrase This Document
Need a fresh take? Get an instant paraphrase of this document with our AI Paraphraser

Running Head: INSTITUTIONAL ASSETS AND LIABILITIES
Tier 1
ratios
12.4
1
12.1
9
12.4
4
10.8
1
10.3
5
10.2
7 9.7 8.91 8.96 7.35 6.67 7.35
Equity/
Total
Assets
6.39
%
6.48
%
5.71
%
5.20
%
5.46
%
5.40
%
5.26
%
5.30
%
5.39
%
4.64
%
4.86
%
5.36
%
Capital
funds/Liabi
lities 1.08 1.08 1.07 1.06 1.06 1.06 1.06 1.06 1.07 1.06 1.06 1.07
ANZ
Tier 1
ratios
14.1
0
13.2
0
12.7
0
11.1
0
10.8
0
10.8
0
10.0
2 9.68 9.03 8.13 7.90 7.34
Equity/
Total
Assets
8.11
%
7.72
%
8.24
%
8.91
%
9.26
%
8.99
%
8.91
%
8.97
%
8.56
%
7.98
%
8.07
% 9%
Capital
funds/Liabi
lities 1.09 1.09 1.09 1.10 1.11 1.10 1.10 1.10 1.09 1.09 1.09 1.09
CBA
Tier 1
ratios 12.3 12.1 12.3 11.2 11.1 10.3
10.0
1
10.0
1 9.15 8.07 8.17 7.14
Equity/
Total
Assets
6.91
%
6.47
%
6.44
%
5.90
%
6.05
%
5.85
%
5.58
%
5.37
%
5.36
%
4.92
%
5.17
%
5.34
%
Capital 109 108 108 107 107 107 107 107 107 106 107 107
Tier 1
ratios
12.4
1
12.1
9
12.4
4
10.8
1
10.3
5
10.2
7 9.7 8.91 8.96 7.35 6.67 7.35
Equity/
Total
Assets
6.39
%
6.48
%
5.71
%
5.20
%
5.46
%
5.40
%
5.26
%
5.30
%
5.39
%
4.64
%
4.86
%
5.36
%
Capital
funds/Liabi
lities 1.08 1.08 1.07 1.06 1.06 1.06 1.06 1.06 1.07 1.06 1.06 1.07
ANZ
Tier 1
ratios
14.1
0
13.2
0
12.7
0
11.1
0
10.8
0
10.8
0
10.0
2 9.68 9.03 8.13 7.90 7.34
Equity/
Total
Assets
8.11
%
7.72
%
8.24
%
8.91
%
9.26
%
8.99
%
8.91
%
8.97
%
8.56
%
7.98
%
8.07
% 9%
Capital
funds/Liabi
lities 1.09 1.09 1.09 1.10 1.11 1.10 1.10 1.10 1.09 1.09 1.09 1.09
CBA
Tier 1
ratios 12.3 12.1 12.3 11.2 11.1 10.3
10.0
1
10.0
1 9.15 8.07 8.17 7.14
Equity/
Total
Assets
6.91
%
6.47
%
6.44
%
5.90
%
6.05
%
5.85
%
5.58
%
5.37
%
5.36
%
4.92
%
5.17
%
5.34
%
Capital 109 108 108 107 107 107 107 107 107 106 107 107

Running Head: INSTITUTIONAL ASSETS AND LIABILITIES
funds/Liabi
lities % % % % % % % % % % % %
WESTP
AC
Tier 1
ratios
12.6
6
11.1
7
11.4
0
10.6
0
10.7
0
10.3
0 9.70 9.10 8.10 7.80 6.50 6.90
Equity/
Total
Assets
7.20
%
6.93
%
6.55
%
6.30
%
6.67
%
6.57
%
6.25
%
6.49
%
6.20
%
4.43
%
4.72
%
5.37
%
Capital
funds/Liabi
lities 1.09 1.08 1.08 1.07 1.08 1.08 1.07 1.07 1.07 1.05 1.05 1.06
Interest rate risk
Interest Rate risk exposure arises when the change in the interest rates has the
potential to affect the numerical value of the assets and the liabilities, the operational ratios
are calculated. The following table determine the data of the National Bank of Australia for
the period of 12 years. The operational ratios basically are divided into the four categories
which are Net interest margin, return on assets, return on equity and cost to income ratio
(Drechsler, Savov & Schnabl, 2018).
NB
A 2017
201
6 2015 2014 2013
201
2 2011 2010
200
9 2008 2007 2006
funds/Liabi
lities % % % % % % % % % % % %
WESTP
AC
Tier 1
ratios
12.6
6
11.1
7
11.4
0
10.6
0
10.7
0
10.3
0 9.70 9.10 8.10 7.80 6.50 6.90
Equity/
Total
Assets
7.20
%
6.93
%
6.55
%
6.30
%
6.67
%
6.57
%
6.25
%
6.49
%
6.20
%
4.43
%
4.72
%
5.37
%
Capital
funds/Liabi
lities 1.09 1.08 1.08 1.07 1.08 1.08 1.07 1.07 1.07 1.05 1.05 1.06
Interest rate risk
Interest Rate risk exposure arises when the change in the interest rates has the
potential to affect the numerical value of the assets and the liabilities, the operational ratios
are calculated. The following table determine the data of the National Bank of Australia for
the period of 12 years. The operational ratios basically are divided into the four categories
which are Net interest margin, return on assets, return on equity and cost to income ratio
(Drechsler, Savov & Schnabl, 2018).
NB
A 2017
201
6 2015 2014 2013
201
2 2011 2010
200
9 2008 2007 2006
⊘ This is a preview!⊘
Do you want full access?
Subscribe today to unlock all pages.
Trusted by 1+ million students worldwide

Running Head: INSTITUTIONAL ASSETS AND LIABILITIES
Net
interes
t
Margi
n
0.6
%
0.6
%
0.6
%
0.6
%
0.7
%
0.7
%
0.7
%
0.7
%
0.7
%
0.7
%
0.7
%
1.3
%
return
on
assets
0.7
%
0.0
%
0.7
%
0.6
%
0.7
%
0.5
%
0.7
%
0.6
%
0.4
%
0.5
%
1.0
%
1.1
%
Return
on
Equity
10.5
%
0.7
%
11.7
%
11.5
%
12.1
%
9.9
%
13.2
%
11.6
%
7.3
%
10.2
%
20.0
%
19.8
%
Cost
to
incom
e ratio 2.69
41.1
7 2.49 3.21 3.34
5.2
2 4.07 4.16
7.3
5 9.10 3.81 3.28
Operational Ratios
The net interest margin ratio is the measure of the difference between the interest
income generated either by the banks or the financial institutions and the amount of the
interest paid out to the lenders in relation to their interest earning asset. The net interest
margin helps in improving the assets of the banks and the structure and assessing the stability
and the efficiency of their operations. Besides this the interest margin of the ANZ Company
was 1.4% in the year 2006 and the 0.7% in the year 2017. The ratio was consistent for the
period of the 7 years as can be observed form the table. Analysing the situation of the
Westpac bank and the Commonwealth Bank of Australia, the net margins were almost similar
Paraphrase This Document
Need a fresh take? Get an instant paraphrase of this document with our AI Paraphraser

Running Head: INSTITUTIONAL ASSETS AND LIABILITIES
at 0.6% in comparison to each other. Therefore it can be interpreted that in terms of the Net
interest margin the NBA is performing better than among all the three banks (Hevert, 2014).
The return on assets of the National Bank of Australia was highest in the year 2006
at 1.3% and thereafter the ratio decreased to the range of the 0.5% to 0.7%. The return on
assets basically determines the ability of the company to use the assets and generate the
revenue for the company. The higher the return on assets the more efficient the company is
working. The ANZ bank on the other hand has improved its performance as it can be
reflected from the hike in the ratio of the 1.1% to 1.2% from the year 2006 to 2015.
Thereafter the bank reached back to square 1, on the same ratio on which it was in the year
2006. The CBA bank and the Westpac bank are on the same platform in terms of the return
on the assets and over the period of the 12 years the ratio remained in the range of the 0.9%
to 1.1% (Liang, et al 2016).
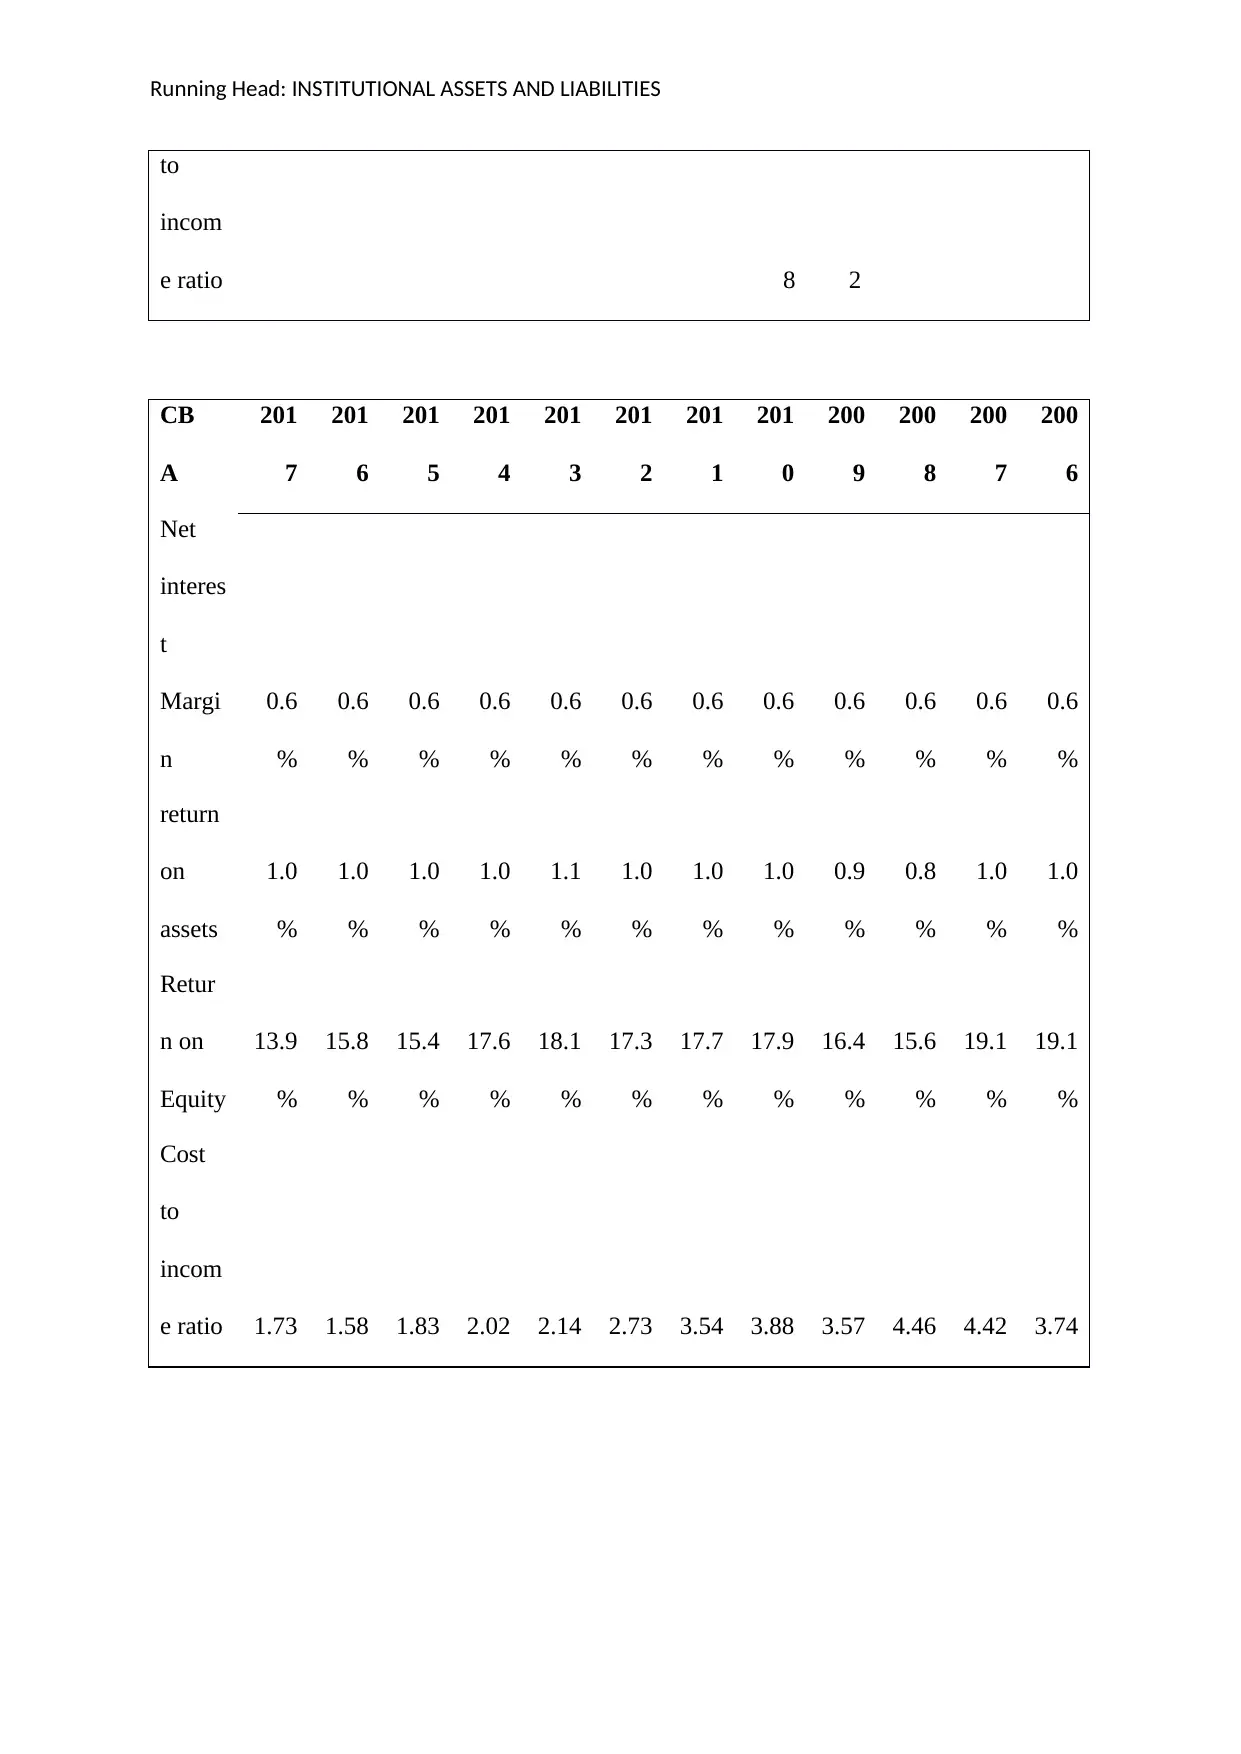
The return on equity is the ratio which determines the amount of equity that has
been invested in the organisation and the return on the equity received by the shareholder. In
case of the National Bank of Australia the return on equity was highest in the year 2007 at
19.97% and thereafter it decreased to 13.18% in the year 2011 and further it almost touched
the figure of 10.50% in the year 2017. The return on equity has been decreasing as can be
seen from the table and the major reason is that the bank has sold the shares and converted
into the liquid form. The return on equity of the ANZ bank has increased from 13% to 14.1%
over the period of the 12 years and is performing better than NBA. In case of the CBA and
the Westpac Bank the return on equity of the Westpac Bnak is better than the NBA; however
the ANZ bank is the most consistent. The CBA on the other hand has lost the position which
it was having in the year 2013 at 18.1% and thereafter it decreased and reached to 13.9% in
the year 2017 (Moreira, 2016). The same is explained by the graph also.
at 0.6% in comparison to each other. Therefore it can be interpreted that in terms of the Net
interest margin the NBA is performing better than among all the three banks (Hevert, 2014).
The return on assets of the National Bank of Australia was highest in the year 2006
at 1.3% and thereafter the ratio decreased to the range of the 0.5% to 0.7%. The return on
assets basically determines the ability of the company to use the assets and generate the
revenue for the company. The higher the return on assets the more efficient the company is
working. The ANZ bank on the other hand has improved its performance as it can be
reflected from the hike in the ratio of the 1.1% to 1.2% from the year 2006 to 2015.
Thereafter the bank reached back to square 1, on the same ratio on which it was in the year
2006. The CBA bank and the Westpac bank are on the same platform in terms of the return
on the assets and over the period of the 12 years the ratio remained in the range of the 0.9%
to 1.1% (Liang, et al 2016).
The return on equity is the ratio which determines the amount of equity that has
been invested in the organisation and the return on the equity received by the shareholder. In
case of the National Bank of Australia the return on equity was highest in the year 2007 at
19.97% and thereafter it decreased to 13.18% in the year 2011 and further it almost touched
the figure of 10.50% in the year 2017. The return on equity has been decreasing as can be
seen from the table and the major reason is that the bank has sold the shares and converted
into the liquid form. The return on equity of the ANZ bank has increased from 13% to 14.1%
over the period of the 12 years and is performing better than NBA. In case of the CBA and
the Westpac Bank the return on equity of the Westpac Bnak is better than the NBA; however
the ANZ bank is the most consistent. The CBA on the other hand has lost the position which
it was having in the year 2013 at 18.1% and thereafter it decreased and reached to 13.9% in
the year 2017 (Moreira, 2016). The same is explained by the graph also.

Running Head: INSTITUTIONAL ASSETS AND LIABILITIES
2017 2016 2015 2014 2013 2012 2011 2010 2009 2008 2007 2006
0.00%
0.20%
0.40%
0.60%
0.80%
1.00%
1.20%
1.40%
1.60%
1.80%
2.00%
NBA
ANZ
CBA
WESTPAC
(Source: by Author)
AN
Z 2017 2016 2015 2014 2013 2012 2011
201
0
200
9 2008 2007 2006
Net
interes
t
Margi
n
0.7
%
0.7
%
0.7
%
0.7
%
0.7
%
0.8
%
0.7
%
0.7
%
0.7
%
0.6
%
0.7
%
1.4
%
return
on
assets
1.1
%
1.0
%
1.2
%
1.3
%
1.1
%
1.1
%
0.9
%
0.7
%
0.3
%
0.9
%
1.1
%
1.1
%
Retur
n on
Equity
14.1
%
12.4
%
14.7
%
14.9
%
12.3
%
12.1
%
10.2
%
7.9
%
3.0
%
11.9
%
13.4
%
13.0
%
Cost 1.79 2.23 2.27 2.06 2.44 2.52 3.29 4.1 16.4 6.51 5.19 4.74
⊘ This is a preview!⊘
Do you want full access?
Subscribe today to unlock all pages.
Trusted by 1+ million students worldwide
Running Head: INSTITUTIONAL ASSETS AND LIABILITIES
to
incom
e ratio 8 2
CB
A
201
7
201
6
201
5
201
4
201
3
201
2
201
1
201
0
200
9
200
8
200
7
200
6
Net
interes
t
Margi
n
0.6
%
0.6
%
0.6
%
0.6
%
0.6
%
0.6
%
0.6
%
0.6
%
0.6
%
0.6
%
0.6
%
0.6
%
return
on
assets
1.0
%
1.0
%
1.0
%
1.0
%
1.1
%
1.0
%
1.0
%
1.0
%
0.9
%
0.8
%
1.0
%
1.0
%
Retur
n on
Equity
13.9
%
15.8
%
15.4
%
17.6
%
18.1
%
17.3
%
17.7
%
17.9
%
16.4
%
15.6
%
19.1
%
19.1
%
Cost
to
incom
e ratio 1.73 1.58 1.83 2.02 2.14 2.73 3.54 3.88 3.57 4.46 4.42 3.74
to
incom
e ratio 8 2
CB
A
201
7
201
6
201
5
201
4
201
3
201
2
201
1
201
0
200
9
200
8
200
7
200
6
Net
interes
t
Margi
n
0.6
%
0.6
%
0.6
%
0.6
%
0.6
%
0.6
%
0.6
%
0.6
%
0.6
%
0.6
%
0.6
%
0.6
%
return
on
assets
1.0
%
1.0
%
1.0
%
1.0
%
1.1
%
1.0
%
1.0
%
1.0
%
0.9
%
0.8
%
1.0
%
1.0
%
Retur
n on
Equity
13.9
%
15.8
%
15.4
%
17.6
%
18.1
%
17.3
%
17.7
%
17.9
%
16.4
%
15.6
%
19.1
%
19.1
%
Cost
to
incom
e ratio 1.73 1.58 1.83 2.02 2.14 2.73 3.54 3.88 3.57 4.46 4.42 3.74
Paraphrase This Document
Need a fresh take? Get an instant paraphrase of this document with our AI Paraphraser
Running Head: INSTITUTIONAL ASSETS AND LIABILITIES
2017
2016
2015
2014
2013
2012
2011
2010
2009
2008
2007
2006
0
5
10
15
20
25
30
35
40
45
Net interest Margin
return on assets
Return on Equity
Cost to income ratio
(Source: By Author)
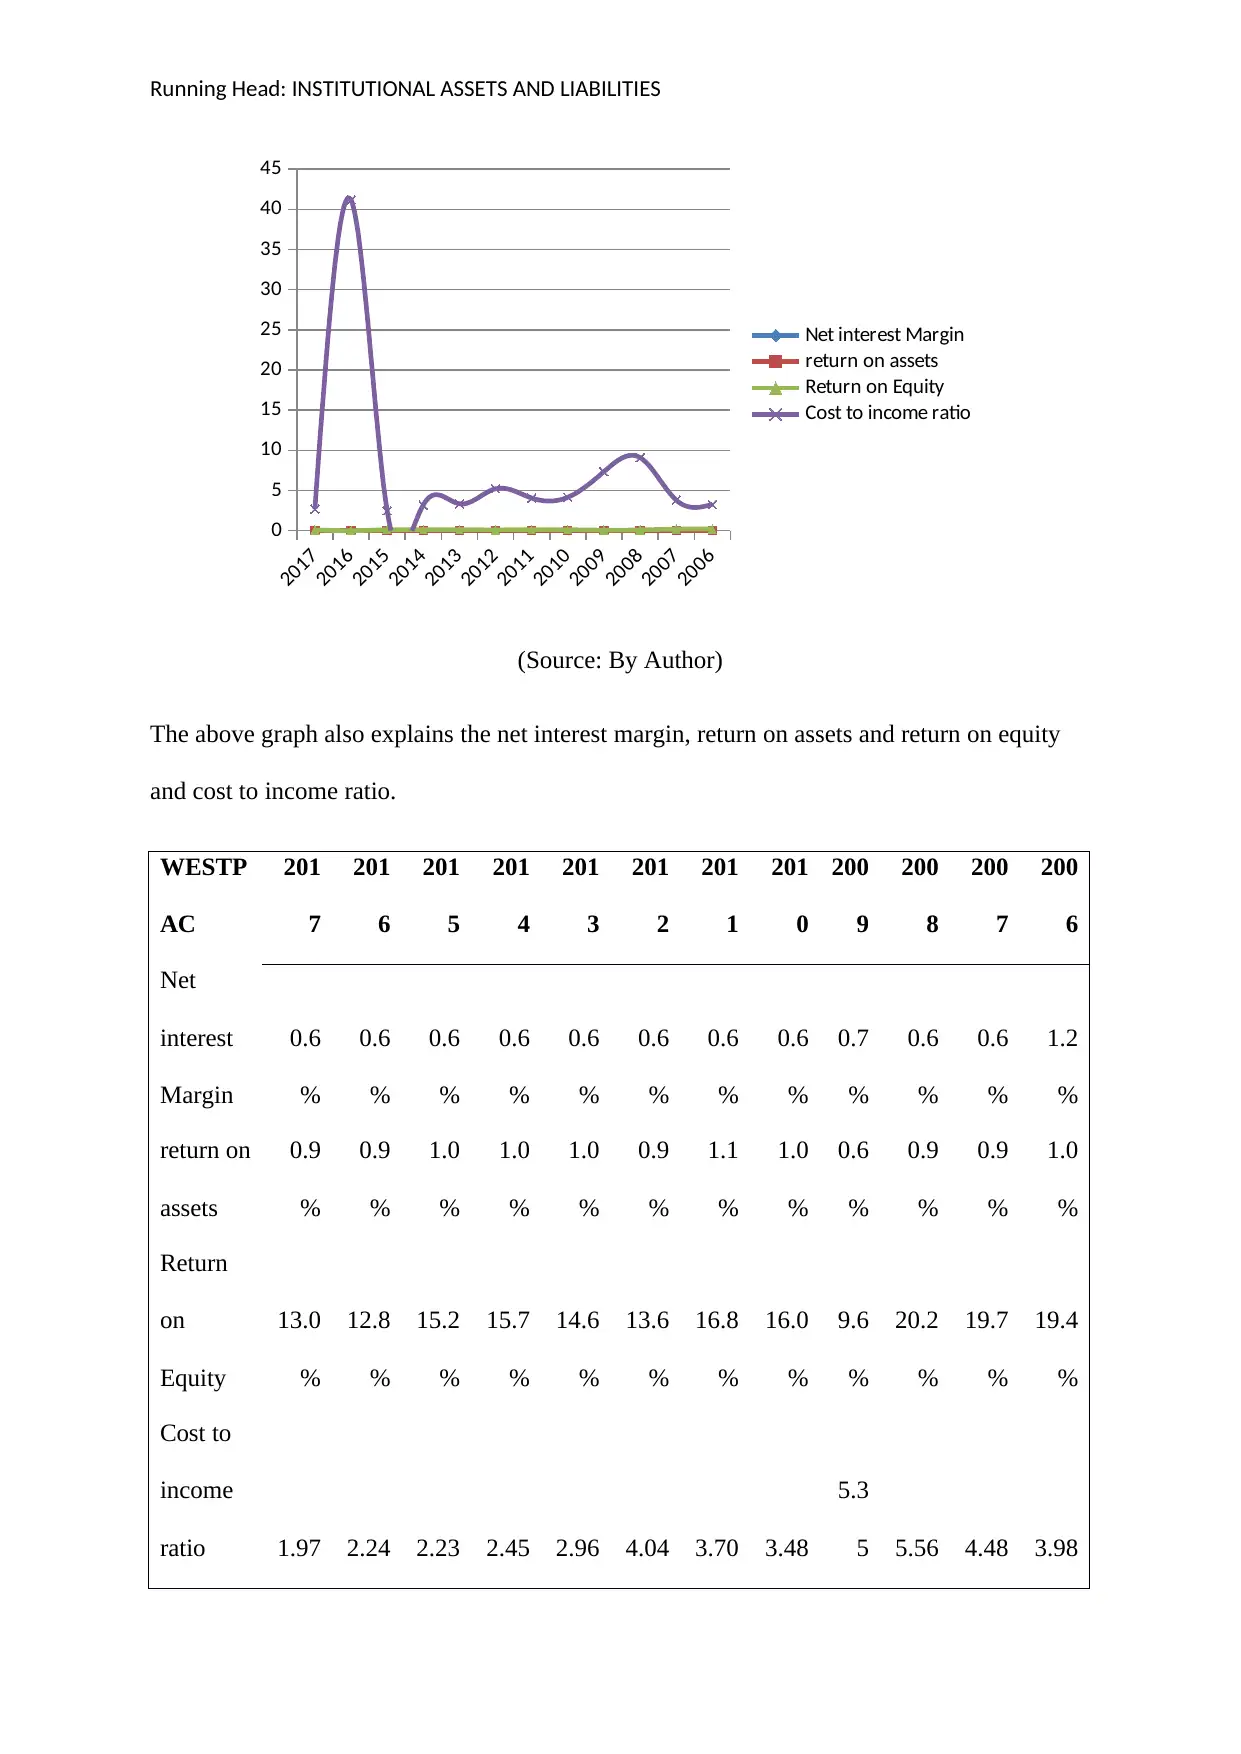
The above graph also explains the net interest margin, return on assets and return on equity
and cost to income ratio.
WESTP
AC
201
7
201
6
201
5
201
4
201
3
201
2
201
1
201
0
200
9
200
8
200
7
200
6
Net
interest
Margin
0.6
%
0.6
%
0.6
%
0.6
%
0.6
%
0.6
%
0.6
%
0.6
%
0.7
%
0.6
%
0.6
%
1.2
%
return on
assets
0.9
%
0.9
%
1.0
%
1.0
%
1.0
%
0.9
%
1.1
%
1.0
%
0.6
%
0.9
%
0.9
%
1.0
%
Return
on
Equity
13.0
%
12.8
%
15.2
%
15.7
%
14.6
%
13.6
%
16.8
%
16.0
%
9.6
%
20.2
%
19.7
%
19.4
%
Cost to
income
ratio 1.97 2.24 2.23 2.45 2.96 4.04 3.70 3.48
5.3
5 5.56 4.48 3.98
2017
2016
2015
2014
2013
2012
2011
2010
2009
2008
2007
2006
0
5
10
15
20
25
30
35
40
45
Net interest Margin
return on assets
Return on Equity
Cost to income ratio
(Source: By Author)
The above graph also explains the net interest margin, return on assets and return on equity
and cost to income ratio.
WESTP
AC
201
7
201
6
201
5
201
4
201
3
201
2
201
1
201
0
200
9
200
8
200
7
200
6
Net
interest
Margin
0.6
%
0.6
%
0.6
%
0.6
%
0.6
%
0.6
%
0.6
%
0.6
%
0.7
%
0.6
%
0.6
%
1.2
%
return on
assets
0.9
%
0.9
%
1.0
%
1.0
%
1.0
%
0.9
%
1.1
%
1.0
%
0.6
%
0.9
%
0.9
%
1.0
%
Return
on
Equity
13.0
%
12.8
%
15.2
%
15.7
%
14.6
%
13.6
%
16.8
%
16.0
%
9.6
%
20.2
%
19.7
%
19.4
%
Cost to
income
ratio 1.97 2.24 2.23 2.45 2.96 4.04 3.70 3.48
5.3
5 5.56 4.48 3.98

Running Head: INSTITUTIONAL ASSETS AND LIABILITIES
Liquidity Risk
Market risk is the risk of the losses and it determines the position of the bank in terms
of the market risk arising due to the fluctuations. The risk is further segregated into the
Equity risk, net loans risk and for the purpose of the ascertainment of this risk the liquidity
ratios are calculated.
Market Risk
Market Risk refers to the losses in the books of the banks due to the changes in the equity
prices the rate of interest and the commodity prices and other indicators having the current
value in the public market. The interest rate of the banks is 3.6% of the NAB, 2.30% of the
CBA, 4.85% of the ANZ and lastly in case of the Westpac the rate of interest came to 2.51%.
In terms of the equity prices the price of the Westpac is at $27.49 the NAB is $27.21 and that
of the CBA and the ANZ is $69.9 and 27.72 (Drechsler, Savov & Schnabl, 2018). The
highest range is of the CBA in terms of the equity price and in terms of the interest rate again
the CBA is having the highest bracket. Therefore it can be interpreted for the above
information that CBA is good in terms of the interest rate yet if the investor wishes to
purchase the stock is costly than the other three banks.
Liquidity ratios
The liquidity ratios of the bank generally determine the ability of the banks the short
term loans are made or not. The short term financial obligation is of greater concern to the
creditors. Therefore it is an important ratio in terms of the banks financial position. In case of
the banks the liquidity ratios are categorised into the interbank ratio, net loans to total asset
ratio (Heider, Hoerova & Holthausen, 2015).
⊘ This is a preview!⊘
Do you want full access?
Subscribe today to unlock all pages.
Trusted by 1+ million students worldwide
1 out of 23
Related Documents


Your All-in-One AI-Powered Toolkit for Academic Success.
+13062052269
info@desklib.com
Available 24*7 on WhatsApp / Email
![[object Object]](/_next/static/media/star-bottom.7253800d.svg)
Unlock your academic potential
Copyright © 2020–2026 A2Z Services. All Rights Reserved. Developed and managed by ZUCOL.