RMIT ECON1086: International Trade Assignment Report Analysis
VerifiedAdded on  2022/11/17
|8
|1265
|110
Report
AI Summary
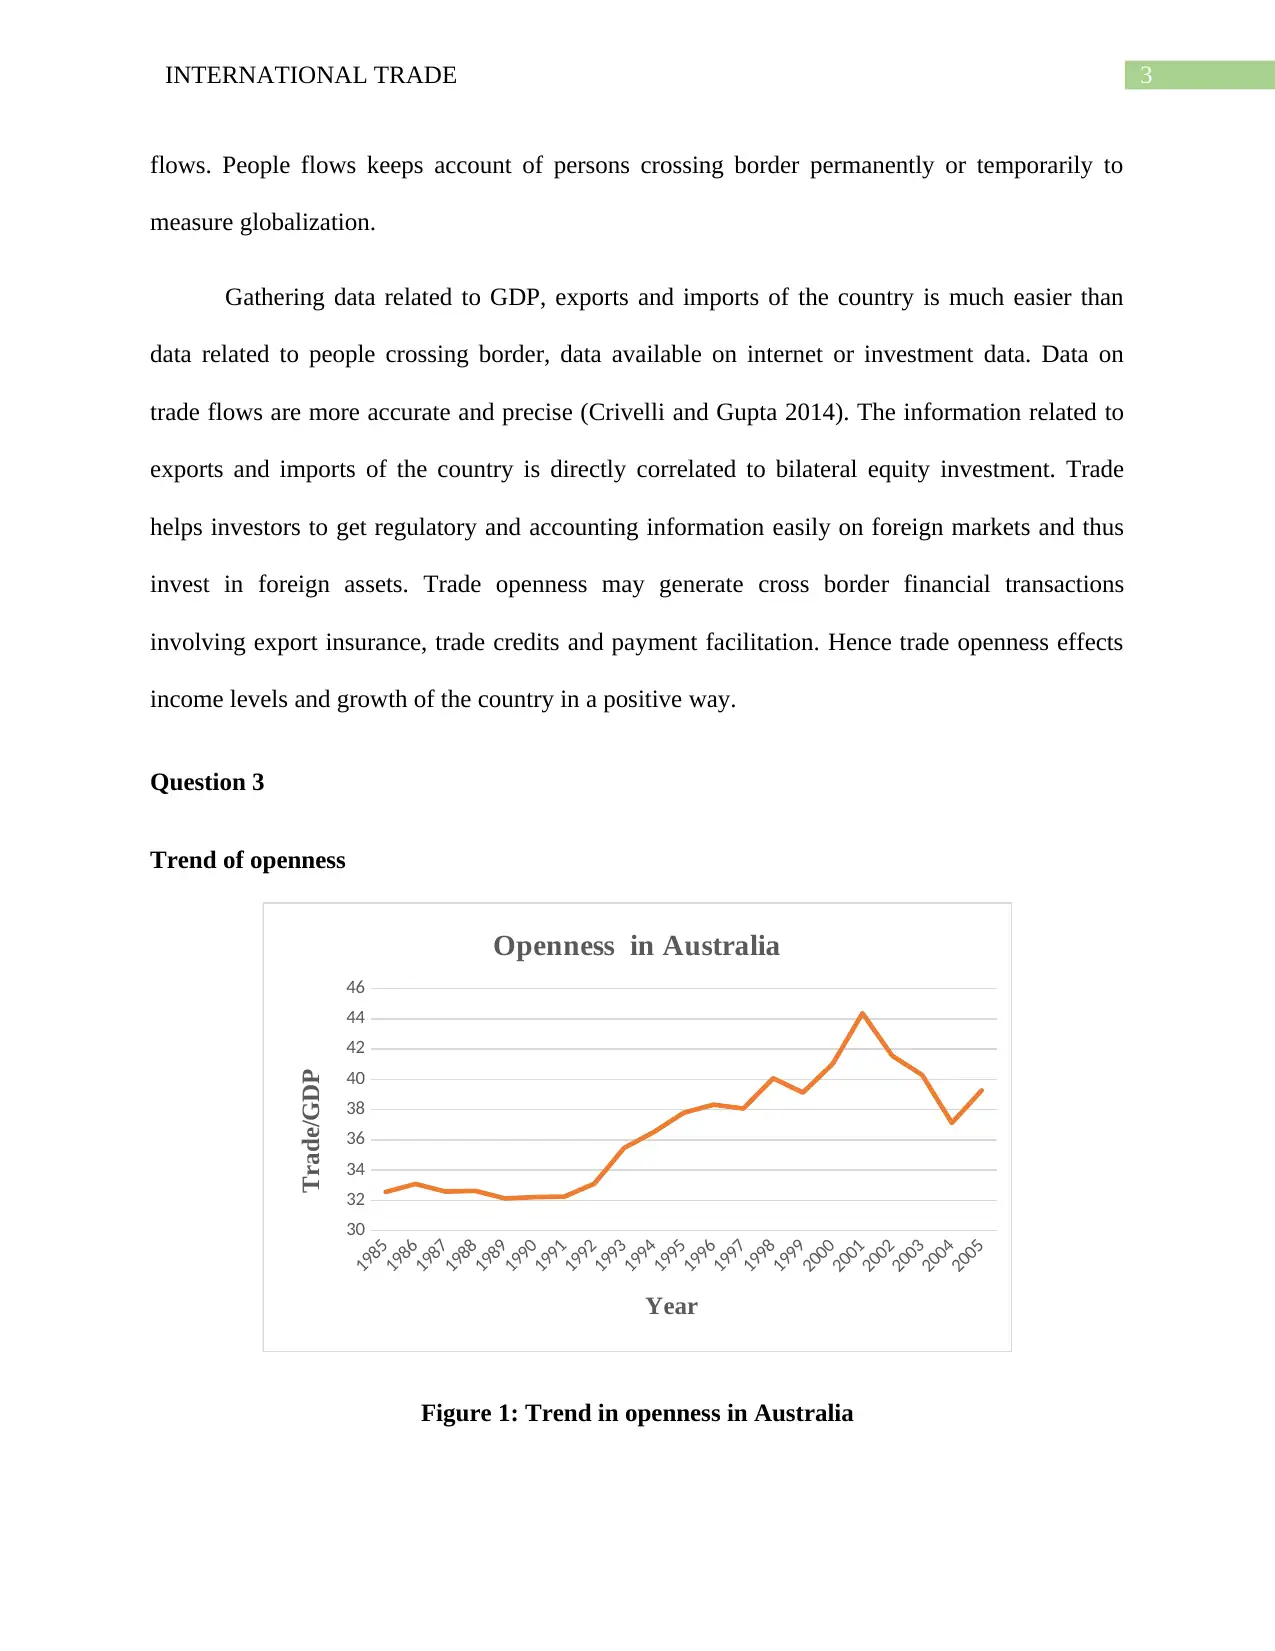
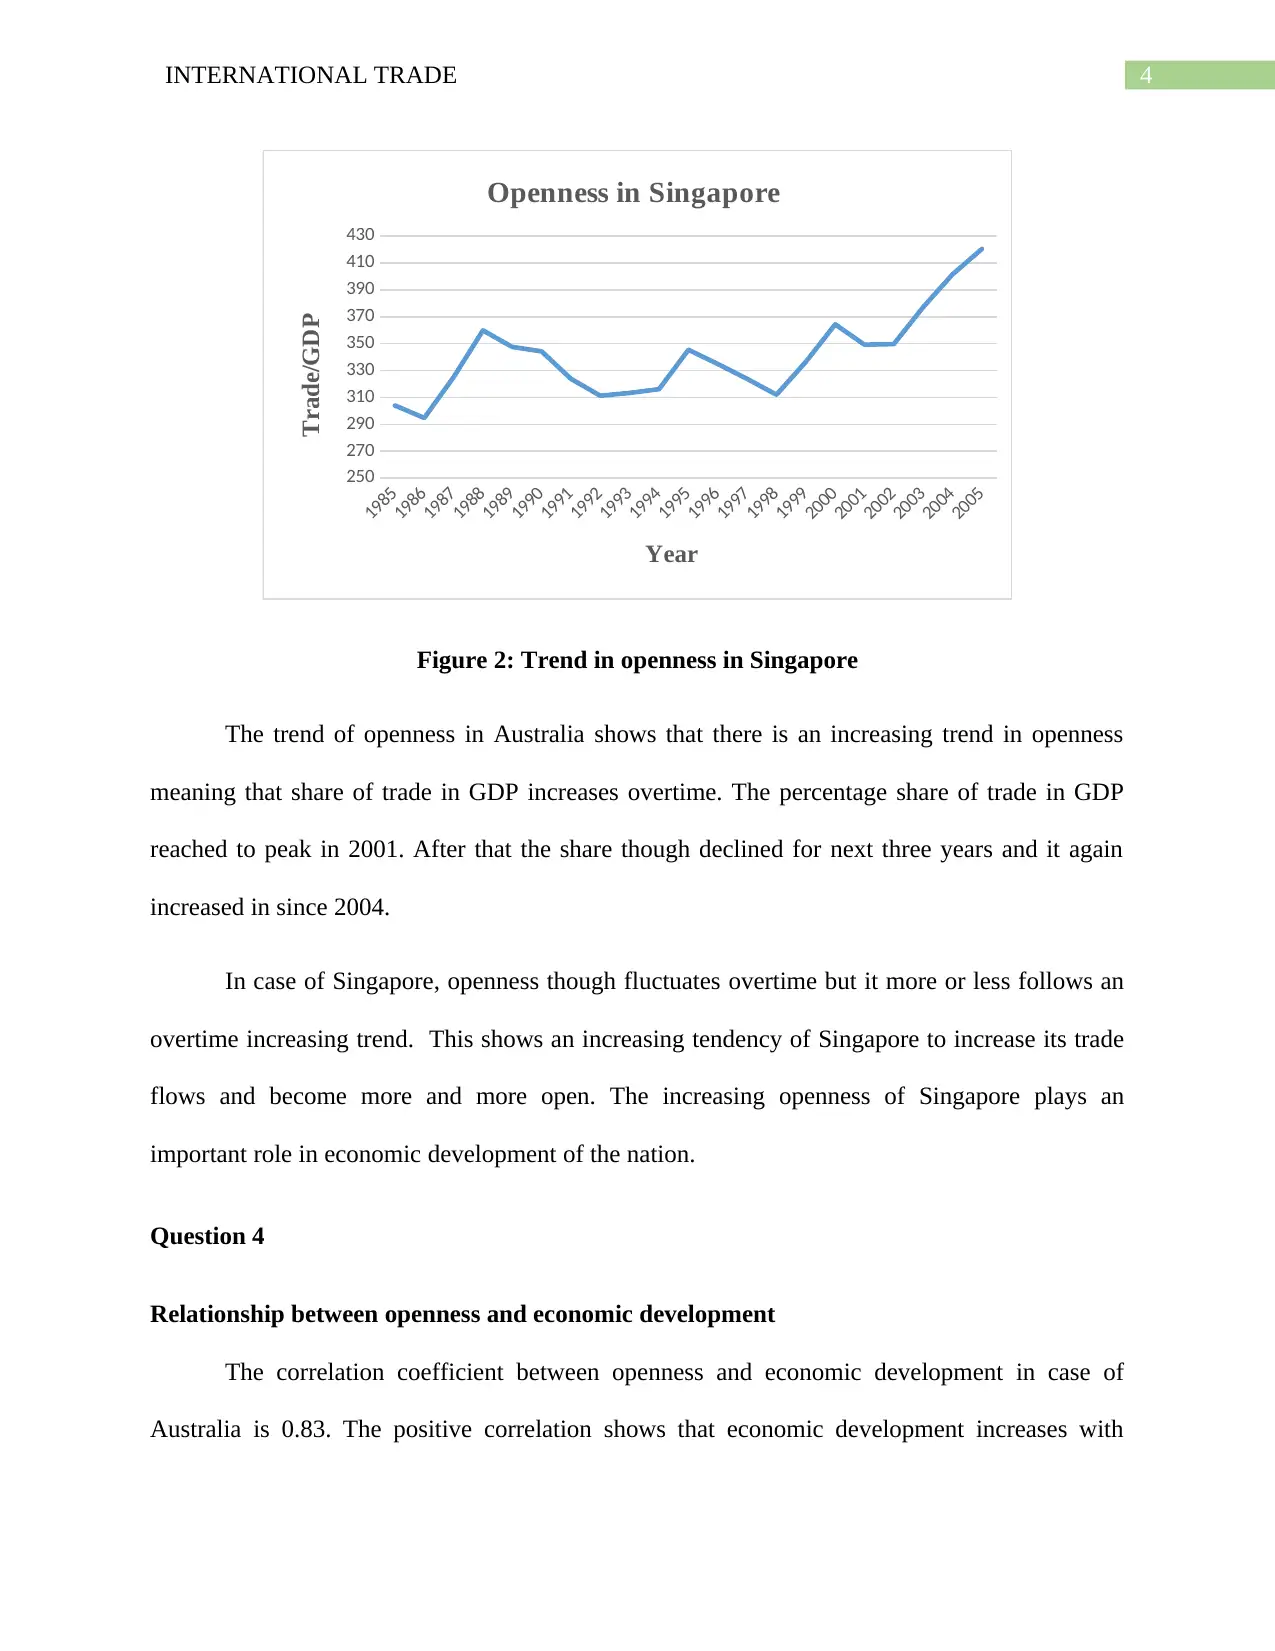
This report provides an analysis of international trade, focusing on the economic backgrounds of Australia and Singapore. It examines key economic indicators, including GDP per capita, and explores the measures and trends of globalization. The report investigates the relationship between trade openness and economic development, calculating correlation coefficients to assess the impact of globalization. Furthermore, it identifies and discusses the policies driving trade openness in both countries, drawing on data from 1985 to 2005. The analysis includes graphical representations of trade openness trends and provides insights into the factors influencing international trade dynamics and economic development.
Contribute Materials
Your contribution can guide someone’s learning journey. Share your
documents today.

Running head: INTERNATIONAL TRADE
International Trade
Name of the Student
Name of the University
Course ID
International Trade
Name of the Student
Name of the University
Course ID
Secure Best Marks with AI Grader
Need help grading? Try our AI Grader for instant feedback on your assignments.

1INTERNATIONAL TRADE
Table of Contents
Question 1........................................................................................................................................2
Economic background of Australia and Singapore.....................................................................2
Question 2........................................................................................................................................2
Measures of globalization............................................................................................................2
Question 3........................................................................................................................................3
Trend of openness........................................................................................................................3
Question 4........................................................................................................................................4
Relationship between openness and economic development......................................................4
Question 5........................................................................................................................................5
Policies driving openness in Australia and Singapore.................................................................5
Reference List..................................................................................................................................7

2INTERNATIONAL TRADE
Question 1
Economic background of Australia and Singapore
The GDP per capita (constant 2010 US$) of Australia has an increasing trend over the
period of 1985-2005. The GDP per capita was recorded at $47,926.7 in 2004 and it increased to
$48,813.9 in 2005. Australia is the largest country of continent Oceania, comprising the islands
of Tasmania, mainland of Australian continent and many smaller islands (Rodan 2016). Australia
exports iron ore, gold, natural gas, coal, beef, aluminium, crude petroleum, wheat and meat. It is
richest country of the world with higher GDP.
The GDP per capita of Singapore witnessed an uptrend from 1985 - 2005. It was recorded
at $38,619.9 in 2004 and hiked to $40,498.7 in 2005 (Hatzvi, Nixon and Wright 2014).
Singapore is situated in Southeast Asia, south of Peninsular Malaysia, north of equator and
across the Strait of Malacca and east of Indonesia. Singapore exports electronics and
telecommunications, machinery and equipment, other chemicals and pharmaceuticals, food,
refined petroleum products and beverages. With a higher GDP, it is richest country of the world.
Question 2
Measures of globalization
Trade openness is used to measure the openness of an economy to international trade.
The trade to GDP ratio is an indicator of the degree of economic globalisation. There are various
measures to track the slowdown and progress of globalization. These are investment flows, trade
flows, information flows and people flows. Investment flows used to measure direct capital and
portfolio investment of the particular country (Martens et al. 2015). Data available on internet
network and cross border information helps to determine globalisation is called information

3INTERNATIONAL TRADE
flows. People flows keeps account of persons crossing border permanently or temporarily to
measure globalization.
Gathering data related to GDP, exports and imports of the country is much easier than
data related to people crossing border, data available on internet or investment data. Data on
trade flows are more accurate and precise (Crivelli and Gupta 2014). The information related to
exports and imports of the country is directly correlated to bilateral equity investment. Trade
helps investors to get regulatory and accounting information easily on foreign markets and thus
invest in foreign assets. Trade openness may generate cross border financial transactions
involving export insurance, trade credits and payment facilitation. Hence trade openness effects
income levels and growth of the country in a positive way.
Question 3
Trend of openness
1985
1986
1987
1988
1989
1990
1991
1992
1993
1994
1995
1996
1997
1998
1999
2000
2001
2002
2003
2004
2005
30
32
34
36
38
40
42
44
46
Openness in Australia
Year
Trade/GDP
Figure 1: Trend in openness in Australia
Secure Best Marks with AI Grader
Need help grading? Try our AI Grader for instant feedback on your assignments.

4INTERNATIONAL TRADE
1985
1986
1987
1988
1989
1990
1991
1992
1993
1994
1995
1996
1997
1998
1999
2000
2001
2002
2003
2004
2005
250
270
290
310
330
350
370
390
410
430
Openness in Singapore
Year
Trade/GDP
Figure 2: Trend in openness in Singapore
The trend of openness in Australia shows that there is an increasing trend in openness
meaning that share of trade in GDP increases overtime. The percentage share of trade in GDP
reached to peak in 2001. After that the share though declined for next three years and it again
increased in since 2004.
In case of Singapore, openness though fluctuates overtime but it more or less follows an
overtime increasing trend. This shows an increasing tendency of Singapore to increase its trade
flows and become more and more open. The increasing openness of Singapore plays an
important role in economic development of the nation.
Question 4
Relationship between openness and economic development
The correlation coefficient between openness and economic development in case of
Australia is 0.83. The positive correlation shows that economic development increases with

5INTERNATIONAL TRADE
increase in openness meaning that globalization is beneficial for economic development of
Australia. The correlation coefficient closer to 1 meaning a strong relation between trade share in
GDP and that of per capita GDP. For Singapore, the computed correlation coefficient is 0.70.
The positive correlation again suggests a direct relation between openness and economic
development. That means increasing openness is beneficial for economic development of the
nation. The correlation coefficient in case of Singapore though is less than that of Australia but is
still closer to 1 meaning a strong positive association between economic development and
openness.
Question 5
Policies driving openness in Australia and Singapore
Australia and Singapore have high per capita GDP and trade exposers which encourage
trade openness in both countries. The major factor that influence openness is the internal demand
of goods and services with respect to production capacity of goods and services within the
country. Advancement of technology plays an important role in trade openness of the country.
The domestic political power is also an important determinant of trade openness (De Nicolo and
Juvenal 2014). These factors encourage exports and imports between two countries.
The domestic policy can be classified as any type of subsidy policy or domestic tax or
government regulations applied that affects the consumers or producers. Some form of domestic
policies which, affects openness are income taxes on individual incomes and wages, sales tax
levied on retail sales, profit taxes levied on business profits, and excise taxes on some particular
products. Subsidies provided by governments for research and developments, education and

6INTERNATIONAL TRADE
agriculture influences trade openness. Therefore, the expansion or compression of trade is
directly affected by domestic policy of the country.
Over the period of 1960-2007 Australia witnessed a commodity price shocks in both long
run and short run. In short run, it mainly affected mining and wool industries not agricultural
products (Deng and Yang 2015). Sustained increase in price reduced inequality in renewables
like wool whereas inequality increased in case of non-renewables like minerals. The low price of
food and international oil affected many commodity exporters of Singapore. Reduced producer
prices has a negative impact on overall commodity production of the country.
Paraphrase This Document
Need a fresh take? Get an instant paraphrase of this document with our AI Paraphraser

7INTERNATIONAL TRADE
Reference List
Crivelli, E. and Gupta, S., 2014. Resource blessing, revenue curse? Domestic revenue effort in
resource-rich countries. European Journal of Political Economy, 35, pp.88-101.
De Nicolò, G. and Juvenal, L., 2014. Financial integration, globalization, and real activity.
Journal of financial stability, 10, pp.65-75.
Deng, P. and Yang, M., 2015. Cross-border mergers and acquisitions by emerging market firms:
A comparative investigation. International Business Review, 24(1), pp.157-172.
Hatzvi, E., Nixon, W. and Wright, M., 2014. The offshore renminbi market and Australia. RBA
Bulletin, December, pp.53-62.
Martens, P., Caselli, M., De Lombaerde, P., Figge, L. and Scholte, J.A., 2015. New directions in
globalization indices. Globalizations, 12(2), pp.217-228.
Rodan, G., 2016. The political economy of Singapore's industrialization: national state and
international capital. Springer.
1 out of 8
Related Documents

Your All-in-One AI-Powered Toolkit for Academic Success.
 +13062052269
info@desklib.com
Available 24*7 on WhatsApp / Email
Unlock your academic potential
© 2024  |  Zucol Services PVT LTD  |  All rights reserved.