Sainsburys Plc Financial Performance and Recommendations Report
VerifiedAdded on 2022/08/25
|15
|2240
|19
Report
AI Summary
This report presents a financial analysis of Sainsburys Plc, examining its performance and financial position over a five-year period. The analysis includes key financial ratios such as gross profit margin, liquidity, efficiency, gearing, and administrative expenses. The report compares Sainsburys' performance to Tesco's in some areas. The findings indicate increasing gross profit margins, fluctuating liquidity, fluctuating cash cycle days, fluctuating gearing ratios, and increasing administrative expenses. The report provides specific recommendations for the board of directors, including minimizing operational costs, improving short-term asset management, reducing cash conversion cycle time, reducing debt usage, and controlling administrative expenses. The report aims to provide insights into Sainsburys Plc's financial health and suggest areas for improvement.
QUESTION 1-
Prepare a business report, 6 pages long (+/- 10%), to the board of directors of Sainsburys Plc with tables
and graphs that analyse the performance and financial position over at least 5 financial years and
recommend actions that the board should take.
To: The Board of Directors of Sainsburys Plc
From:
Date:
Title: Financial analysis of Sainsburys Plc.
Introduction
The tools of financial analysis can be useful in assessment of the entity’s trends and performance
of the business operations. Financial analysis is aspect of the overall finance function of business, which
is consists of examining historical data for gaining information about future and current health of
company. The application of financial analysis is done in wide variety of the circumstances for giving
business managers information they require for making critical decisions. The ability for understanding
financial data is vital for any of the business manager. Finance is considered to be the business
language. The objectives and goals of business are set in the financial terms and outcomes are
measured in the financial terms (Baka 2018). Hence, this report aims to analyse financial position and
performance over five financial years of Sainsburys Plc. Further, recommendation of actions will be
given to board based on the analysis.
1
Paraphrase This Document
Need a fresh take? Get an instant paraphrase of this document with our AI Paraphraser
Sainsbury Plc is the company that is based in United Kingdom. It is principally engaged in
financial services and grocery and the related services. This company operates Sainsbury supermarkets,
internet-based home delivery services, convenience stores and the Sainsbury bank. This bank offers
credit cards, saving accounts, insurance products, mortgages and consumer loans
(About.sainsburys.co.uk. 2020).
Profitability:
The ratios of Profitability measures overall performance of entity in the terms of total generated
revenue from its business operations. Further, calculation of gross profit margin ratio is done for
analysing profitability of company. The gross profit margin ratio is the metric used for assessing
company’s financial health. It shows efficiency with which entity can generate revenue from sale of its
merchandise and inventories. The cost of manufacturing is consisting of manufacturing expenses,
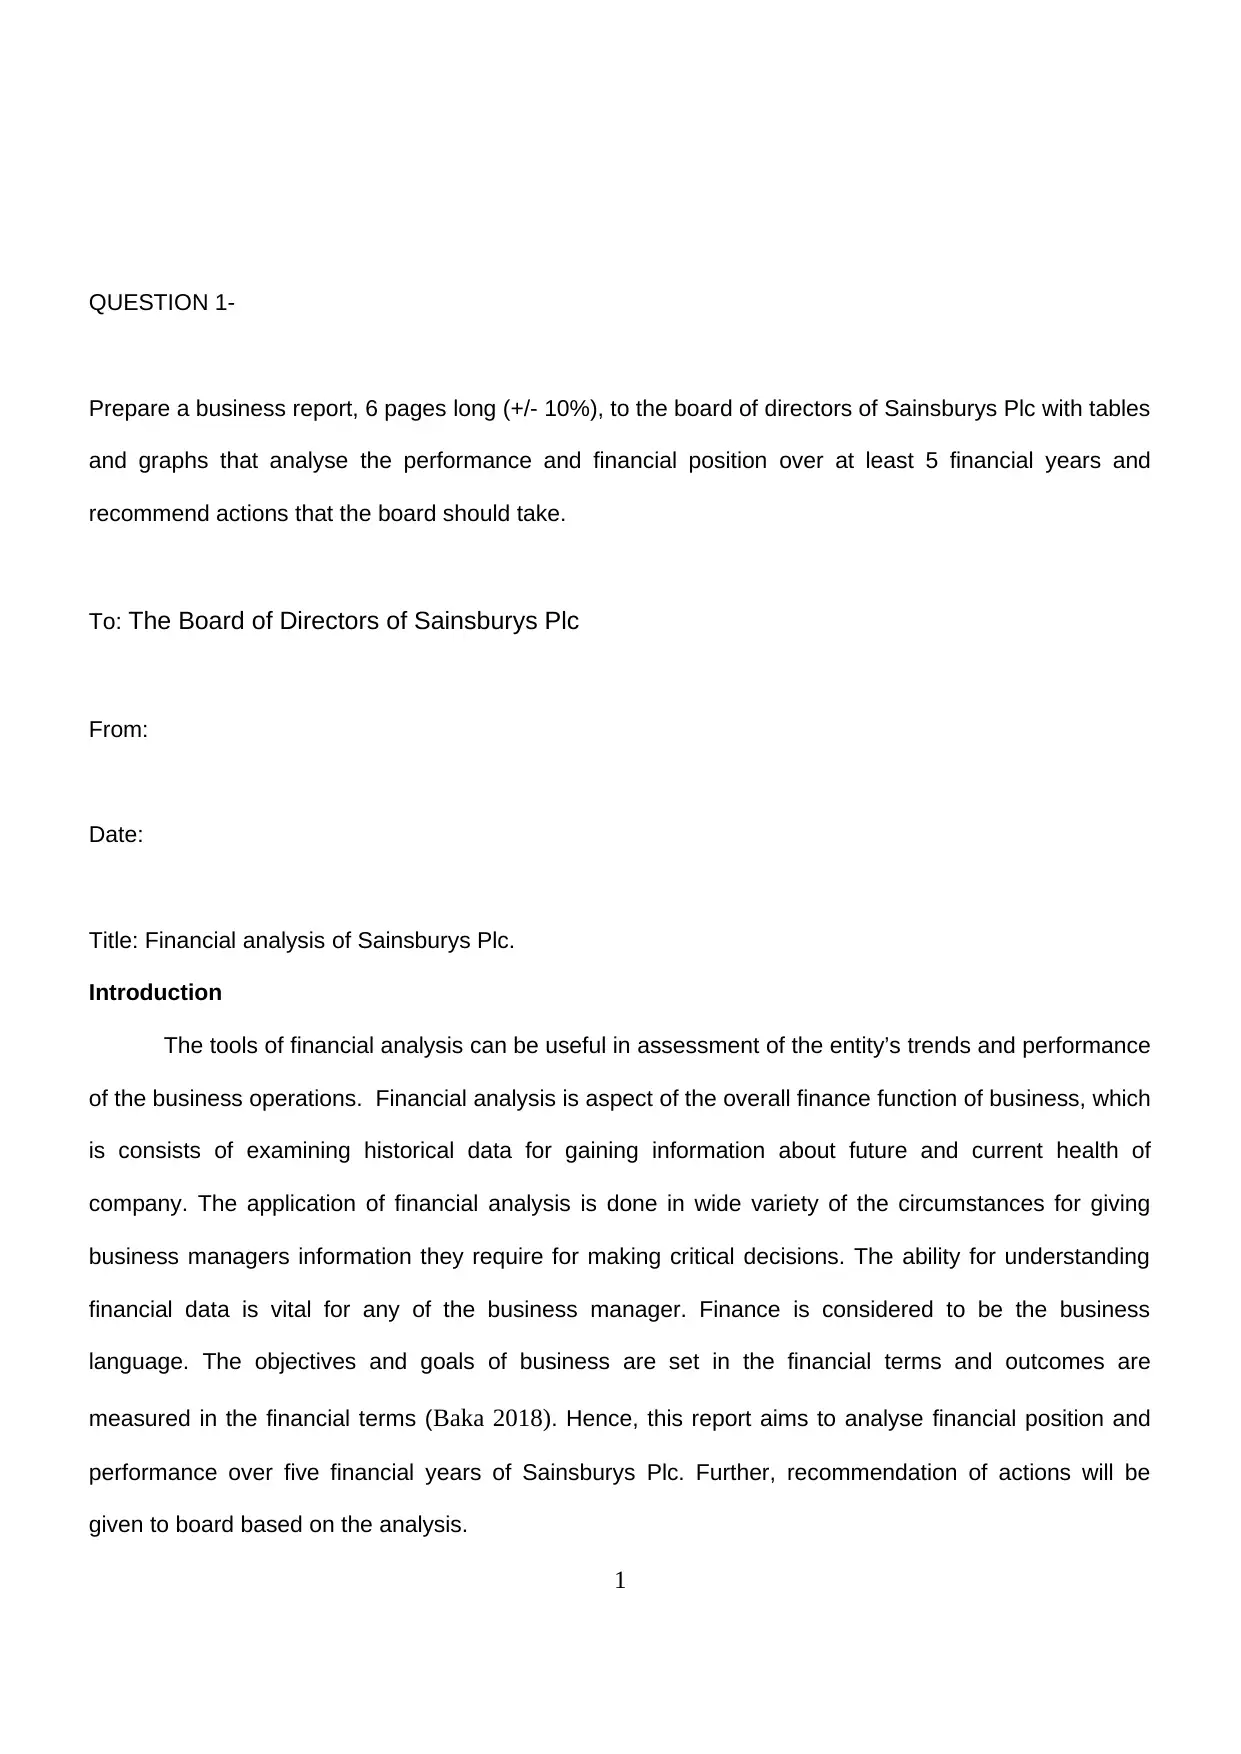
employees’ benefits costs and material costs (Dahmen and Rodríguez 2014). The graph below shows
gross profit margin of two companies, Sainsbury and Tesco.
2013 2014 2015 2016 2017 2018 2019
-4.00%
-2.00%
0.00%
2.00%
4.00%
6.00%
8.00%
5.48% 5.79%
5.08%
6.19% 6.23%
6.61% 6.92%
6.31% 6.31%
-3.39%
5.24% 5.19%
5.83%
6.48%
Gross Profit Sainsbury
Tesco
As it can be seen in graph that gross profit margin ratio of Sainsbury in 2013 was 5.48%, in 2014
was 5.79%, in 2015 was 5.08%, in 2016 was 6.19%, in 2017 was 6.23%, in 2018 was 6.61% and in
2019 was 6.92%. The figure shows that the efficiency of company in generating revenues from sale of its
2
financial services and grocery and the related services. This company operates Sainsbury supermarkets,
internet-based home delivery services, convenience stores and the Sainsbury bank. This bank offers
credit cards, saving accounts, insurance products, mortgages and consumer loans
(About.sainsburys.co.uk. 2020).
Profitability:
The ratios of Profitability measures overall performance of entity in the terms of total generated
revenue from its business operations. Further, calculation of gross profit margin ratio is done for
analysing profitability of company. The gross profit margin ratio is the metric used for assessing
company’s financial health. It shows efficiency with which entity can generate revenue from sale of its
merchandise and inventories. The cost of manufacturing is consisting of manufacturing expenses,
employees’ benefits costs and material costs (Dahmen and Rodríguez 2014). The graph below shows
gross profit margin of two companies, Sainsbury and Tesco.
2013 2014 2015 2016 2017 2018 2019
-4.00%
-2.00%
0.00%
2.00%
4.00%
6.00%
8.00%
5.48% 5.79%
5.08%
6.19% 6.23%
6.61% 6.92%
6.31% 6.31%
-3.39%
5.24% 5.19%
5.83%
6.48%
Gross Profit Sainsbury
Tesco
As it can be seen in graph that gross profit margin ratio of Sainsbury in 2013 was 5.48%, in 2014
was 5.79%, in 2015 was 5.08%, in 2016 was 6.19%, in 2017 was 6.23%, in 2018 was 6.61% and in
2019 was 6.92%. The figure shows that the efficiency of company in generating revenues from sale of its
2
merchandise and inventories has been increasing over years. This means that company is able to
control its manufacturing costs (Zietlow et al. 2018). Further, in case of Tesco, the gross profit margin
was) 6.31% in 2013, 6.31% in 2014, 3.39% in 2015, 5.24% in 2016, 5.19% in 2017, 5.83% in 2018 and
6.48% in 2019. The trend of company shows that company’s gross profit margin has been quite
fluctuating. In the initial years, the gross profit margin has been decreased. However, later abilities of
company in generating revenue from its inventories and merchandise sale has been increased. After
comparison between both the years, it can be said that Sainsbury Plc is performing more stable than that
of Tesco (EL BOUAZZI, BOUAYAD and ROUGGANI 2017).
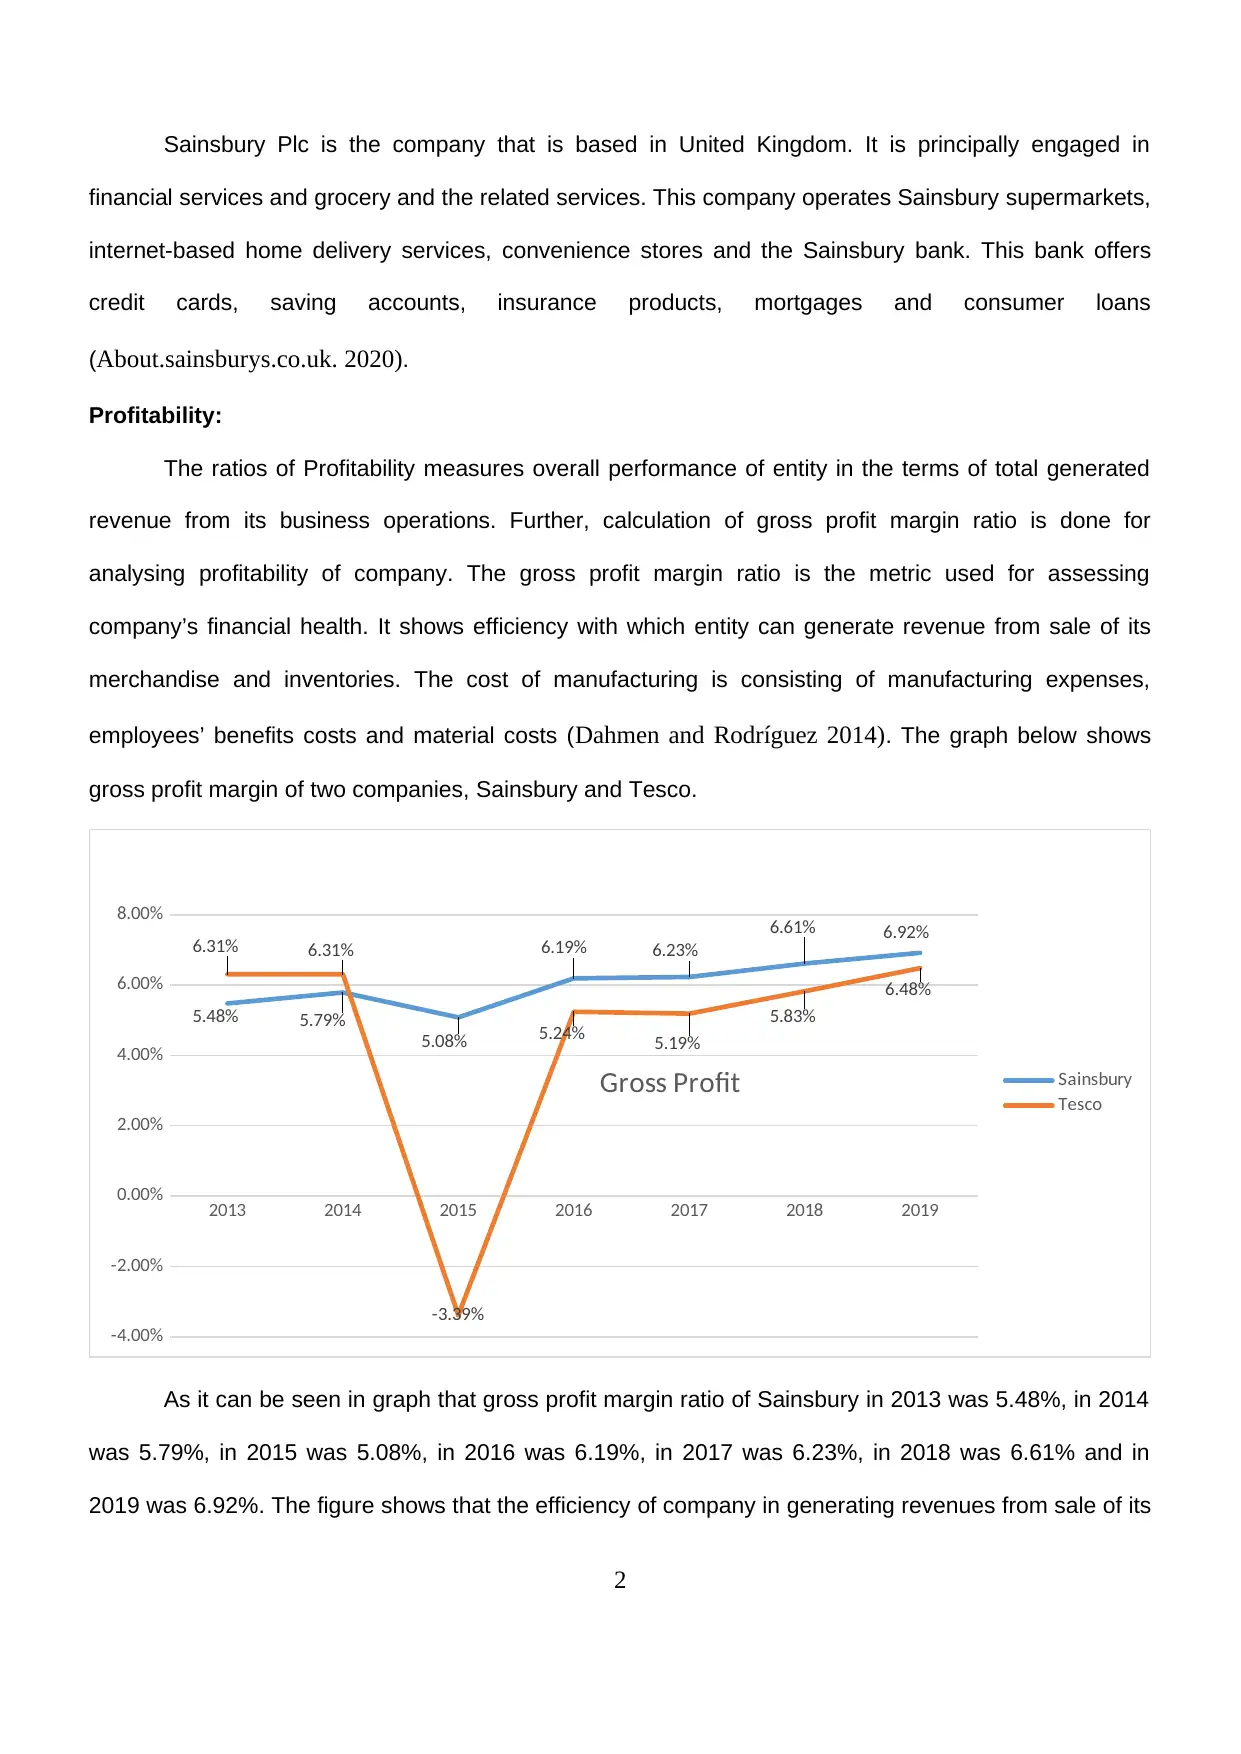
Liquidity:
Liquidity ratios are key class of the financial metric that is used for determining ability of debtor for
paying off current debt obligations without raising any kind of external capital.
2013 2014 2015 2016 2017 2018 2019
0.00
0.20
0.40
0.60
0.80
1.00
1.20
0.30
0.50 0.51 0.52 0.53 0.59
0.500.49 0.44 0.45
0.63 0.68
0.60
0.49
1 1 1 1 1 1 1
Liquidity Ratio
Sainsbury Tesco Theoritical Ideal
The liquidity ratio of Sainsbury was 0.30 in 2013, 0.50 in 2014, 0.51 in 2015, 0.52 in 2016, 0.53 in
2017, 0.60 in 2018 and 0.50 in 2019. The trend of liquidity ratio of Sainsbury Plc indicates that
company’s ability for paying its debts of short-term has been increased over years, but it got declined in
2019. It shows that company is not able for meeting its debt obligations of short-term (Williams and
Dobelman 2017). Further, the liquidity ratio of Tesco was 0.49 in 2013, 0.44 in 2014, 0.45 in 2015, 0.63
3
control its manufacturing costs (Zietlow et al. 2018). Further, in case of Tesco, the gross profit margin
was) 6.31% in 2013, 6.31% in 2014, 3.39% in 2015, 5.24% in 2016, 5.19% in 2017, 5.83% in 2018 and
6.48% in 2019. The trend of company shows that company’s gross profit margin has been quite
fluctuating. In the initial years, the gross profit margin has been decreased. However, later abilities of
company in generating revenue from its inventories and merchandise sale has been increased. After
comparison between both the years, it can be said that Sainsbury Plc is performing more stable than that
of Tesco (EL BOUAZZI, BOUAYAD and ROUGGANI 2017).
Liquidity:
Liquidity ratios are key class of the financial metric that is used for determining ability of debtor for
paying off current debt obligations without raising any kind of external capital.
2013 2014 2015 2016 2017 2018 2019
0.00
0.20
0.40
0.60
0.80
1.00
1.20
0.30
0.50 0.51 0.52 0.53 0.59
0.500.49 0.44 0.45
0.63 0.68
0.60
0.49
1 1 1 1 1 1 1
Liquidity Ratio
Sainsbury Tesco Theoritical Ideal
The liquidity ratio of Sainsbury was 0.30 in 2013, 0.50 in 2014, 0.51 in 2015, 0.52 in 2016, 0.53 in
2017, 0.60 in 2018 and 0.50 in 2019. The trend of liquidity ratio of Sainsbury Plc indicates that
company’s ability for paying its debts of short-term has been increased over years, but it got declined in
2019. It shows that company is not able for meeting its debt obligations of short-term (Williams and
Dobelman 2017). Further, the liquidity ratio of Tesco was 0.49 in 2013, 0.44 in 2014, 0.45 in 2015, 0.63
3
⊘ This is a preview!⊘
Do you want full access?
Subscribe today to unlock all pages.
Trusted by 1+ million students worldwide
in 2016, 0.68 in 2017, 0.60 in 2018 and 0.50 in 2019. Hence, the trend of liquidity ratio of Tesco indicates
that company’s position for paying its obligations of short-term from its short-term assets have been
fluctuating over years, such as it decreased then increased and again it decreased. Tesco is not capable
to pay its short-term obligations from short-term assets. Therefore, liquidity position of both entity is not
good, as they are not able for meeting their short-term obligations (Khan and Jain 2018).
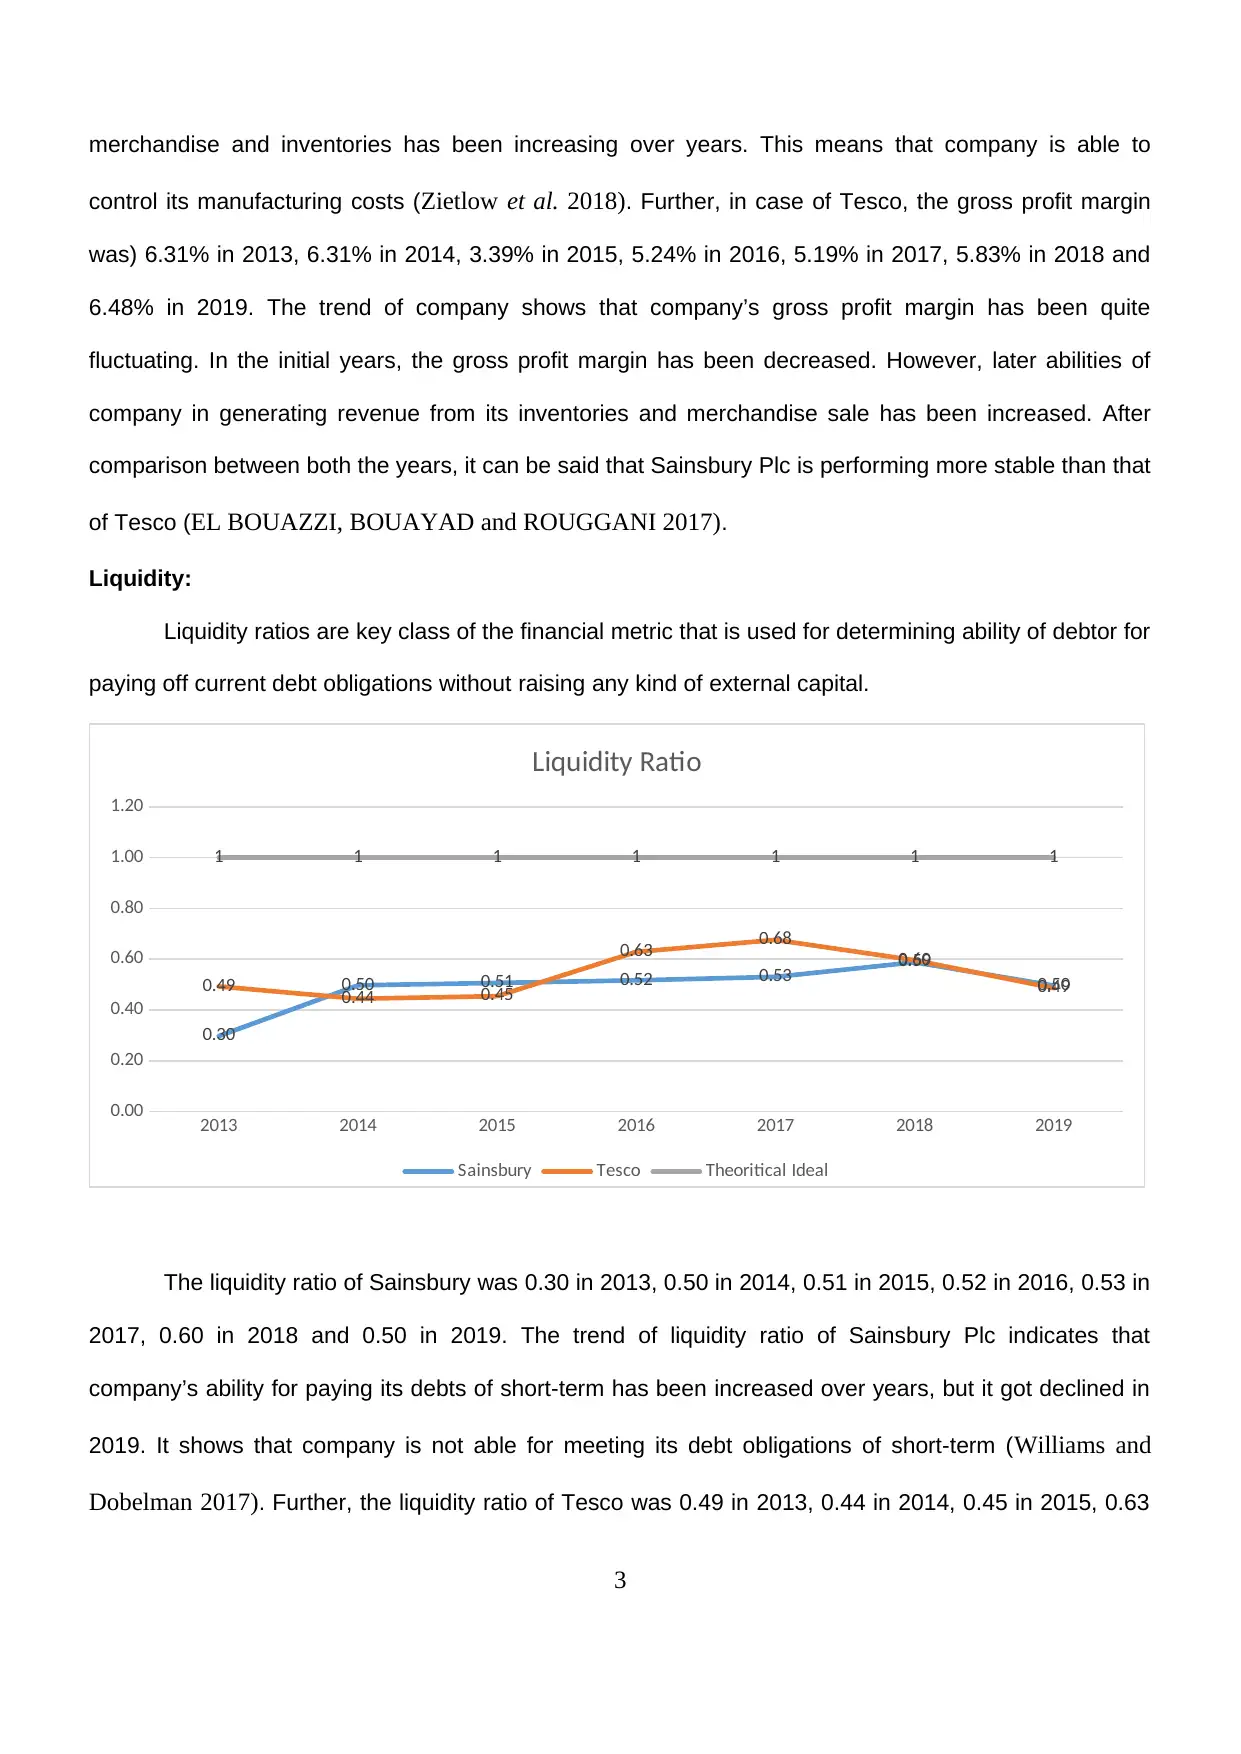
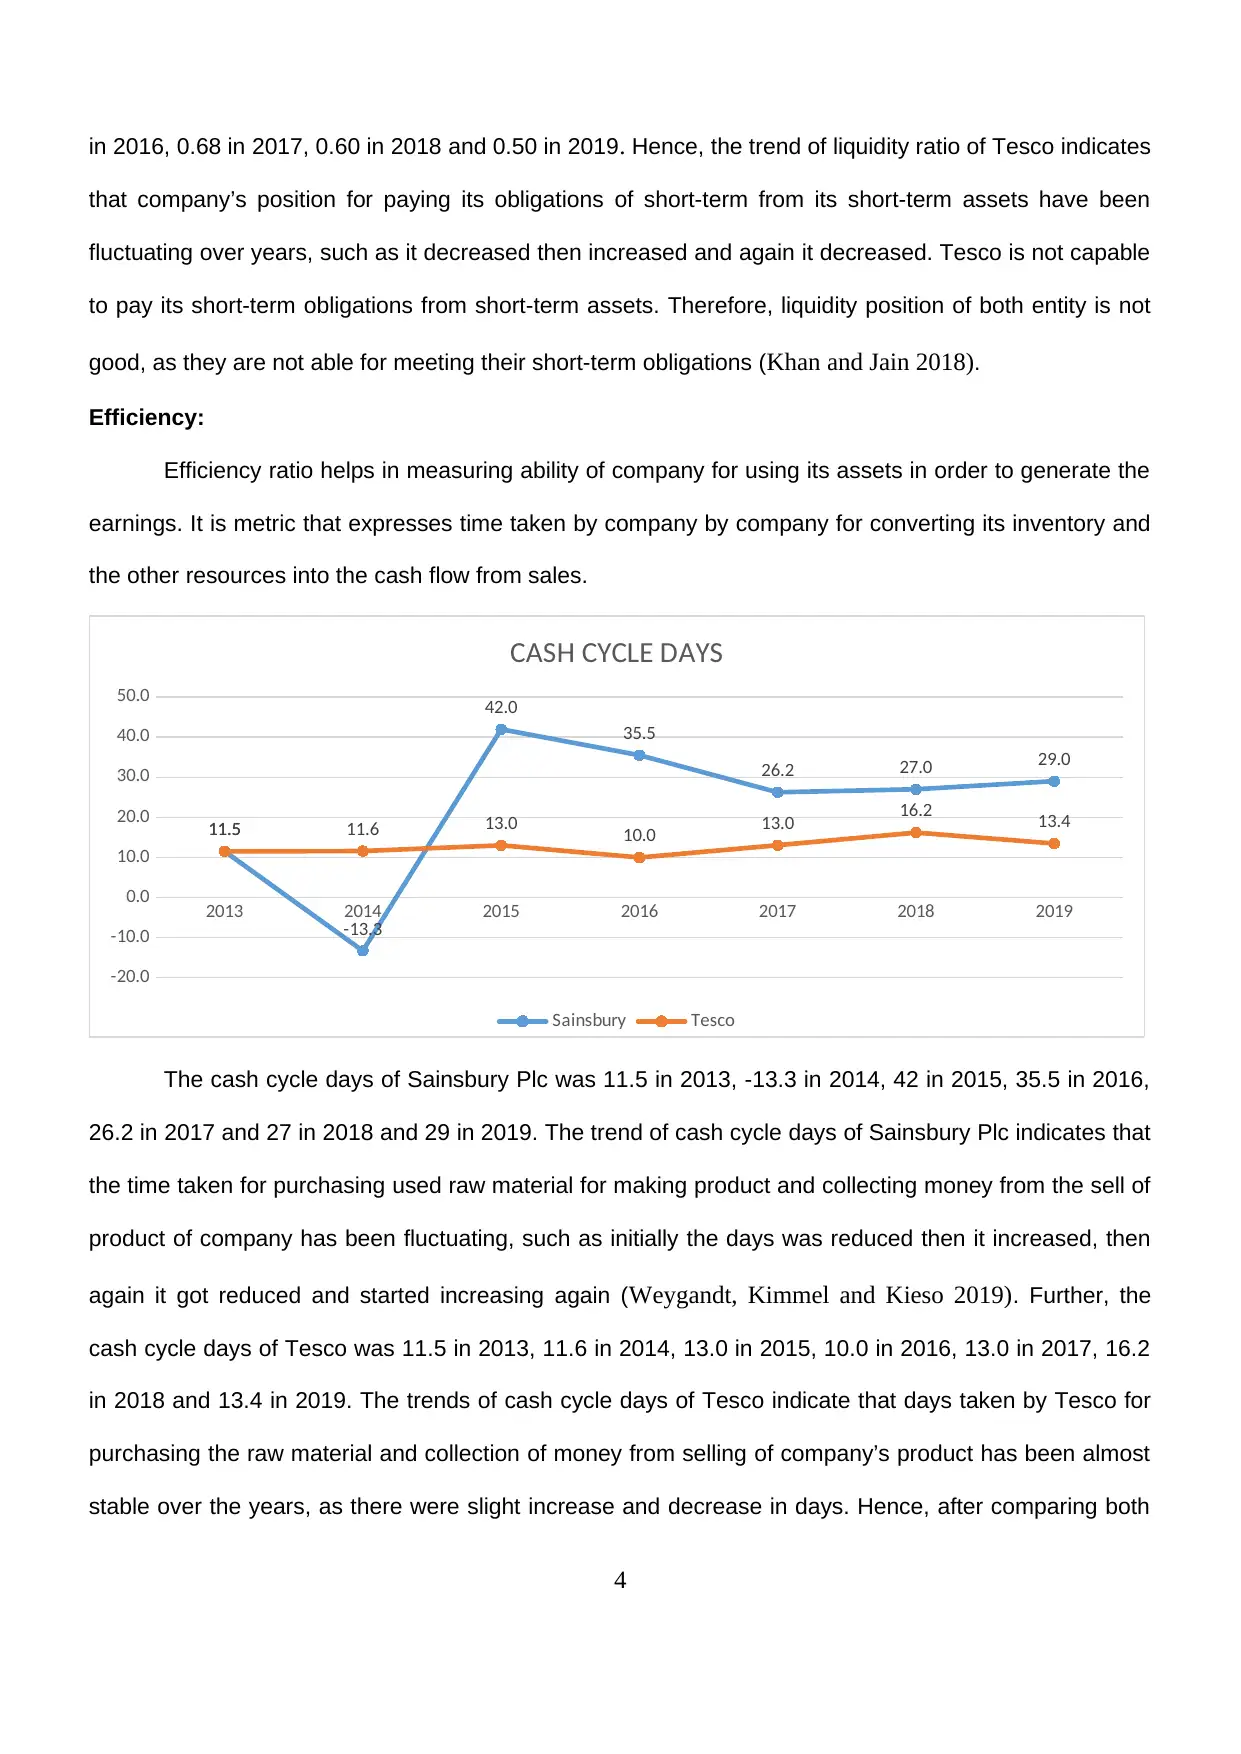
Efficiency:
Efficiency ratio helps in measuring ability of company for using its assets in order to generate the
earnings. It is metric that expresses time taken by company by company for converting its inventory and
the other resources into the cash flow from sales.
2013 2014 2015 2016 2017 2018 2019
-20.0
-10.0
0.0
10.0
20.0
30.0
40.0
50.0
11.5
-13.3
42.0
35.5
26.2 27.0 29.0
11.5 11.6 13.0 10.0 13.0 16.2 13.4
CASH CYCLE DAYS
Sainsbury Tesco
The cash cycle days of Sainsbury Plc was 11.5 in 2013, -13.3 in 2014, 42 in 2015, 35.5 in 2016,
26.2 in 2017 and 27 in 2018 and 29 in 2019. The trend of cash cycle days of Sainsbury Plc indicates that
the time taken for purchasing used raw material for making product and collecting money from the sell of
product of company has been fluctuating, such as initially the days was reduced then it increased, then
again it got reduced and started increasing again (Weygandt, Kimmel and Kieso 2019). Further, the
cash cycle days of Tesco was 11.5 in 2013, 11.6 in 2014, 13.0 in 2015, 10.0 in 2016, 13.0 in 2017, 16.2
in 2018 and 13.4 in 2019. The trends of cash cycle days of Tesco indicate that days taken by Tesco for
purchasing the raw material and collection of money from selling of company’s product has been almost
stable over the years, as there were slight increase and decrease in days. Hence, after comparing both
4
that company’s position for paying its obligations of short-term from its short-term assets have been
fluctuating over years, such as it decreased then increased and again it decreased. Tesco is not capable
to pay its short-term obligations from short-term assets. Therefore, liquidity position of both entity is not
good, as they are not able for meeting their short-term obligations (Khan and Jain 2018).
Efficiency:
Efficiency ratio helps in measuring ability of company for using its assets in order to generate the
earnings. It is metric that expresses time taken by company by company for converting its inventory and
the other resources into the cash flow from sales.
2013 2014 2015 2016 2017 2018 2019
-20.0
-10.0
0.0
10.0
20.0
30.0
40.0
50.0
11.5
-13.3
42.0
35.5
26.2 27.0 29.0
11.5 11.6 13.0 10.0 13.0 16.2 13.4
CASH CYCLE DAYS
Sainsbury Tesco
The cash cycle days of Sainsbury Plc was 11.5 in 2013, -13.3 in 2014, 42 in 2015, 35.5 in 2016,
26.2 in 2017 and 27 in 2018 and 29 in 2019. The trend of cash cycle days of Sainsbury Plc indicates that
the time taken for purchasing used raw material for making product and collecting money from the sell of
product of company has been fluctuating, such as initially the days was reduced then it increased, then
again it got reduced and started increasing again (Weygandt, Kimmel and Kieso 2019). Further, the
cash cycle days of Tesco was 11.5 in 2013, 11.6 in 2014, 13.0 in 2015, 10.0 in 2016, 13.0 in 2017, 16.2
in 2018 and 13.4 in 2019. The trends of cash cycle days of Tesco indicate that days taken by Tesco for
purchasing the raw material and collection of money from selling of company’s product has been almost
stable over the years, as there were slight increase and decrease in days. Hence, after comparing both
4
Paraphrase This Document
Need a fresh take? Get an instant paraphrase of this document with our AI Paraphraser
the company it can be said that shorter cash cycle is preferable. The cash conversion cycle of Tesco is
lesser than Sainsbury, therefore, it is better (Osadchy et al. 2018).
Gearing:
Gearing ratio is type of the financial ratio that is used for comparing debt of company relative to
various financial metrics. It represents leverage of company such as how much how much funding of
business comes from the borrowing methods versus the shareholders equity.
2013 2014 2015 2016 2017 2018 2019
0.00%
10.00%
20.00%
30.00%
40.00%
50.00%
60.00%
70.00%
80.00%
90.00%
39.50% 43.30%
64.20% 61.10%
76.50%
65.00%
56.70%
32.70% 31.70% 33.30%
28.50% 25.30% 25.60%
18.20%
Gearing Ratio %
Tesco Sainsbury
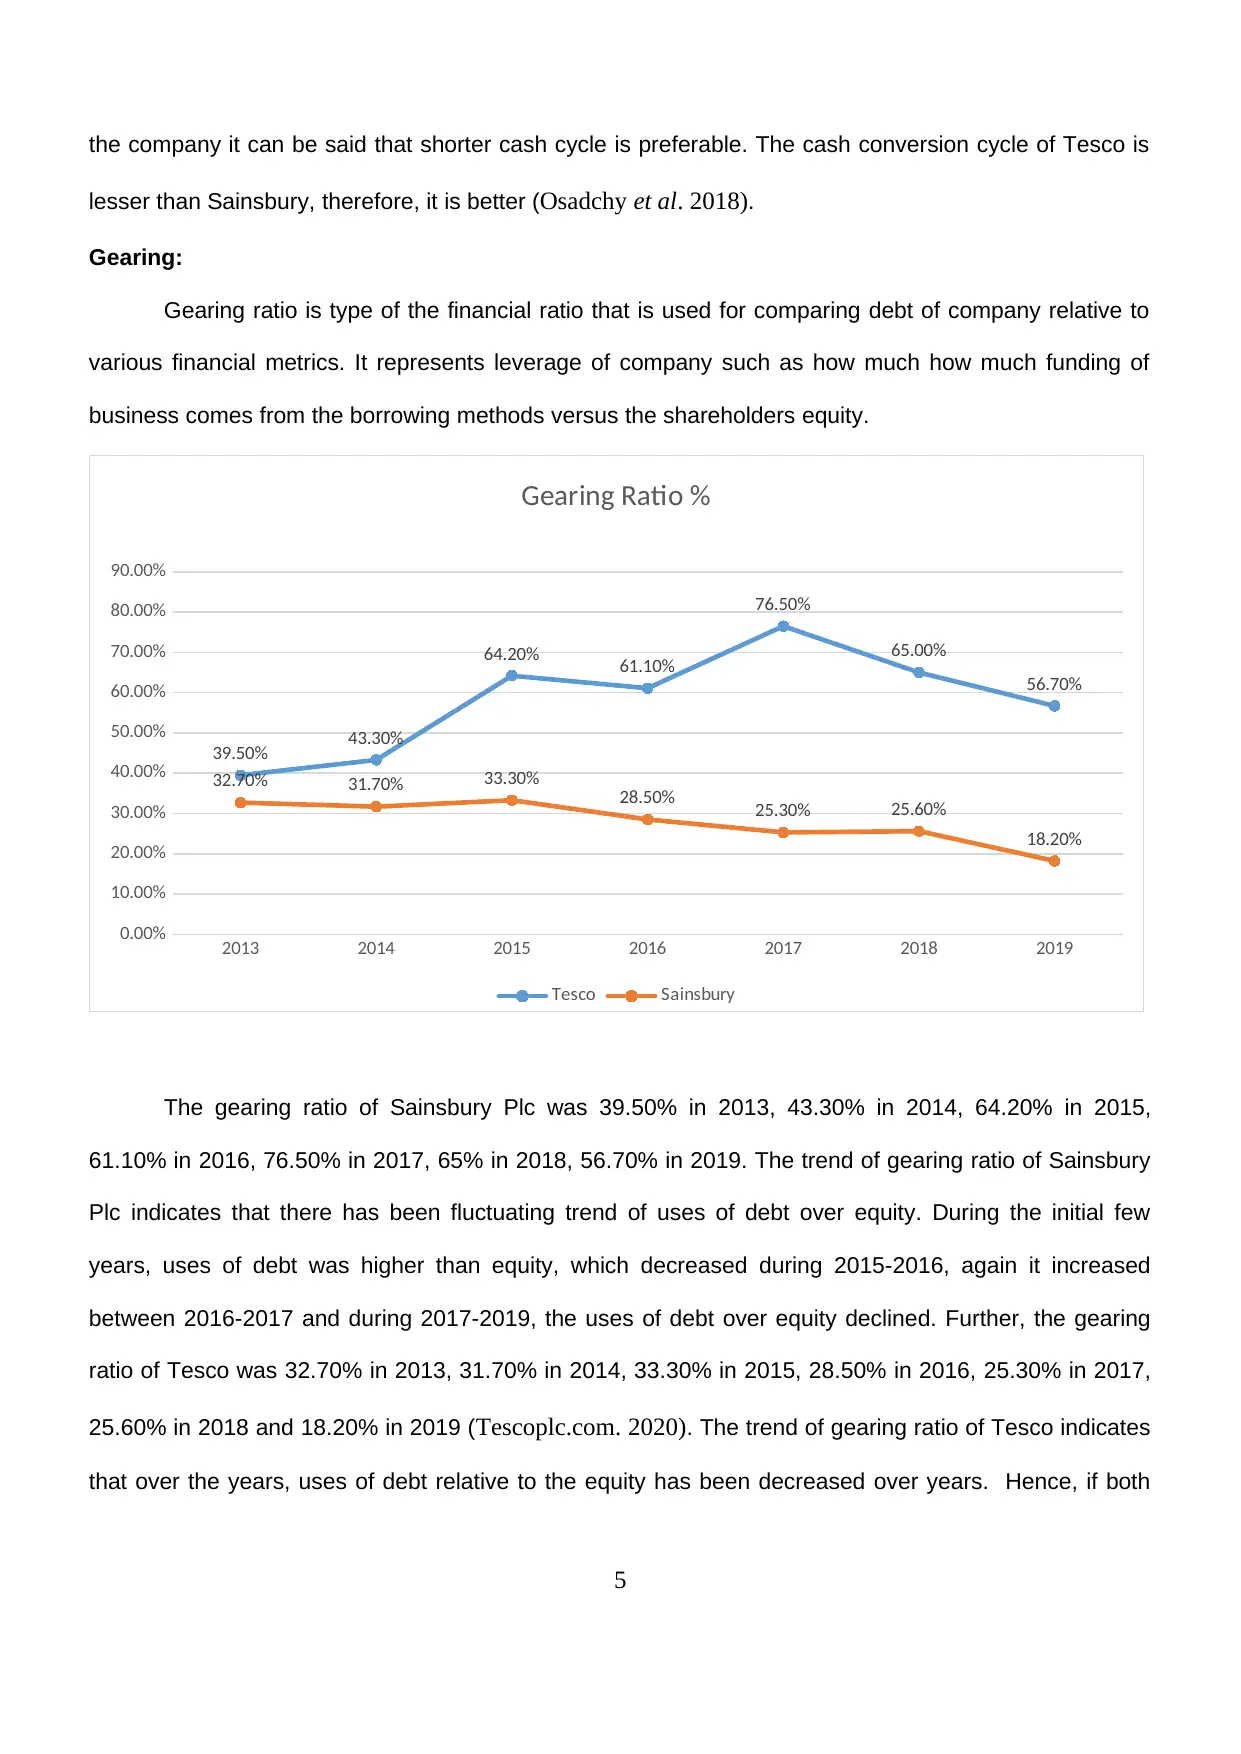
The gearing ratio of Sainsbury Plc was 39.50% in 2013, 43.30% in 2014, 64.20% in 2015,
61.10% in 2016, 76.50% in 2017, 65% in 2018, 56.70% in 2019. The trend of gearing ratio of Sainsbury
Plc indicates that there has been fluctuating trend of uses of debt over equity. During the initial few
years, uses of debt was higher than equity, which decreased during 2015-2016, again it increased
between 2016-2017 and during 2017-2019, the uses of debt over equity declined. Further, the gearing
ratio of Tesco was 32.70% in 2013, 31.70% in 2014, 33.30% in 2015, 28.50% in 2016, 25.30% in 2017,
25.60% in 2018 and 18.20% in 2019 (Tescoplc.com. 2020). The trend of gearing ratio of Tesco indicates
that over the years, uses of debt relative to the equity has been decreased over years. Hence, if both
5
lesser than Sainsbury, therefore, it is better (Osadchy et al. 2018).
Gearing:
Gearing ratio is type of the financial ratio that is used for comparing debt of company relative to
various financial metrics. It represents leverage of company such as how much how much funding of
business comes from the borrowing methods versus the shareholders equity.
2013 2014 2015 2016 2017 2018 2019
0.00%
10.00%
20.00%
30.00%
40.00%
50.00%
60.00%
70.00%
80.00%
90.00%
39.50% 43.30%
64.20% 61.10%
76.50%
65.00%
56.70%
32.70% 31.70% 33.30%
28.50% 25.30% 25.60%
18.20%
Gearing Ratio %
Tesco Sainsbury
The gearing ratio of Sainsbury Plc was 39.50% in 2013, 43.30% in 2014, 64.20% in 2015,
61.10% in 2016, 76.50% in 2017, 65% in 2018, 56.70% in 2019. The trend of gearing ratio of Sainsbury
Plc indicates that there has been fluctuating trend of uses of debt over equity. During the initial few
years, uses of debt was higher than equity, which decreased during 2015-2016, again it increased
between 2016-2017 and during 2017-2019, the uses of debt over equity declined. Further, the gearing
ratio of Tesco was 32.70% in 2013, 31.70% in 2014, 33.30% in 2015, 28.50% in 2016, 25.30% in 2017,
25.60% in 2018 and 18.20% in 2019 (Tescoplc.com. 2020). The trend of gearing ratio of Tesco indicates
that over the years, uses of debt relative to the equity has been decreased over years. Hence, if both
5
the company will be compared then it can be said that Sainsbury Plc is using more debt than equity in
comparison to Tesco, which relies heavily on equity (Pham 2014).
Administrative Expense:
Administrative expenses are expenses that company occurs and that is not tied directly to
specific functions, for instance sales, production and manufacturing. These particular expenses are
related to company as whole as opposed to individual business unit.
2013 2014 2015 2016 2017 2018 2019
0.0%
50.0%
100.0%
150.0%
200.0%
250.0%
300.0%
350.0%
400.0%
100.0% 97.2%
247.7%
186.0%
264.1%
309.6%
379.2%
100.0% 87.2%
193.6%
98.6% 104.9% 94.0% 105.7%
Administration Expenses
Sainsbury
Tesco
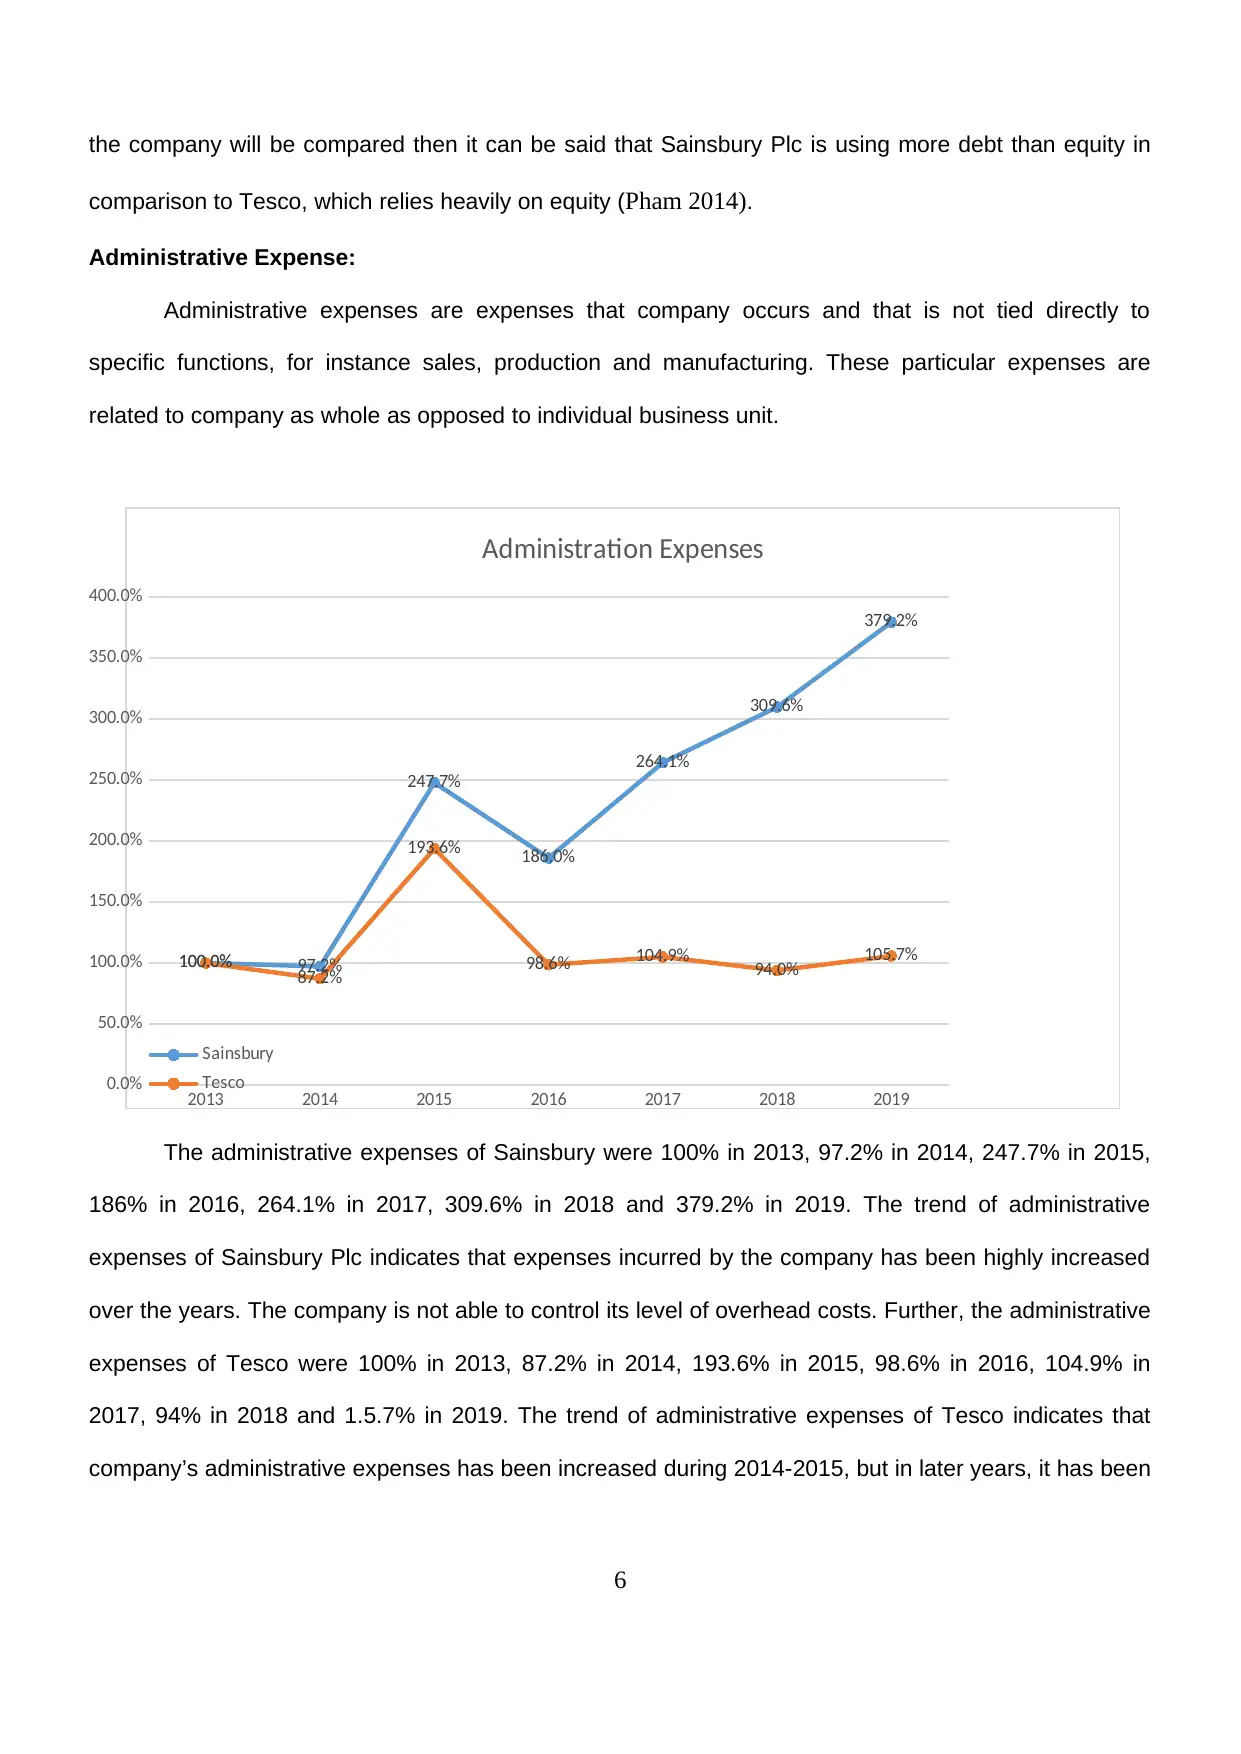
The administrative expenses of Sainsbury were 100% in 2013, 97.2% in 2014, 247.7% in 2015,
186% in 2016, 264.1% in 2017, 309.6% in 2018 and 379.2% in 2019. The trend of administrative
expenses of Sainsbury Plc indicates that expenses incurred by the company has been highly increased
over the years. The company is not able to control its level of overhead costs. Further, the administrative
expenses of Tesco were 100% in 2013, 87.2% in 2014, 193.6% in 2015, 98.6% in 2016, 104.9% in
2017, 94% in 2018 and 1.5.7% in 2019. The trend of administrative expenses of Tesco indicates that
company’s administrative expenses has been increased during 2014-2015, but in later years, it has been
6
comparison to Tesco, which relies heavily on equity (Pham 2014).
Administrative Expense:
Administrative expenses are expenses that company occurs and that is not tied directly to
specific functions, for instance sales, production and manufacturing. These particular expenses are
related to company as whole as opposed to individual business unit.
2013 2014 2015 2016 2017 2018 2019
0.0%
50.0%
100.0%
150.0%
200.0%
250.0%
300.0%
350.0%
400.0%
100.0% 97.2%
247.7%
186.0%
264.1%
309.6%
379.2%
100.0% 87.2%
193.6%
98.6% 104.9% 94.0% 105.7%
Administration Expenses
Sainsbury
Tesco
The administrative expenses of Sainsbury were 100% in 2013, 97.2% in 2014, 247.7% in 2015,
186% in 2016, 264.1% in 2017, 309.6% in 2018 and 379.2% in 2019. The trend of administrative
expenses of Sainsbury Plc indicates that expenses incurred by the company has been highly increased
over the years. The company is not able to control its level of overhead costs. Further, the administrative
expenses of Tesco were 100% in 2013, 87.2% in 2014, 193.6% in 2015, 98.6% in 2016, 104.9% in
2017, 94% in 2018 and 1.5.7% in 2019. The trend of administrative expenses of Tesco indicates that
company’s administrative expenses has been increased during 2014-2015, but in later years, it has been
6
⊘ This is a preview!⊘
Do you want full access?
Subscribe today to unlock all pages.
Trusted by 1+ million students worldwide
decreased and stable. Hence, if both of the company is compared then it can be said that Tesco is much
more stable in controlling its level of overhead costs than Sainsbury Plc (Shah and Jan 2014).
Recommendations & Conclusions:
Therefore, this report concludes that financial position of Sainsbury Plc is good, but there are
certain areas, where board of company has to focus. The gross profit margin of entity has been
increased over years. It is good but only care that company has to take is to minimise the level of cost of
operations. Further, the liquidity position of company shows its non-ability for meeting obligations of
short-term. Sainsbury Plc is required to increase the level of short-term assets and reduce the level of
short-term obligations. Moreover, the cash conversion days of Sainsbury Plc has been increased over
years. It should make an attempt to reduce the days taken in purchased inventory and receiving money
from selling the product to customers. A good balance of this will help the company to maintain the
efficiency level of organization. In addition, Sainsbury Plc is using more debt over equity. Debt is
considered more riskier than equity. Hence, company should try to reduce the uses of debt. Lastly,
Sainsbury should try to reduce its level of administrative expenses. It will help the company for achieving
economies of scale.
7
Paraphrase This Document
Need a fresh take? Get an instant paraphrase of this document with our AI Paraphraser
Reference
About.sainsburys.co.uk. 2020. [online] Available at:
https://www.about.sainsburys.co.uk/~/media/Files/S/Sainsburys/documents/reports-and-presentations/
annual-reports/sainsburys-ar2019.pdf [Accessed 13 Jan. 2020].
Baka, M., 2018. Analysis of the financial statement on the example of a company listed on the Warsaw
Stock Exchange (Doctoral dissertation, Zakład Prawa Gospodarczego i Polityki Gospodarczej).
Dahmen, P. and Rodríguez, E., 2014. Financial Literacy and the Success of Small Businesses: An
Observation from a Small Business Development Center. Numeracy: Advancing Education in
Quantitative Literacy, 7(1).
EL BOUAZZI, A.M., BOUAYAD, N.A. and ROUGGANI, K., 2017. ANALYSIS OF THE
PERFORMANCE OF MOROCCAN BUSINESS THROUGH THE SUMMARY
STATEMENTS. EUFIRE 2017, p.79.
Khan, M.Y. and Jain, P.K., 2018. Financial Management: Text, Problems and Cases, 8e. McGraw-Hill
Education.
Osadchy, E.A., Akhmetshin, E.M., Amirova, E.F., Bochkareva, T.N., Gazizyanova, Y. and Yumashev,
A.V., 2018. Financial statements of a company as an information base for decision-making in a
transforming economy.
Pham, L.H., 2014. An Analysis of Pre and Post-Acquisition Financial Performance of Target Czech
Banks: A Comparative Analysis. Journal of Eastern European and Central Asian Research
(JEECAR), 1(2), pp.12-12.
Shah, S.Q. and Jan, R., 2014. Analysis of financial performance of private banks in Pakistan. Procedia-
Social and Behavioral Sciences, 109, pp.1021-1025.
Tescoplc.com. 2020. [online] Available at: https://www.tescoplc.com/media/476423/tesco_ar_2019.pdf
[Accessed 13 Jan. 2020].
Weygandt, J.J., Kimmel, P.D. and Kieso, D.E., 2019. Financial accounting. Wiley.
8
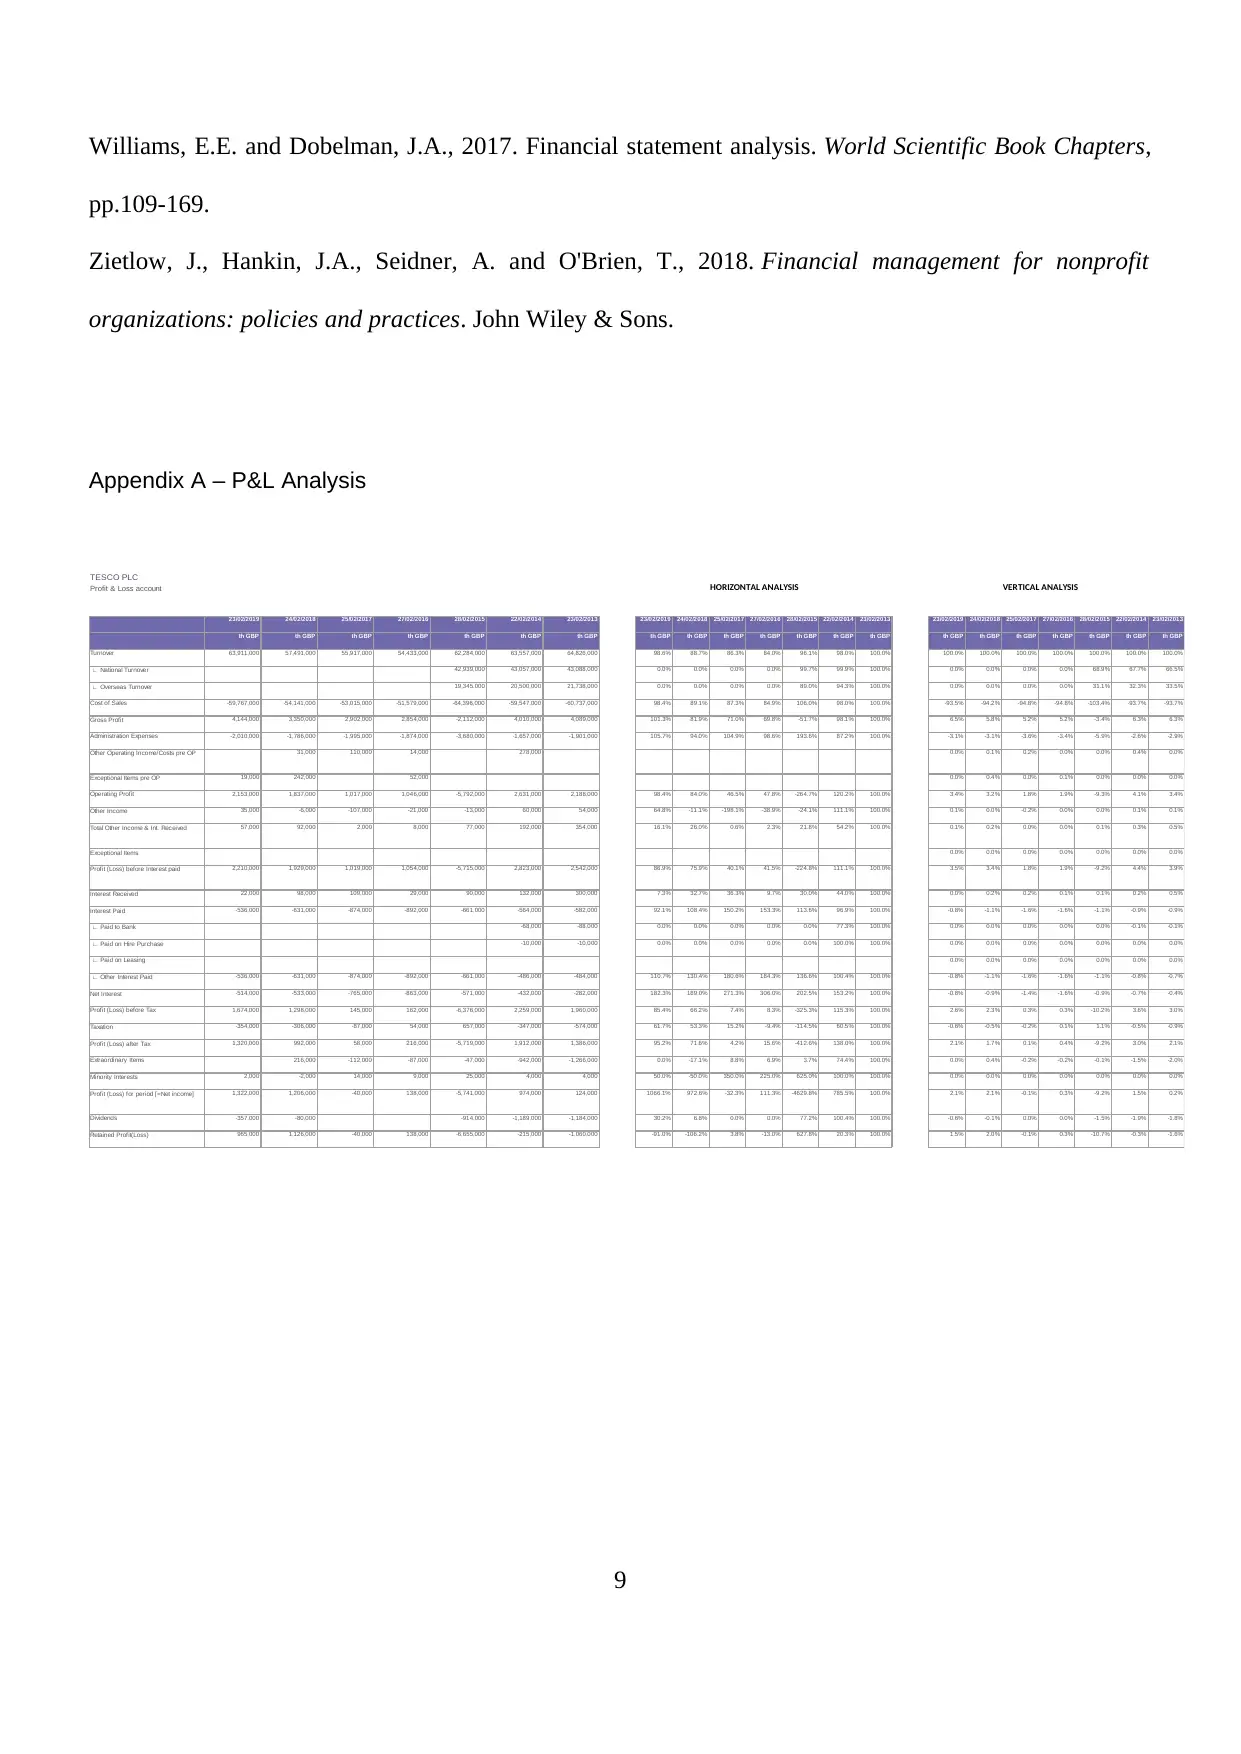
Williams, E.E. and Dobelman, J.A., 2017. Financial statement analysis. World Scientific Book Chapters,
pp.109-169.
Zietlow, J., Hankin, J.A., Seidner, A. and O'Brien, T., 2018. Financial management for nonprofit
organizations: policies and practices. John Wiley & Sons.
Appendix A – P&L Analysis
HORIZONTAL ANALYSIS VERTICAL ANALYSIS
23/02/2019 24/02/2018 25/02/2017 27/02/2016 28/02/2015 22/02/2014 23/02/2013 23/02/2019 24/02/2018 25/02/2017 27/02/2016 28/02/2015 22/02/2014 23/02/2013 23/02/2019 24/02/2018 25/02/2017 27/02/2016 28/02/2015 22/02/2014 23/02/2013
th GBP th GBP th GBP th GBP th GBP th GBP th GBP th GBP th GBP th GBP th GBP th GBP th GBP th GBP th GBP th GBP th GBP th GBP th GBP th GBP th GBP
Turnover 63,911,000 57,491,000 55,917,000 54,433,000 62,284,000 63,557,000 64,826,000 98.6% 88.7% 86.3% 84.0% 96.1% 98.0% 100.0% 100.0% 100.0% 100.0% 100.0% 100.0% 100.0% 100.0%
∟ National Turnover 42,939,000 43,057,000 43,088,000 0.0% 0.0% 0.0% 0.0% 99.7% 99.9% 100.0% 0.0% 0.0% 0.0% 0.0% 68.9% 67.7% 66.5%
∟ Overseas Turnover 19,345,000 20,500,000 21,738,000 0.0% 0.0% 0.0% 0.0% 89.0% 94.3% 100.0% 0.0% 0.0% 0.0% 0.0% 31.1% 32.3% 33.5%
Cost of Sales -59,767,000 -54,141,000 -53,015,000 -51,579,000 -64,396,000 -59,547,000 -60,737,000 98.4% 89.1% 87.3% 84.9% 106.0% 98.0% 100.0% -93.5% -94.2% -94.8% -94.8% -103.4% -93.7% -93.7%
Gross Profit 4,144,000 3,350,000 2,902,000 2,854,000 -2,112,000 4,010,000 4,089,000 101.3% 81.9% 71.0% 69.8% -51.7% 98.1% 100.0% 6.5% 5.8% 5.2% 5.2% -3.4% 6.3% 6.3%
Administration Expenses -2,010,000 -1,786,000 -1,995,000 -1,874,000 -3,680,000 -1,657,000 -1,901,000 105.7% 94.0% 104.9% 98.6% 193.6% 87.2% 100.0% -3.1% -3.1% -3.6% -3.4% -5.9% -2.6% -2.9%
Other Operating Income/Costs pre OP 31,000 110,000 14,000 278,000 0.0% 0.1% 0.2% 0.0% 0.0% 0.4% 0.0%
Exceptional Items pre OP 19,000 242,000 52,000 0.0% 0.4% 0.0% 0.1% 0.0% 0.0% 0.0%
Operating Profit 2,153,000 1,837,000 1,017,000 1,046,000 -5,792,000 2,631,000 2,188,000 98.4% 84.0% 46.5% 47.8% -264.7% 120.2% 100.0% 3.4% 3.2% 1.8% 1.9% -9.3% 4.1% 3.4%
Other Income 35,000 -6,000 -107,000 -21,000 -13,000 60,000 54,000 64.8% -11.1% -198.1% -38.9% -24.1% 111.1% 100.0% 0.1% 0.0% -0.2% 0.0% 0.0% 0.1% 0.1%
Total Other Income & Int. Received 57,000 92,000 2,000 8,000 77,000 192,000 354,000 16.1% 26.0% 0.6% 2.3% 21.8% 54.2% 100.0% 0.1% 0.2% 0.0% 0.0% 0.1% 0.3% 0.5%
Exceptional Items 0.0% 0.0% 0.0% 0.0% 0.0% 0.0% 0.0%
Profit (Loss) before Interest paid 2,210,000 1,929,000 1,019,000 1,054,000 -5,715,000 2,823,000 2,542,000 86.9% 75.9% 40.1% 41.5% -224.8% 111.1% 100.0% 3.5% 3.4% 1.8% 1.9% -9.2% 4.4% 3.9%
Interest Received 22,000 98,000 109,000 29,000 90,000 132,000 300,000 7.3% 32.7% 36.3% 9.7% 30.0% 44.0% 100.0% 0.0% 0.2% 0.2% 0.1% 0.1% 0.2% 0.5%
Interest Paid -536,000 -631,000 -874,000 -892,000 -661,000 -564,000 -582,000 92.1% 108.4% 150.2% 153.3% 113.6% 96.9% 100.0% -0.8% -1.1% -1.6% -1.6% -1.1% -0.9% -0.9%
∟ Paid to Bank -68,000 -88,000 0.0% 0.0% 0.0% 0.0% 0.0% 77.3% 100.0% 0.0% 0.0% 0.0% 0.0% 0.0% -0.1% -0.1%
∟ Paid on Hire Purchase -10,000 -10,000 0.0% 0.0% 0.0% 0.0% 0.0% 100.0% 100.0% 0.0% 0.0% 0.0% 0.0% 0.0% 0.0% 0.0%
∟ Paid on Leasing 0.0% 0.0% 0.0% 0.0% 0.0% 0.0% 0.0%
∟ Other Interest Paid -536,000 -631,000 -874,000 -892,000 -661,000 -486,000 -484,000 110.7% 130.4% 180.6% 184.3% 136.6% 100.4% 100.0% -0.8% -1.1% -1.6% -1.6% -1.1% -0.8% -0.7%
Net Interest -514,000 -533,000 -765,000 -863,000 -571,000 -432,000 -282,000 182.3% 189.0% 271.3% 306.0% 202.5% 153.2% 100.0% -0.8% -0.9% -1.4% -1.6% -0.9% -0.7% -0.4%
Profit (Loss) before Tax 1,674,000 1,298,000 145,000 162,000 -6,376,000 2,259,000 1,960,000 85.4% 66.2% 7.4% 8.3% -325.3% 115.3% 100.0% 2.6% 2.3% 0.3% 0.3% -10.2% 3.6% 3.0%
Taxation -354,000 -306,000 -87,000 54,000 657,000 -347,000 -574,000 61.7% 53.3% 15.2% -9.4% -114.5% 60.5% 100.0% -0.6% -0.5% -0.2% 0.1% 1.1% -0.5% -0.9%
Profit (Loss) after Tax 1,320,000 992,000 58,000 216,000 -5,719,000 1,912,000 1,386,000 95.2% 71.6% 4.2% 15.6% -412.6% 138.0% 100.0% 2.1% 1.7% 0.1% 0.4% -9.2% 3.0% 2.1%
Extraordinary Items 216,000 -112,000 -87,000 -47,000 -942,000 -1,266,000 0.0% -17.1% 8.8% 6.9% 3.7% 74.4% 100.0% 0.0% 0.4% -0.2% -0.2% -0.1% -1.5% -2.0%
Minority Interests 2,000 -2,000 14,000 9,000 25,000 4,000 4,000 50.0% -50.0% 350.0% 225.0% 625.0% 100.0% 100.0% 0.0% 0.0% 0.0% 0.0% 0.0% 0.0% 0.0%
Profit (Loss) for period [=Net income] 1,322,000 1,206,000 -40,000 138,000 -5,741,000 974,000 124,000 1066.1% 972.6% -32.3% 111.3% -4629.8% 785.5% 100.0% 2.1% 2.1% -0.1% 0.3% -9.2% 1.5% 0.2%
Dividends -357,000 -80,000 -914,000 -1,189,000 -1,184,000 30.2% 6.8% 0.0% 0.0% 77.2% 100.4% 100.0% -0.6% -0.1% 0.0% 0.0% -1.5% -1.9% -1.8%
Retained Profit(Loss) 965,000 1,126,000 -40,000 138,000 -6,655,000 -215,000 -1,060,000 -91.0% -106.2% 3.8% -13.0% 627.8% 20.3% 100.0% 1.5% 2.0% -0.1% 0.3% -10.7% -0.3% -1.6%
TESCO PLC
Profit & Loss account
9
⊘ This is a preview!⊘
Do you want full access?
Subscribe today to unlock all pages.
Trusted by 1+ million students worldwide
HORIZONTAL ANALYSIS VERTICAL ANALYSIS
09/03/2019 10/03/2018 11/03/2017 12/03/2016 14/03/2015 15/03/2014 16/03/2013 09/03/2019 10/03/2018 11/03/2017 12/03/2016 14/03/2015 15/03/2014 16/03/2013 09/03/2019 10/03/2018 11/03/2017 12/03/2016 14/03/2015 15/03/2014 16/03/2013
th GBP th GBP th GBP th GBP th GBP th GBP th GBP th GBP th GBP th GBP th GBP th GBP th GBP th GBP th GBP th GBP th GBP th GBP th GBP th GBP th GBP
Turnover 29,007,000 28,456,000 26,224,000 23,506,000 23,775,000 23,949,000 23,303,000 124.5% 122.1% 112.5% 100.9% 102.0% 102.8% 100.0% 100.0% 100.0% 100.0% 100.0% 100.0% 100.0% 100.0%
∟ National Turnover 23,949,000 23,303,000 0.0% 0.0% 0.0% 0.0% 0.0% 102.8% 100.0% 0.0% 0.0% 0.0% 0.0% 0.0% 100.0% 100.0%
∟ Overseas Turnover 0.0% 0.0% 0.0% 0.0% 0.0% 0.0% 0.0%
Cost of Sales -27,000,000 -26,574,000 -24,590,000 -22,050,000 -22,567,000 -22,562,000 -22,026,000 122.6% 120.6% 111.6% 100.1% 102.5% 102.4% 100.0% -93.1% -93.4% -93.8% -93.8% -94.9% -94.2% -94.5%
Gross Profit 2,007,000 1,882,000 1,634,000 1,456,000 1,208,000 1,387,000 1,277,000 157.2% 147.4% 128.0% 114.0% 94.6% 108.6% 100.0% 6.9% 6.6% 6.2% 6.2% 5.1% 5.8% 5.5%
Administration Expenses -1,733,000 -1,415,000 -1,207,000 -850,000 -1,132,000 -444,000 -457,000 379.2% 309.6% 264.1% 186.0% 247.7% 97.2% 100.0% -6.0% -5.0% -4.6% -3.6% -4.8% -1.9% -2.0%
Other Operating Income/Costs pre OP 38,000 51,000 215,000 101,000 5,000 66,000 67,000 56.7% 76.1% 320.9% 150.7% 7.5% 98.5% 100.0% 0.1% 0.2% 0.8% 0.4% 0.0% 0.3% 0.3%
Exceptional Items pre OP 0.0% 0.0% 0.0% 0.0% 0.0% 0.0% 0.0%
Operating Profit 312,000 518,000 642,000 707,000 81,000 1,009,000 887,000 35.2% 58.4% 72.4% 79.7% 9.1% 113.8% 100.0% 1.1% 1.8% 2.4% 3.0% 0.3% 4.2% 3.8%
Other Income 4,000 12,000 -37,000 -11,000 8,000 28,000 24,000 16.7% 50.0% -154.2% -45.8% 33.3% 116.7% 100.0% 0.0% 0.0% -0.1% 0.0% 0.0% 0.1% 0.1%
Total Other Income & Int. Received 26,000 31,000 -3,000 8,000 27,000 48,000 43,000 60.5% 72.1% -7.0% 18.6% 62.8% 111.6% 100.0% 0.1% 0.1% 0.0% 0.0% 0.1% 0.2% 0.2%
Exceptional Items 0.0% 0.0% 0.0% 0.0% 0.0% 0.0% 0.0%
Profit (Loss) before Interest paid 338,000 549,000 639,000 715,000 108,000 1,057,000 930,000 36.3% 59.0% 68.7% 76.9% 11.6% 113.7% 100.0% 1.2% 1.9% 2.4% 3.0% 0.5% 4.4% 4.0%
Interest Received 22,000 19,000 34,000 19,000 19,000 20,000 19,000 115.8% 100.0% 178.9% 100.0% 100.0% 105.3% 100.0% 0.1% 0.1% 0.1% 0.1% 0.1% 0.1% 0.1%
Interest Paid -99,000 -140,000 -136,000 -167,000 -180,000 -159,000 -142,000 69.7% 98.6% 95.8% 117.6% 126.8% 112.0% 100.0% -0.3% -0.5% -0.5% -0.7% -0.8% -0.7% -0.6%
∟ Paid to Bank -151,000 0.0% 0.0% 0.0% 0.0% 0.0% -0.6% 0.0%
∟ Paid on Hire Purchase 0.0% 0.0% 0.0% 0.0% 0.0% 0.0% 0.0%
∟ Paid on Leasing -7,000 -7,000 -8,000 -9,000 -8,000 -7,000 100.0% 100.0% 114.3% 128.6% 0.0% 114.3% 100.0% 0.0% 0.0% 0.0% 0.0% 0.0% 0.0% 0.0%
∟ Other Interest Paid -92,000 -133,000 -128,000 -158,000 -180,000 -135,000 68.1% 98.5% 94.8% 117.0% 133.3% 0.0% 100.0% -0.3% -0.5% -0.5% -0.7% -0.8% 0.0% -0.6%
Net Interest -77,000 -121,000 -102,000 -148,000 -161,000 -139,000 -123,000 62.6% 98.4% 82.9% 120.3% 130.9% 113.0% 100.0% -0.3% -0.4% -0.4% -0.6% -0.7% -0.6% -0.5%
Profit (Loss) before Tax 239,000 409,000 503,000 548,000 -72,000 898,000 788,000 30.3% 51.9% 63.8% 69.5% -9.1% 114.0% 100.0% 0.8% 1.4% 1.9% 2.3% -0.3% 3.7% 3.4%
Taxation -20,000 -100,000 -126,000 -77,000 -94,000 -182,000 -174,000 11.5% 57.5% 72.4% 44.3% 54.0% 104.6% 100.0% -0.1% -0.4% -0.5% -0.3% -0.4% -0.8% -0.7%
Profit (Loss) after Tax 219,000 309,000 377,000 471,000 -166,000 716,000 614,000 35.7% 50.3% 61.4% 76.7% -27.0% 116.6% 100.0% 0.8% 1.1% 1.4% 2.0% -0.7% 3.0% 2.6%
Profit (Loss) for period [=Net income] 219,000 309,000 377,000 471,000 -166,000 716,000 614,000 35.7% 50.3% 61.4% 76.7% -27.0% 116.6% 100.0% 0.8% 1.1% 1.4% 2.0% -0.7% 3.0% 2.6%
Dividends -224,000 -212,000 -232,000 -234,000 -330,000 -320,000 -308,000 72.7% 68.8% 75.3% 76.0% 107.1% 103.9% 100.0% -0.8% -0.7% -0.9% -1.0% -1.4% -1.3% -1.3%
Retained Profit(Loss) -5,000 97,000 145,000 237,000 -496,000 396,000 306,000 -1.6% 31.7% 47.4% 77.5% -162.1% 129.4% 100.0% 0.0% 0.3% 0.6% 1.0% -2.1% 1.7% 1.3%
J SAINSBURY PLC
Profit & Loss account
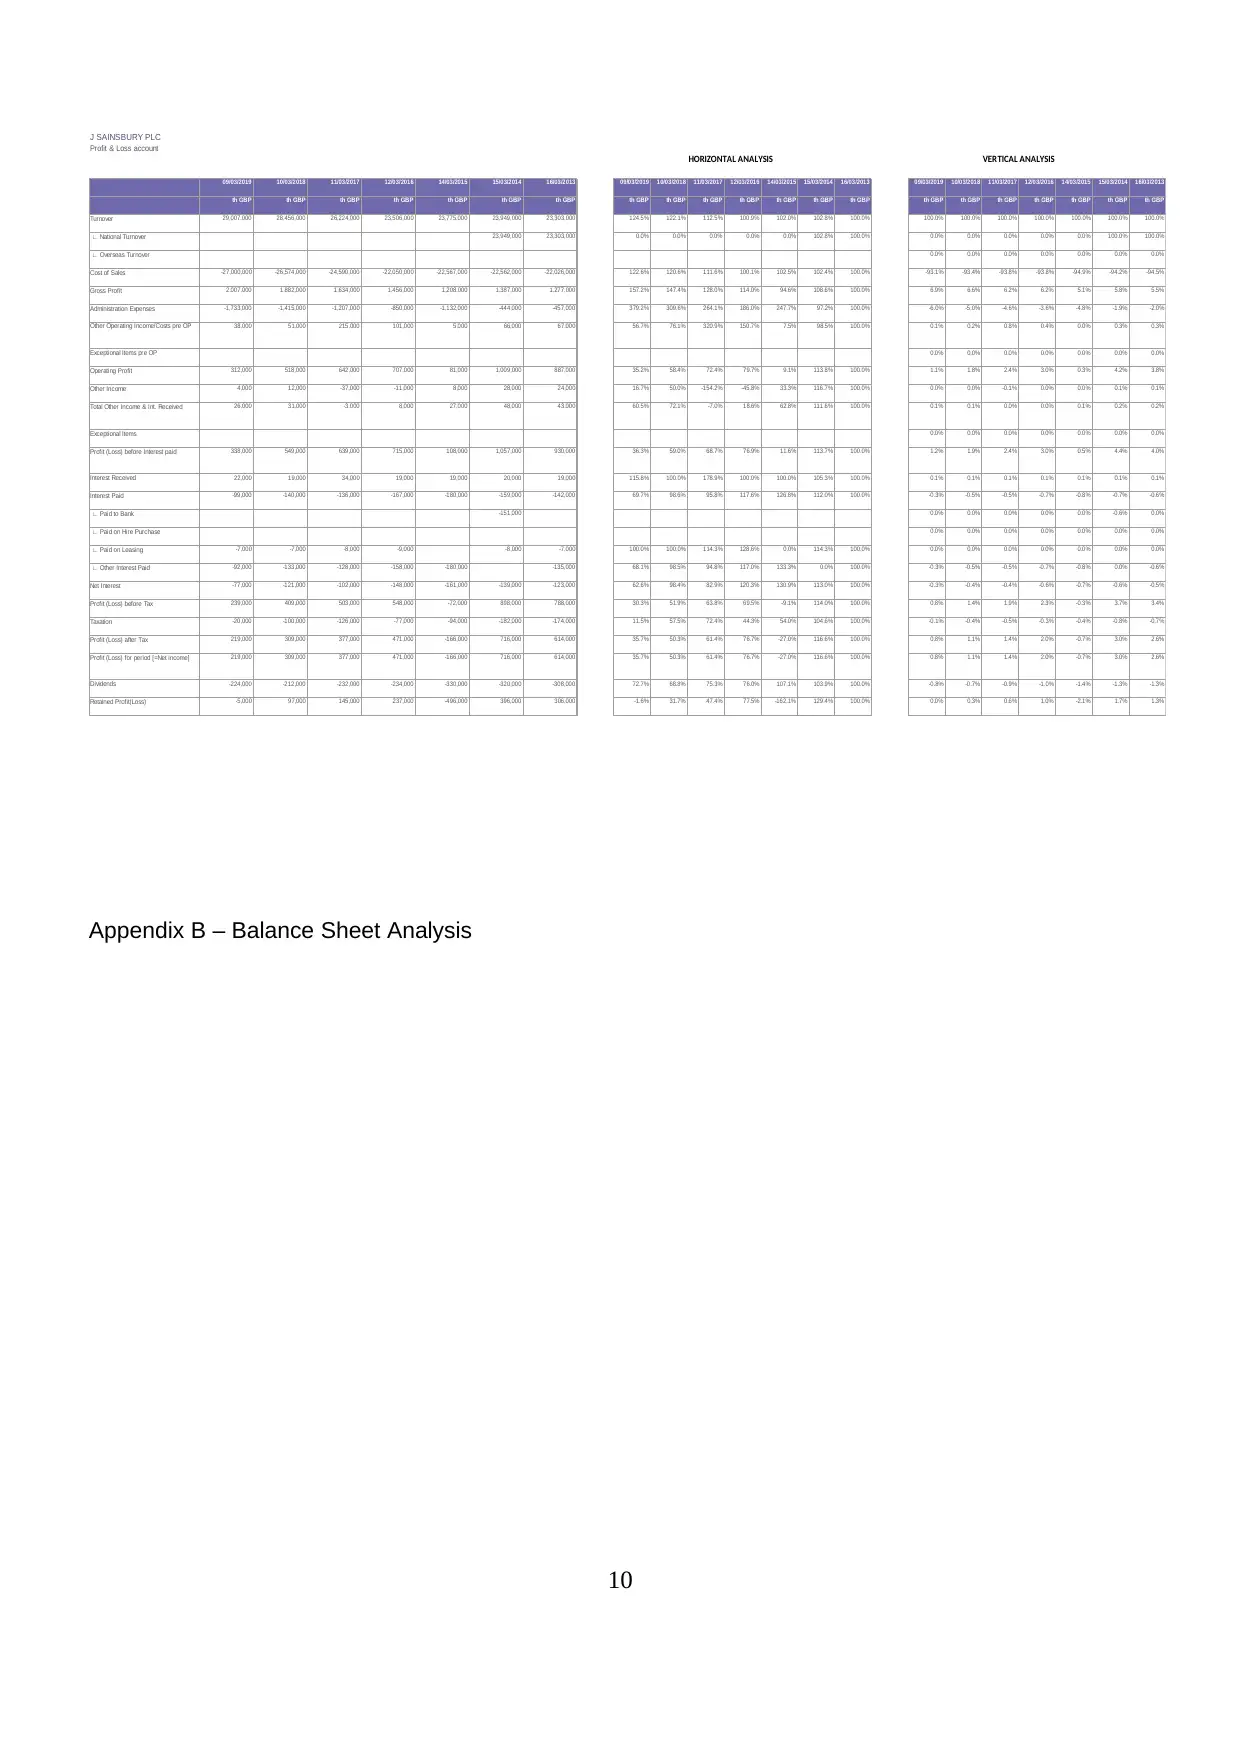
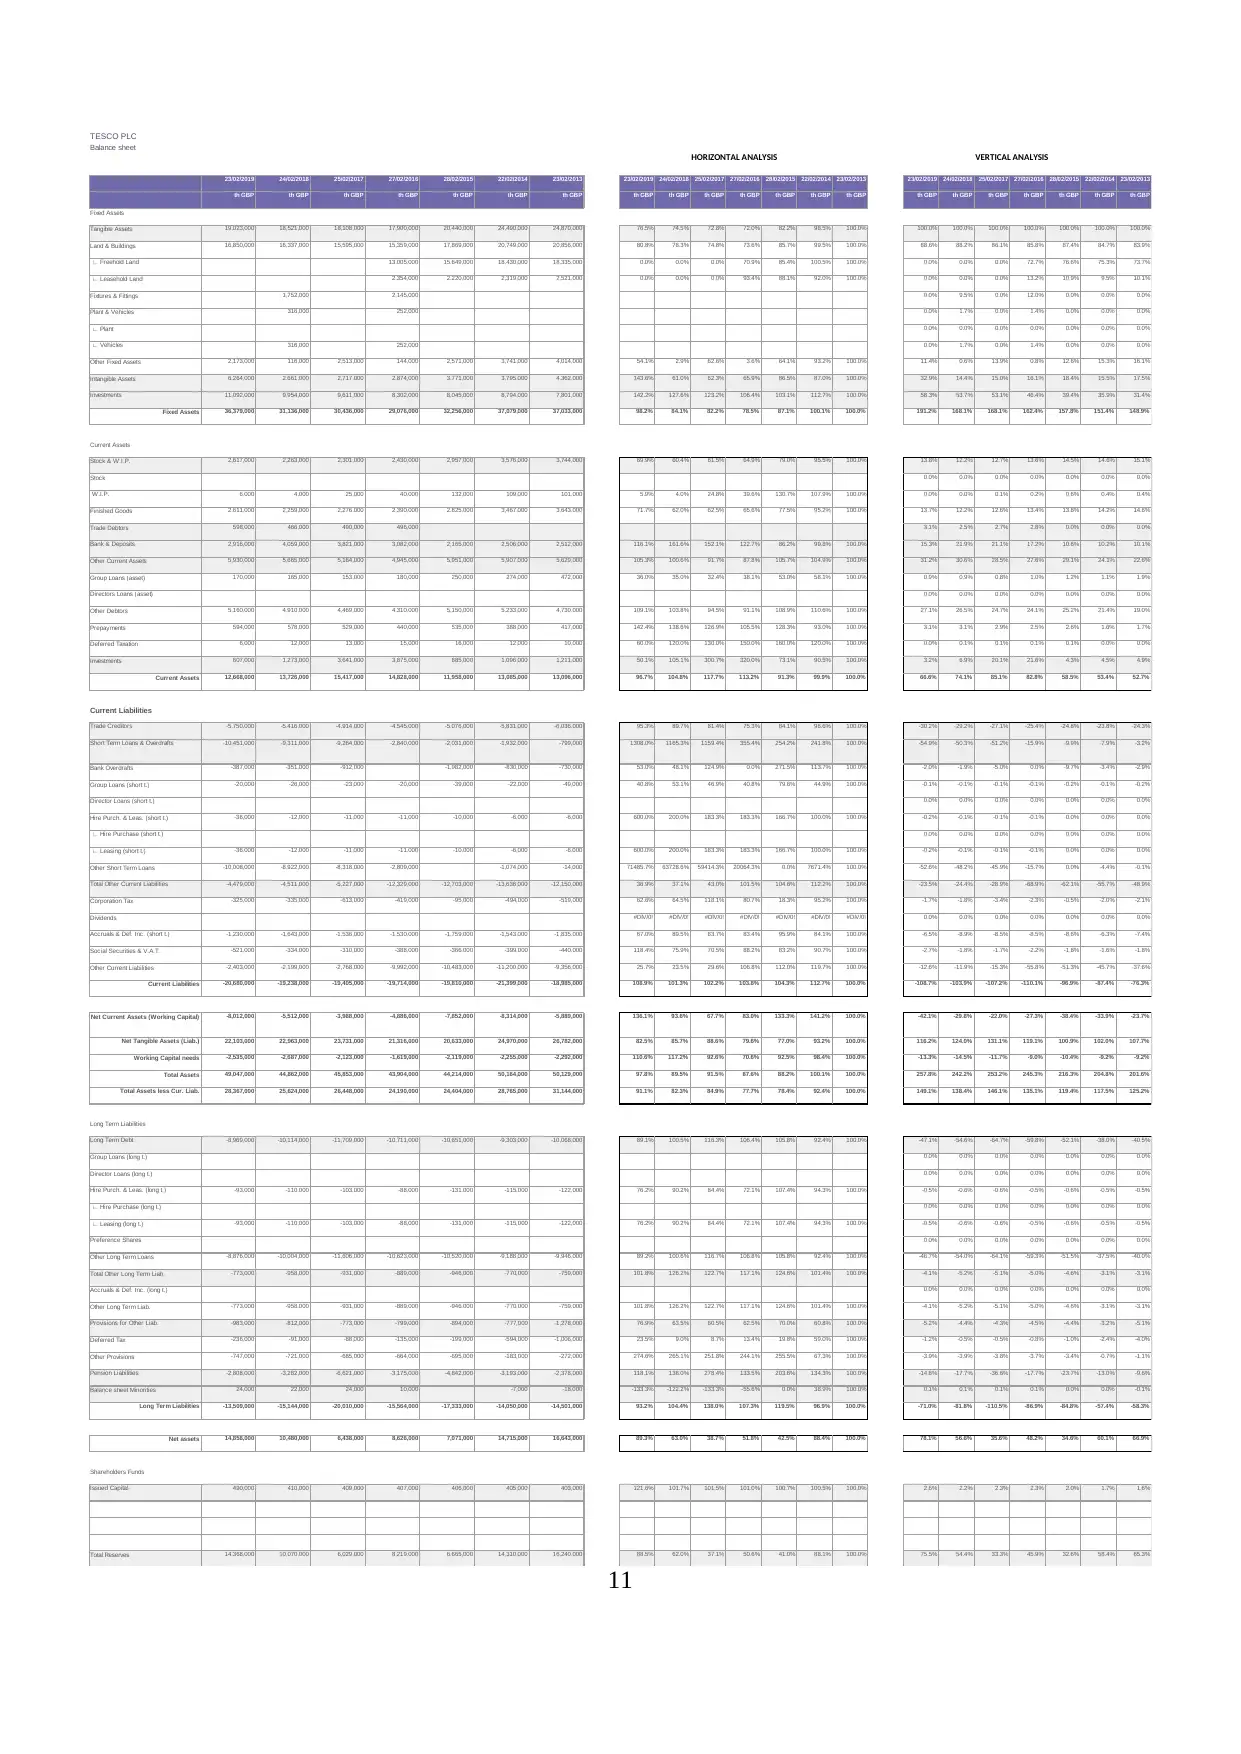
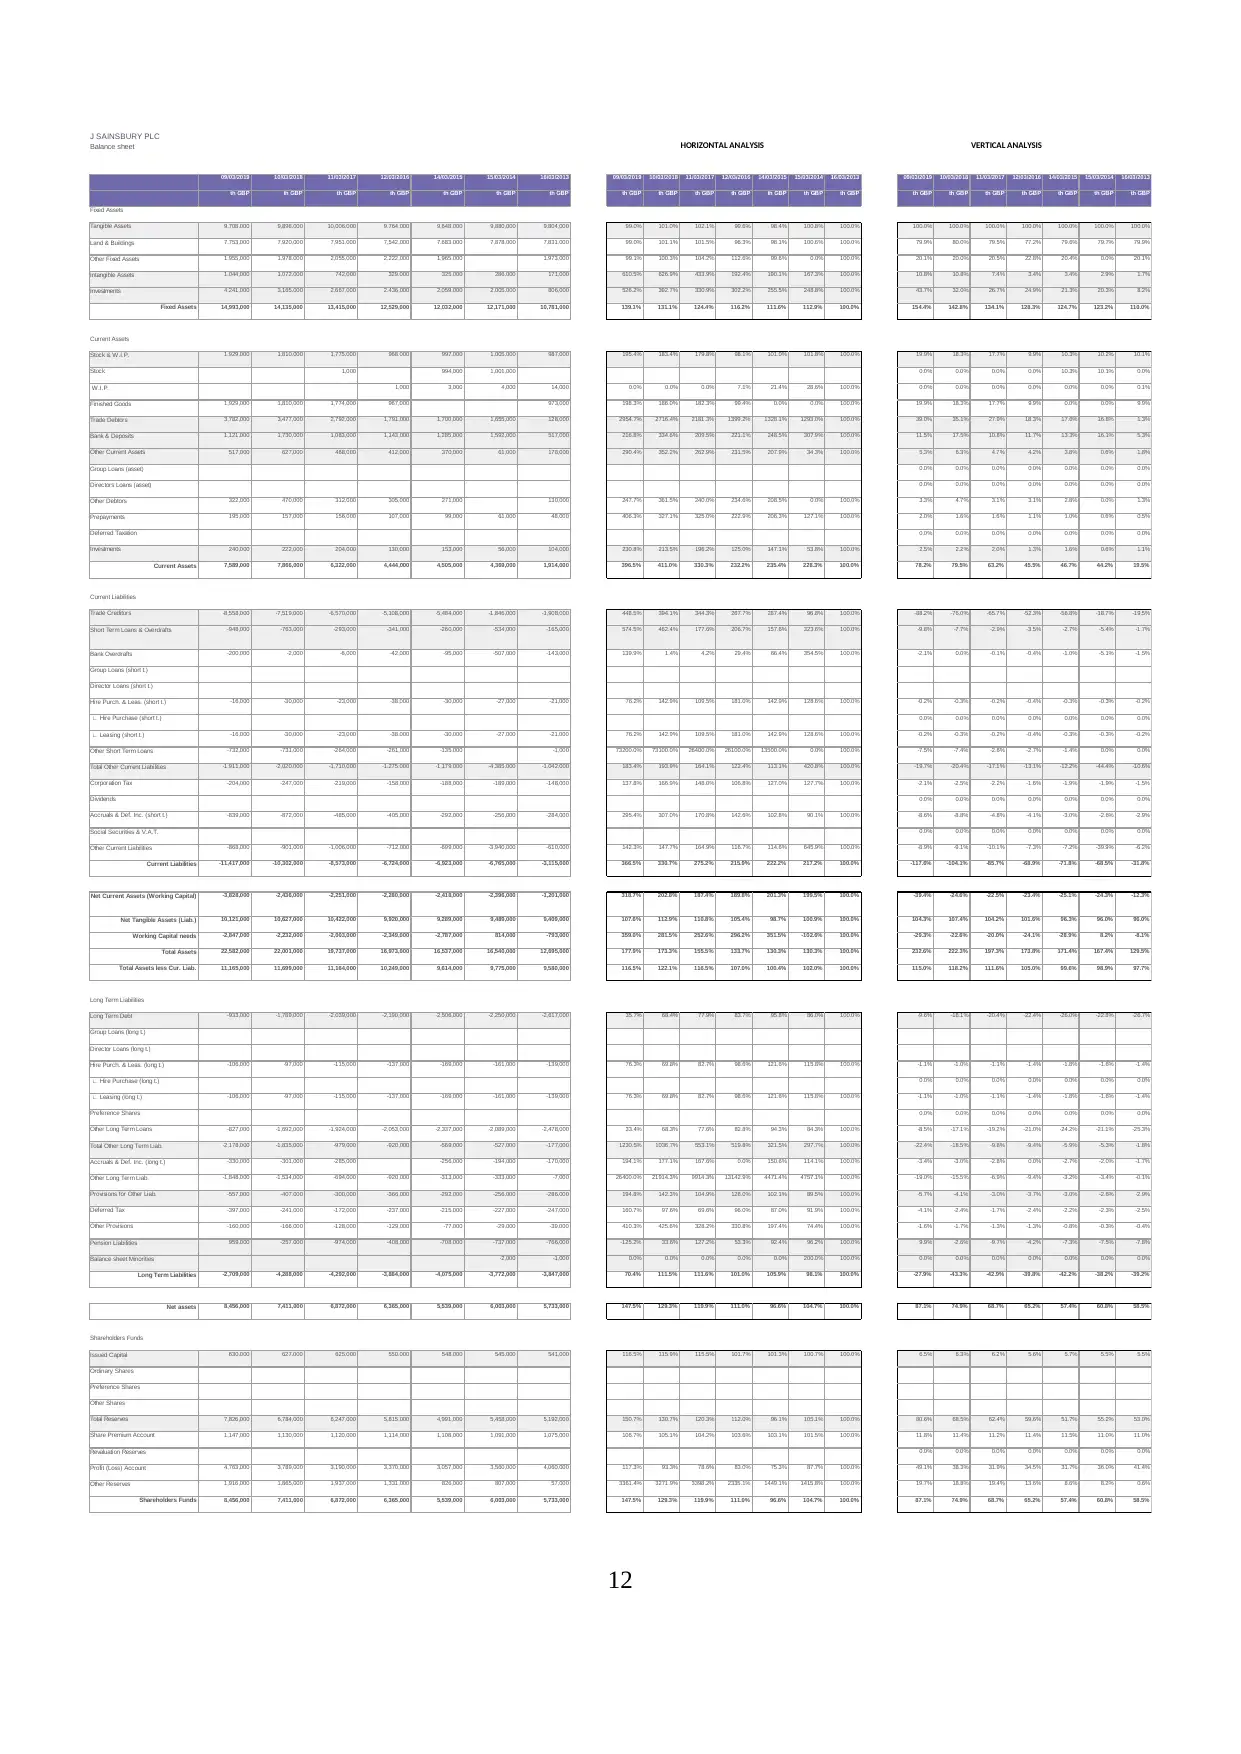
Appendix B – Balance Sheet Analysis
10
09/03/2019 10/03/2018 11/03/2017 12/03/2016 14/03/2015 15/03/2014 16/03/2013 09/03/2019 10/03/2018 11/03/2017 12/03/2016 14/03/2015 15/03/2014 16/03/2013 09/03/2019 10/03/2018 11/03/2017 12/03/2016 14/03/2015 15/03/2014 16/03/2013
th GBP th GBP th GBP th GBP th GBP th GBP th GBP th GBP th GBP th GBP th GBP th GBP th GBP th GBP th GBP th GBP th GBP th GBP th GBP th GBP th GBP
Turnover 29,007,000 28,456,000 26,224,000 23,506,000 23,775,000 23,949,000 23,303,000 124.5% 122.1% 112.5% 100.9% 102.0% 102.8% 100.0% 100.0% 100.0% 100.0% 100.0% 100.0% 100.0% 100.0%
∟ National Turnover 23,949,000 23,303,000 0.0% 0.0% 0.0% 0.0% 0.0% 102.8% 100.0% 0.0% 0.0% 0.0% 0.0% 0.0% 100.0% 100.0%
∟ Overseas Turnover 0.0% 0.0% 0.0% 0.0% 0.0% 0.0% 0.0%
Cost of Sales -27,000,000 -26,574,000 -24,590,000 -22,050,000 -22,567,000 -22,562,000 -22,026,000 122.6% 120.6% 111.6% 100.1% 102.5% 102.4% 100.0% -93.1% -93.4% -93.8% -93.8% -94.9% -94.2% -94.5%
Gross Profit 2,007,000 1,882,000 1,634,000 1,456,000 1,208,000 1,387,000 1,277,000 157.2% 147.4% 128.0% 114.0% 94.6% 108.6% 100.0% 6.9% 6.6% 6.2% 6.2% 5.1% 5.8% 5.5%
Administration Expenses -1,733,000 -1,415,000 -1,207,000 -850,000 -1,132,000 -444,000 -457,000 379.2% 309.6% 264.1% 186.0% 247.7% 97.2% 100.0% -6.0% -5.0% -4.6% -3.6% -4.8% -1.9% -2.0%
Other Operating Income/Costs pre OP 38,000 51,000 215,000 101,000 5,000 66,000 67,000 56.7% 76.1% 320.9% 150.7% 7.5% 98.5% 100.0% 0.1% 0.2% 0.8% 0.4% 0.0% 0.3% 0.3%
Exceptional Items pre OP 0.0% 0.0% 0.0% 0.0% 0.0% 0.0% 0.0%
Operating Profit 312,000 518,000 642,000 707,000 81,000 1,009,000 887,000 35.2% 58.4% 72.4% 79.7% 9.1% 113.8% 100.0% 1.1% 1.8% 2.4% 3.0% 0.3% 4.2% 3.8%
Other Income 4,000 12,000 -37,000 -11,000 8,000 28,000 24,000 16.7% 50.0% -154.2% -45.8% 33.3% 116.7% 100.0% 0.0% 0.0% -0.1% 0.0% 0.0% 0.1% 0.1%
Total Other Income & Int. Received 26,000 31,000 -3,000 8,000 27,000 48,000 43,000 60.5% 72.1% -7.0% 18.6% 62.8% 111.6% 100.0% 0.1% 0.1% 0.0% 0.0% 0.1% 0.2% 0.2%
Exceptional Items 0.0% 0.0% 0.0% 0.0% 0.0% 0.0% 0.0%
Profit (Loss) before Interest paid 338,000 549,000 639,000 715,000 108,000 1,057,000 930,000 36.3% 59.0% 68.7% 76.9% 11.6% 113.7% 100.0% 1.2% 1.9% 2.4% 3.0% 0.5% 4.4% 4.0%
Interest Received 22,000 19,000 34,000 19,000 19,000 20,000 19,000 115.8% 100.0% 178.9% 100.0% 100.0% 105.3% 100.0% 0.1% 0.1% 0.1% 0.1% 0.1% 0.1% 0.1%
Interest Paid -99,000 -140,000 -136,000 -167,000 -180,000 -159,000 -142,000 69.7% 98.6% 95.8% 117.6% 126.8% 112.0% 100.0% -0.3% -0.5% -0.5% -0.7% -0.8% -0.7% -0.6%
∟ Paid to Bank -151,000 0.0% 0.0% 0.0% 0.0% 0.0% -0.6% 0.0%
∟ Paid on Hire Purchase 0.0% 0.0% 0.0% 0.0% 0.0% 0.0% 0.0%
∟ Paid on Leasing -7,000 -7,000 -8,000 -9,000 -8,000 -7,000 100.0% 100.0% 114.3% 128.6% 0.0% 114.3% 100.0% 0.0% 0.0% 0.0% 0.0% 0.0% 0.0% 0.0%
∟ Other Interest Paid -92,000 -133,000 -128,000 -158,000 -180,000 -135,000 68.1% 98.5% 94.8% 117.0% 133.3% 0.0% 100.0% -0.3% -0.5% -0.5% -0.7% -0.8% 0.0% -0.6%
Net Interest -77,000 -121,000 -102,000 -148,000 -161,000 -139,000 -123,000 62.6% 98.4% 82.9% 120.3% 130.9% 113.0% 100.0% -0.3% -0.4% -0.4% -0.6% -0.7% -0.6% -0.5%
Profit (Loss) before Tax 239,000 409,000 503,000 548,000 -72,000 898,000 788,000 30.3% 51.9% 63.8% 69.5% -9.1% 114.0% 100.0% 0.8% 1.4% 1.9% 2.3% -0.3% 3.7% 3.4%
Taxation -20,000 -100,000 -126,000 -77,000 -94,000 -182,000 -174,000 11.5% 57.5% 72.4% 44.3% 54.0% 104.6% 100.0% -0.1% -0.4% -0.5% -0.3% -0.4% -0.8% -0.7%
Profit (Loss) after Tax 219,000 309,000 377,000 471,000 -166,000 716,000 614,000 35.7% 50.3% 61.4% 76.7% -27.0% 116.6% 100.0% 0.8% 1.1% 1.4% 2.0% -0.7% 3.0% 2.6%
Profit (Loss) for period [=Net income] 219,000 309,000 377,000 471,000 -166,000 716,000 614,000 35.7% 50.3% 61.4% 76.7% -27.0% 116.6% 100.0% 0.8% 1.1% 1.4% 2.0% -0.7% 3.0% 2.6%
Dividends -224,000 -212,000 -232,000 -234,000 -330,000 -320,000 -308,000 72.7% 68.8% 75.3% 76.0% 107.1% 103.9% 100.0% -0.8% -0.7% -0.9% -1.0% -1.4% -1.3% -1.3%
Retained Profit(Loss) -5,000 97,000 145,000 237,000 -496,000 396,000 306,000 -1.6% 31.7% 47.4% 77.5% -162.1% 129.4% 100.0% 0.0% 0.3% 0.6% 1.0% -2.1% 1.7% 1.3%
J SAINSBURY PLC
Profit & Loss account
Appendix B – Balance Sheet Analysis
10
Paraphrase This Document
Need a fresh take? Get an instant paraphrase of this document with our AI Paraphraser
HORIZONTAL ANALYSIS VERTICAL ANALYSIS
23/02/2019 24/02/2018 25/02/2017 27/02/2016 28/02/2015 22/02/2014 23/02/2013 23/02/2019 24/02/2018 25/02/2017 27/02/2016 28/02/2015 22/02/2014 23/02/2013 23/02/2019 24/02/2018 25/02/2017 27/02/2016 28/02/2015 22/02/2014 23/02/2013
th GBP th GBP th GBP th GBP th GBP th GBP th GBP th GBP th GBP th GBP th GBP th GBP th GBP th GBP th GBP th GBP th GBP th GBP th GBP th GBP th GBP
Fixed Assets
Tangible Assets 19,023,000 18,521,000 18,108,000 17,900,000 20,440,000 24,490,000 24,870,000 76.5% 74.5% 72.8% 72.0% 82.2% 98.5% 100.0% 100.0% 100.0% 100.0% 100.0% 100.0% 100.0% 100.0%
Land & Buildings 16,850,000 16,337,000 15,595,000 15,359,000 17,869,000 20,749,000 20,856,000 80.8% 78.3% 74.8% 73.6% 85.7% 99.5% 100.0% 88.6% 88.2% 86.1% 85.8% 87.4% 84.7% 83.9%
∟ Freehold Land 13,005,000 15,649,000 18,430,000 18,335,000 0.0% 0.0% 0.0% 70.9% 85.4% 100.5% 100.0% 0.0% 0.0% 0.0% 72.7% 76.6% 75.3% 73.7%
∟ Leasehold Land 2,354,000 2,220,000 2,319,000 2,521,000 0.0% 0.0% 0.0% 93.4% 88.1% 92.0% 100.0% 0.0% 0.0% 0.0% 13.2% 10.9% 9.5% 10.1%
Fixtures & Fittings 1,752,000 2,145,000 0.0% 9.5% 0.0% 12.0% 0.0% 0.0% 0.0%
Plant & Vehicles 316,000 252,000 0.0% 1.7% 0.0% 1.4% 0.0% 0.0% 0.0%
∟ Plant 0.0% 0.0% 0.0% 0.0% 0.0% 0.0% 0.0%
∟ Vehicles 316,000 252,000 0.0% 1.7% 0.0% 1.4% 0.0% 0.0% 0.0%
Other Fixed Assets 2,173,000 116,000 2,513,000 144,000 2,571,000 3,741,000 4,014,000 54.1% 2.9% 62.6% 3.6% 64.1% 93.2% 100.0% 11.4% 0.6% 13.9% 0.8% 12.6% 15.3% 16.1%
Intangible Assets 6,264,000 2,661,000 2,717,000 2,874,000 3,771,000 3,795,000 4,362,000 143.6% 61.0% 62.3% 65.9% 86.5% 87.0% 100.0% 32.9% 14.4% 15.0% 16.1% 18.4% 15.5% 17.5%
Investments 11,092,000 9,954,000 9,611,000 8,302,000 8,045,000 8,794,000 7,801,000 142.2% 127.6% 123.2% 106.4% 103.1% 112.7% 100.0% 58.3% 53.7% 53.1% 46.4% 39.4% 35.9% 31.4%
Fixed Assets 36,379,000 31,136,000 30,436,000 29,076,000 32,256,000 37,079,000 37,033,000 98.2% 84.1% 82.2% 78.5% 87.1% 100.1% 100.0% 191.2% 168.1% 168.1% 162.4% 157.8% 151.4% 148.9%
Current Assets
Stock & W.I.P. 2,617,000 2,263,000 2,301,000 2,430,000 2,957,000 3,576,000 3,744,000 69.9% 60.4% 61.5% 64.9% 79.0% 95.5% 100.0% 13.8% 12.2% 12.7% 13.6% 14.5% 14.6% 15.1%
Stock 0.0% 0.0% 0.0% 0.0% 0.0% 0.0% 0.0%
W.I.P. 6,000 4,000 25,000 40,000 132,000 109,000 101,000 5.9% 4.0% 24.8% 39.6% 130.7% 107.9% 100.0% 0.0% 0.0% 0.1% 0.2% 0.6% 0.4% 0.4%
Finished Goods 2,611,000 2,259,000 2,276,000 2,390,000 2,825,000 3,467,000 3,643,000 71.7% 62.0% 62.5% 65.6% 77.5% 95.2% 100.0% 13.7% 12.2% 12.6% 13.4% 13.8% 14.2% 14.6%
Trade Debtors 598,000 466,000 490,000 496,000 3.1% 2.5% 2.7% 2.8% 0.0% 0.0% 0.0%
Bank & Deposits 2,916,000 4,059,000 3,821,000 3,082,000 2,165,000 2,506,000 2,512,000 116.1% 161.6% 152.1% 122.7% 86.2% 99.8% 100.0% 15.3% 21.9% 21.1% 17.2% 10.6% 10.2% 10.1%
Other Current Assets 5,930,000 5,665,000 5,164,000 4,945,000 5,951,000 5,907,000 5,629,000 105.3% 100.6% 91.7% 87.8% 105.7% 104.9% 100.0% 31.2% 30.6% 28.5% 27.6% 29.1% 24.1% 22.6%
Group Loans (asset) 170,000 165,000 153,000 180,000 250,000 274,000 472,000 36.0% 35.0% 32.4% 38.1% 53.0% 58.1% 100.0% 0.9% 0.9% 0.8% 1.0% 1.2% 1.1% 1.9%
Directors Loans (asset) 0.0% 0.0% 0.0% 0.0% 0.0% 0.0% 0.0%
Other Debtors 5,160,000 4,910,000 4,469,000 4,310,000 5,150,000 5,233,000 4,730,000 109.1% 103.8% 94.5% 91.1% 108.9% 110.6% 100.0% 27.1% 26.5% 24.7% 24.1% 25.2% 21.4% 19.0%
Prepayments 594,000 578,000 529,000 440,000 535,000 388,000 417,000 142.4% 138.6% 126.9% 105.5% 128.3% 93.0% 100.0% 3.1% 3.1% 2.9% 2.5% 2.6% 1.6% 1.7%
Deferred Taxation 6,000 12,000 13,000 15,000 16,000 12,000 10,000 60.0% 120.0% 130.0% 150.0% 160.0% 120.0% 100.0% 0.0% 0.1% 0.1% 0.1% 0.1% 0.0% 0.0%
Investments 607,000 1,273,000 3,641,000 3,875,000 885,000 1,096,000 1,211,000 50.1% 105.1% 300.7% 320.0% 73.1% 90.5% 100.0% 3.2% 6.9% 20.1% 21.6% 4.3% 4.5% 4.9%
Current Assets 12,668,000 13,726,000 15,417,000 14,828,000 11,958,000 13,085,000 13,096,000 96.7% 104.8% 117.7% 113.2% 91.3% 99.9% 100.0% 66.6% 74.1% 85.1% 82.8% 58.5% 53.4% 52.7%
Current Liabilities
Trade Creditors -5,750,000 -5,416,000 -4,914,000 -4,545,000 -5,076,000 -5,831,000 -6,036,000 95.3% 89.7% 81.4% 75.3% 84.1% 96.6% 100.0% -30.2% -29.2% -27.1% -25.4% -24.8% -23.8% -24.3%
Short Term Loans & Overdrafts -10,451,000 -9,311,000 -9,264,000 -2,840,000 -2,031,000 -1,932,000 -799,000 1308.0% 1165.3% 1159.4% 355.4% 254.2% 241.8% 100.0% -54.9% -50.3% -51.2% -15.9% -9.9% -7.9% -3.2%
Bank Overdrafts -387,000 -351,000 -912,000 -1,982,000 -830,000 -730,000 53.0% 48.1% 124.9% 0.0% 271.5% 113.7% 100.0% -2.0% -1.9% -5.0% 0.0% -9.7% -3.4% -2.9%
Group Loans (short t.) -20,000 -26,000 -23,000 -20,000 -39,000 -22,000 -49,000 40.8% 53.1% 46.9% 40.8% 79.6% 44.9% 100.0% -0.1% -0.1% -0.1% -0.1% -0.2% -0.1% -0.2%
Director Loans (short t.) 0.0% 0.0% 0.0% 0.0% 0.0% 0.0% 0.0%
Hire Purch. & Leas. (short t.) -36,000 -12,000 -11,000 -11,000 -10,000 -6,000 -6,000 600.0% 200.0% 183.3% 183.3% 166.7% 100.0% 100.0% -0.2% -0.1% -0.1% -0.1% 0.0% 0.0% 0.0%
∟ Hire Purchase (short t.) 0.0% 0.0% 0.0% 0.0% 0.0% 0.0% 0.0%
∟ Leasing (short t.) -36,000 -12,000 -11,000 -11,000 -10,000 -6,000 -6,000 600.0% 200.0% 183.3% 183.3% 166.7% 100.0% 100.0% -0.2% -0.1% -0.1% -0.1% 0.0% 0.0% 0.0%
Other Short Term Loans -10,008,000 -8,922,000 -8,318,000 -2,809,000 -1,074,000 -14,000 71485.7% 63728.6% 59414.3% 20064.3% 0.0% 7671.4% 100.0% -52.6% -48.2% -45.9% -15.7% 0.0% -4.4% -0.1%
Total Other Current Liabilities -4,479,000 -4,511,000 -5,227,000 -12,329,000 -12,703,000 -13,636,000 -12,150,000 36.9% 37.1% 43.0% 101.5% 104.6% 112.2% 100.0% -23.5% -24.4% -28.9% -68.9% -62.1% -55.7% -48.9%
Corporation Tax -325,000 -335,000 -613,000 -419,000 -95,000 -494,000 -519,000 62.6% 64.5% 118.1% 80.7% 18.3% 95.2% 100.0% -1.7% -1.8% -3.4% -2.3% -0.5% -2.0% -2.1%
Dividends #DIV/0! #DIV/0! #DIV/0! #DIV/0! #DIV/0! #DIV/0! #DIV/0! 0.0% 0.0% 0.0% 0.0% 0.0% 0.0% 0.0%
Accruals & Def. Inc. (short t.) -1,230,000 -1,643,000 -1,536,000 -1,530,000 -1,759,000 -1,543,000 -1,835,000 67.0% 89.5% 83.7% 83.4% 95.9% 84.1% 100.0% -6.5% -8.9% -8.5% -8.5% -8.6% -6.3% -7.4%
Social Securities & V.A.T. -521,000 -334,000 -310,000 -388,000 -366,000 -399,000 -440,000 118.4% 75.9% 70.5% 88.2% 83.2% 90.7% 100.0% -2.7% -1.8% -1.7% -2.2% -1.8% -1.6% -1.8%
Other Current Liabilities -2,403,000 -2,199,000 -2,768,000 -9,992,000 -10,483,000 -11,200,000 -9,356,000 25.7% 23.5% 29.6% 106.8% 112.0% 119.7% 100.0% -12.6% -11.9% -15.3% -55.8% -51.3% -45.7% -37.6%
Current Liabilities -20,680,000 -19,238,000 -19,405,000 -19,714,000 -19,810,000 -21,399,000 -18,985,000 108.9% 101.3% 102.2% 103.8% 104.3% 112.7% 100.0% -108.7% -103.9% -107.2% -110.1% -96.9% -87.4% -76.3%
Net Current Assets (Working Capital) -8,012,000 -5,512,000 -3,988,000 -4,886,000 -7,852,000 -8,314,000 -5,889,000 136.1% 93.6% 67.7% 83.0% 133.3% 141.2% 100.0% -42.1% -29.8% -22.0% -27.3% -38.4% -33.9% -23.7%
Net Tangible Assets (Liab.) 22,103,000 22,963,000 23,731,000 21,316,000 20,633,000 24,970,000 26,782,000 82.5% 85.7% 88.6% 79.6% 77.0% 93.2% 100.0% 116.2% 124.0% 131.1% 119.1% 100.9% 102.0% 107.7%
Working Capital needs -2,535,000 -2,687,000 -2,123,000 -1,619,000 -2,119,000 -2,255,000 -2,292,000 110.6% 117.2% 92.6% 70.6% 92.5% 98.4% 100.0% -13.3% -14.5% -11.7% -9.0% -10.4% -9.2% -9.2%
Total Assets 49,047,000 44,862,000 45,853,000 43,904,000 44,214,000 50,164,000 50,129,000 97.8% 89.5% 91.5% 87.6% 88.2% 100.1% 100.0% 257.8% 242.2% 253.2% 245.3% 216.3% 204.8% 201.6%
Total Assets less Cur. Liab. 28,367,000 25,624,000 26,448,000 24,190,000 24,404,000 28,765,000 31,144,000 91.1% 82.3% 84.9% 77.7% 78.4% 92.4% 100.0% 149.1% 138.4% 146.1% 135.1% 119.4% 117.5% 125.2%
Long Term Liabilities
Long Term Debt -8,969,000 -10,114,000 -11,709,000 -10,711,000 -10,651,000 -9,303,000 -10,068,000 89.1% 100.5% 116.3% 106.4% 105.8% 92.4% 100.0% -47.1% -54.6% -64.7% -59.8% -52.1% -38.0% -40.5%
Group Loans (long t.) 0.0% 0.0% 0.0% 0.0% 0.0% 0.0% 0.0%
Director Loans (long t.) 0.0% 0.0% 0.0% 0.0% 0.0% 0.0% 0.0%
Hire Purch. & Leas. (long t.) -93,000 -110,000 -103,000 -88,000 -131,000 -115,000 -122,000 76.2% 90.2% 84.4% 72.1% 107.4% 94.3% 100.0% -0.5% -0.6% -0.6% -0.5% -0.6% -0.5% -0.5%
∟ Hire Purchase (long t.) 0.0% 0.0% 0.0% 0.0% 0.0% 0.0% 0.0%
∟ Leasing (long t.) -93,000 -110,000 -103,000 -88,000 -131,000 -115,000 -122,000 76.2% 90.2% 84.4% 72.1% 107.4% 94.3% 100.0% -0.5% -0.6% -0.6% -0.5% -0.6% -0.5% -0.5%
Preference Shares 0.0% 0.0% 0.0% 0.0% 0.0% 0.0% 0.0%
Other Long Term Loans -8,876,000 -10,004,000 -11,606,000 -10,623,000 -10,520,000 -9,188,000 -9,946,000 89.2% 100.6% 116.7% 106.8% 105.8% 92.4% 100.0% -46.7% -54.0% -64.1% -59.3% -51.5% -37.5% -40.0%
Total Other Long Term Liab. -773,000 -958,000 -931,000 -889,000 -946,000 -770,000 -759,000 101.8% 126.2% 122.7% 117.1% 124.6% 101.4% 100.0% -4.1% -5.2% -5.1% -5.0% -4.6% -3.1% -3.1%
Accruals & Def. Inc. (long t.) 0.0% 0.0% 0.0% 0.0% 0.0% 0.0% 0.0%
Other Long Term Liab. -773,000 -958,000 -931,000 -889,000 -946,000 -770,000 -759,000 101.8% 126.2% 122.7% 117.1% 124.6% 101.4% 100.0% -4.1% -5.2% -5.1% -5.0% -4.6% -3.1% -3.1%
Provisions for Other Liab. -983,000 -812,000 -773,000 -799,000 -894,000 -777,000 -1,278,000 76.9% 63.5% 60.5% 62.5% 70.0% 60.8% 100.0% -5.2% -4.4% -4.3% -4.5% -4.4% -3.2% -5.1%
Deferred Tax -236,000 -91,000 -88,000 -135,000 -199,000 -594,000 -1,006,000 23.5% 9.0% 8.7% 13.4% 19.8% 59.0% 100.0% -1.2% -0.5% -0.5% -0.8% -1.0% -2.4% -4.0%
Other Provisions -747,000 -721,000 -685,000 -664,000 -695,000 -183,000 -272,000 274.6% 265.1% 251.8% 244.1% 255.5% 67.3% 100.0% -3.9% -3.9% -3.8% -3.7% -3.4% -0.7% -1.1%
Pension Liabilities -2,808,000 -3,282,000 -6,621,000 -3,175,000 -4,842,000 -3,193,000 -2,378,000 118.1% 138.0% 278.4% 133.5% 203.6% 134.3% 100.0% -14.8% -17.7% -36.6% -17.7% -23.7% -13.0% -9.6%
Balance sheet Minorities 24,000 22,000 24,000 10,000 -7,000 -18,000 -133.3% -122.2% -133.3% -55.6% 0.0% 38.9% 100.0% 0.1% 0.1% 0.1% 0.1% 0.0% 0.0% -0.1%
Long Term Liabilities -13,509,000 -15,144,000 -20,010,000 -15,564,000 -17,333,000 -14,050,000 -14,501,000 93.2% 104.4% 138.0% 107.3% 119.5% 96.9% 100.0% -71.0% -81.8% -110.5% -86.9% -84.8% -57.4% -58.3%
Net assets 14,858,000 10,480,000 6,438,000 8,626,000 7,071,000 14,715,000 16,643,000 89.3% 63.0% 38.7% 51.8% 42.5% 88.4% 100.0% 78.1% 56.6% 35.6% 48.2% 34.6% 60.1% 66.9%
Shareholders Funds
Issued Capital 490,000 410,000 409,000 407,000 406,000 405,000 403,000 121.6% 101.7% 101.5% 101.0% 100.7% 100.5% 100.0% 2.6% 2.2% 2.3% 2.3% 2.0% 1.7% 1.6%
Total Reserves 14,368,000 10,070,000 6,029,000 8,219,000 6,665,000 14,310,000 16,240,000 88.5% 62.0% 37.1% 50.6% 41.0% 88.1% 100.0% 75.5% 54.4% 33.3% 45.9% 32.6% 58.4% 65.3%
TESCO PLC
Balance sheet
11
HORIZONTAL ANALYSIS VERTICAL ANALYSIS
09/03/2019 10/03/2018 11/03/2017 12/03/2016 14/03/2015 15/03/2014 16/03/2013 09/03/2019 10/03/2018 11/03/2017 12/03/2016 14/03/2015 15/03/2014 16/03/2013 09/03/2019 10/03/2018 11/03/2017 12/03/2016 14/03/2015 15/03/2014 16/03/2013
th GBP th GBP th GBP th GBP th GBP th GBP th GBP th GBP th GBP th GBP th GBP th GBP th GBP th GBP th GBP th GBP th GBP th GBP th GBP th GBP th GBP
Fixed Assets
Tangible Assets 9,708,000 9,898,000 10,006,000 9,764,000 9,648,000 9,880,000 9,804,000 99.0% 101.0% 102.1% 99.6% 98.4% 100.8% 100.0% 100.0% 100.0% 100.0% 100.0% 100.0% 100.0% 100.0%
Land & Buildings 7,753,000 7,920,000 7,951,000 7,542,000 7,683,000 7,878,000 7,831,000 99.0% 101.1% 101.5% 96.3% 98.1% 100.6% 100.0% 79.9% 80.0% 79.5% 77.2% 79.6% 79.7% 79.9%
Other Fixed Assets 1,955,000 1,978,000 2,055,000 2,222,000 1,965,000 1,973,000 99.1% 100.3% 104.2% 112.6% 99.6% 0.0% 100.0% 20.1% 20.0% 20.5% 22.8% 20.4% 0.0% 20.1%
Intangible Assets 1,044,000 1,072,000 742,000 329,000 325,000 286,000 171,000 610.5% 626.9% 433.9% 192.4% 190.1% 167.3% 100.0% 10.8% 10.8% 7.4% 3.4% 3.4% 2.9% 1.7%
Investments 4,241,000 3,165,000 2,667,000 2,436,000 2,059,000 2,005,000 806,000 526.2% 392.7% 330.9% 302.2% 255.5% 248.8% 100.0% 43.7% 32.0% 26.7% 24.9% 21.3% 20.3% 8.2%
Fixed Assets 14,993,000 14,135,000 13,415,000 12,529,000 12,032,000 12,171,000 10,781,000 139.1% 131.1% 124.4% 116.2% 111.6% 112.9% 100.0% 154.4% 142.8% 134.1% 128.3% 124.7% 123.2% 110.0%
Current Assets
Stock & W.I.P. 1,929,000 1,810,000 1,775,000 968,000 997,000 1,005,000 987,000 195.4% 183.4% 179.8% 98.1% 101.0% 101.8% 100.0% 19.9% 18.3% 17.7% 9.9% 10.3% 10.2% 10.1%
Stock 1,000 994,000 1,001,000 0.0% 0.0% 0.0% 0.0% 10.3% 10.1% 0.0%
W.I.P. 1,000 3,000 4,000 14,000 0.0% 0.0% 0.0% 7.1% 21.4% 28.6% 100.0% 0.0% 0.0% 0.0% 0.0% 0.0% 0.0% 0.1%
Finished Goods 1,929,000 1,810,000 1,774,000 967,000 973,000 198.3% 186.0% 182.3% 99.4% 0.0% 0.0% 100.0% 19.9% 18.3% 17.7% 9.9% 0.0% 0.0% 9.9%
Trade Debtors 3,782,000 3,477,000 2,792,000 1,791,000 1,700,000 1,655,000 128,000 2954.7% 2716.4% 2181.3% 1399.2% 1328.1% 1293.0% 100.0% 39.0% 35.1% 27.9% 18.3% 17.6% 16.8% 1.3%
Bank & Deposits 1,121,000 1,730,000 1,083,000 1,143,000 1,285,000 1,592,000 517,000 216.8% 334.6% 209.5% 221.1% 248.5% 307.9% 100.0% 11.5% 17.5% 10.8% 11.7% 13.3% 16.1% 5.3%
Other Current Assets 517,000 627,000 468,000 412,000 370,000 61,000 178,000 290.4% 352.2% 262.9% 231.5% 207.9% 34.3% 100.0% 5.3% 6.3% 4.7% 4.2% 3.8% 0.6% 1.8%
Group Loans (asset) 0.0% 0.0% 0.0% 0.0% 0.0% 0.0% 0.0%
Directors Loans (asset) 0.0% 0.0% 0.0% 0.0% 0.0% 0.0% 0.0%
Other Debtors 322,000 470,000 312,000 305,000 271,000 130,000 247.7% 361.5% 240.0% 234.6% 208.5% 0.0% 100.0% 3.3% 4.7% 3.1% 3.1% 2.8% 0.0% 1.3%
Prepayments 195,000 157,000 156,000 107,000 99,000 61,000 48,000 406.3% 327.1% 325.0% 222.9% 206.3% 127.1% 100.0% 2.0% 1.6% 1.6% 1.1% 1.0% 0.6% 0.5%
Deferred Taxation 0.0% 0.0% 0.0% 0.0% 0.0% 0.0% 0.0%
Investments 240,000 222,000 204,000 130,000 153,000 56,000 104,000 230.8% 213.5% 196.2% 125.0% 147.1% 53.8% 100.0% 2.5% 2.2% 2.0% 1.3% 1.6% 0.6% 1.1%
Current Assets 7,589,000 7,866,000 6,322,000 4,444,000 4,505,000 4,369,000 1,914,000 396.5% 411.0% 330.3% 232.2% 235.4% 228.3% 100.0% 78.2% 79.5% 63.2% 45.5% 46.7% 44.2% 19.5%
Current Liabilities
Trade Creditors -8,558,000 -7,519,000 -6,570,000 -5,108,000 -5,484,000 -1,846,000 -1,908,000 448.5% 394.1% 344.3% 267.7% 287.4% 96.8% 100.0% -88.2% -76.0% -65.7% -52.3% -56.8% -18.7% -19.5%
Short Term Loans & Overdrafts -948,000 -763,000 -293,000 -341,000 -260,000 -534,000 -165,000 574.5% 462.4% 177.6% 206.7% 157.6% 323.6% 100.0% -9.8% -7.7% -2.9% -3.5% -2.7% -5.4% -1.7%
Bank Overdrafts -200,000 -2,000 -6,000 -42,000 -95,000 -507,000 -143,000 139.9% 1.4% 4.2% 29.4% 66.4% 354.5% 100.0% -2.1% 0.0% -0.1% -0.4% -1.0% -5.1% -1.5%
Group Loans (short t.)
Director Loans (short t.)
Hire Purch. & Leas. (short t.) -16,000 -30,000 -23,000 -38,000 -30,000 -27,000 -21,000 76.2% 142.9% 109.5% 181.0% 142.9% 128.6% 100.0% -0.2% -0.3% -0.2% -0.4% -0.3% -0.3% -0.2%
∟ Hire Purchase (short t.) 0.0% 0.0% 0.0% 0.0% 0.0% 0.0% 0.0%
∟ Leasing (short t.) -16,000 -30,000 -23,000 -38,000 -30,000 -27,000 -21,000 76.2% 142.9% 109.5% 181.0% 142.9% 128.6% 100.0% -0.2% -0.3% -0.2% -0.4% -0.3% -0.3% -0.2%
Other Short Term Loans -732,000 -731,000 -264,000 -261,000 -135,000 -1,000 73200.0% 73100.0% 26400.0% 26100.0% 13500.0% 0.0% 100.0% -7.5% -7.4% -2.6% -2.7% -1.4% 0.0% 0.0%
Total Other Current Liabilities -1,911,000 -2,020,000 -1,710,000 -1,275,000 -1,179,000 -4,385,000 -1,042,000 183.4% 193.9% 164.1% 122.4% 113.1% 420.8% 100.0% -19.7% -20.4% -17.1% -13.1% -12.2% -44.4% -10.6%
Corporation Tax -204,000 -247,000 -219,000 -158,000 -188,000 -189,000 -148,000 137.8% 166.9% 148.0% 106.8% 127.0% 127.7% 100.0% -2.1% -2.5% -2.2% -1.6% -1.9% -1.9% -1.5%
Dividends 0.0% 0.0% 0.0% 0.0% 0.0% 0.0% 0.0%
Accruals & Def. Inc. (short t.) -839,000 -872,000 -485,000 -405,000 -292,000 -256,000 -284,000 295.4% 307.0% 170.8% 142.6% 102.8% 90.1% 100.0% -8.6% -8.8% -4.8% -4.1% -3.0% -2.6% -2.9%
Social Securities & V.A.T. 0.0% 0.0% 0.0% 0.0% 0.0% 0.0% 0.0%
Other Current Liabilities -868,000 -901,000 -1,006,000 -712,000 -699,000 -3,940,000 -610,000 142.3% 147.7% 164.9% 116.7% 114.6% 645.9% 100.0% -8.9% -9.1% -10.1% -7.3% -7.2% -39.9% -6.2%
Current Liabilities -11,417,000 -10,302,000 -8,573,000 -6,724,000 -6,923,000 -6,765,000 -3,115,000 366.5% 330.7% 275.2% 215.9% 222.2% 217.2% 100.0% -117.6% -104.1% -85.7% -68.9% -71.8% -68.5% -31.8%
Net Current Assets (Working Capital) -3,828,000 -2,436,000 -2,251,000 -2,280,000 -2,418,000 -2,396,000 -1,201,000 318.7% 202.8% 187.4% 189.8% 201.3% 199.5% 100.0% -39.4% -24.6% -22.5% -23.4% -25.1% -24.3% -12.3%
Net Tangible Assets (Liab.) 10,121,000 10,627,000 10,422,000 9,920,000 9,289,000 9,489,000 9,409,000 107.6% 112.9% 110.8% 105.4% 98.7% 100.9% 100.0% 104.3% 107.4% 104.2% 101.6% 96.3% 96.0% 96.0%
Working Capital needs -2,847,000 -2,232,000 -2,003,000 -2,349,000 -2,787,000 814,000 -793,000 359.0% 281.5% 252.6% 296.2% 351.5% -102.6% 100.0% -29.3% -22.6% -20.0% -24.1% -28.9% 8.2% -8.1%
Total Assets 22,582,000 22,001,000 19,737,000 16,973,000 16,537,000 16,540,000 12,695,000 177.9% 173.3% 155.5% 133.7% 130.3% 130.3% 100.0% 232.6% 222.3% 197.3% 173.8% 171.4% 167.4% 129.5%
Total Assets less Cur. Liab. 11,165,000 11,699,000 11,164,000 10,249,000 9,614,000 9,775,000 9,580,000 116.5% 122.1% 116.5% 107.0% 100.4% 102.0% 100.0% 115.0% 118.2% 111.6% 105.0% 99.6% 98.9% 97.7%
Long Term Liabilities
Long Term Debt -933,000 -1,789,000 -2,039,000 -2,190,000 -2,506,000 -2,250,000 -2,617,000 35.7% 68.4% 77.9% 83.7% 95.8% 86.0% 100.0% -9.6% -18.1% -20.4% -22.4% -26.0% -22.8% -26.7%
Group Loans (long t.)
Director Loans (long t.)
Hire Purch. & Leas. (long t.) -106,000 -97,000 -115,000 -137,000 -169,000 -161,000 -139,000 76.3% 69.8% 82.7% 98.6% 121.6% 115.8% 100.0% -1.1% -1.0% -1.1% -1.4% -1.8% -1.6% -1.4%
∟ Hire Purchase (long t.) 0.0% 0.0% 0.0% 0.0% 0.0% 0.0% 0.0%
∟ Leasing (long t.) -106,000 -97,000 -115,000 -137,000 -169,000 -161,000 -139,000 76.3% 69.8% 82.7% 98.6% 121.6% 115.8% 100.0% -1.1% -1.0% -1.1% -1.4% -1.8% -1.6% -1.4%
Preference Shares 0.0% 0.0% 0.0% 0.0% 0.0% 0.0% 0.0%
Other Long Term Loans -827,000 -1,692,000 -1,924,000 -2,053,000 -2,337,000 -2,089,000 -2,478,000 33.4% 68.3% 77.6% 82.8% 94.3% 84.3% 100.0% -8.5% -17.1% -19.2% -21.0% -24.2% -21.1% -25.3%
Total Other Long Term Liab. -2,178,000 -1,835,000 -979,000 -920,000 -569,000 -527,000 -177,000 1230.5% 1036.7% 553.1% 519.8% 321.5% 297.7% 100.0% -22.4% -18.5% -9.8% -9.4% -5.9% -5.3% -1.8%
Accruals & Def. Inc. (long t.) -330,000 -301,000 -285,000 -256,000 -194,000 -170,000 194.1% 177.1% 167.6% 0.0% 150.6% 114.1% 100.0% -3.4% -3.0% -2.8% 0.0% -2.7% -2.0% -1.7%
Other Long Term Liab. -1,848,000 -1,534,000 -694,000 -920,000 -313,000 -333,000 -7,000 26400.0% 21914.3% 9914.3% 13142.9% 4471.4% 4757.1% 100.0% -19.0% -15.5% -6.9% -9.4% -3.2% -3.4% -0.1%
Provisions for Other Liab. -557,000 -407,000 -300,000 -366,000 -292,000 -256,000 -286,000 194.8% 142.3% 104.9% 128.0% 102.1% 89.5% 100.0% -5.7% -4.1% -3.0% -3.7% -3.0% -2.6% -2.9%
Deferred Tax -397,000 -241,000 -172,000 -237,000 -215,000 -227,000 -247,000 160.7% 97.6% 69.6% 96.0% 87.0% 91.9% 100.0% -4.1% -2.4% -1.7% -2.4% -2.2% -2.3% -2.5%
Other Provisions -160,000 -166,000 -128,000 -129,000 -77,000 -29,000 -39,000 410.3% 425.6% 328.2% 330.8% 197.4% 74.4% 100.0% -1.6% -1.7% -1.3% -1.3% -0.8% -0.3% -0.4%
Pension Liabilities 959,000 -257,000 -974,000 -408,000 -708,000 -737,000 -766,000 -125.2% 33.6% 127.2% 53.3% 92.4% 96.2% 100.0% 9.9% -2.6% -9.7% -4.2% -7.3% -7.5% -7.8%
Balance sheet Minorities -2,000 -1,000 0.0% 0.0% 0.0% 0.0% 0.0% 200.0% 100.0% 0.0% 0.0% 0.0% 0.0% 0.0% 0.0% 0.0%
Long Term Liabilities -2,709,000 -4,288,000 -4,292,000 -3,884,000 -4,075,000 -3,772,000 -3,847,000 70.4% 111.5% 111.6% 101.0% 105.9% 98.1% 100.0% -27.9% -43.3% -42.9% -39.8% -42.2% -38.2% -39.2%
Net assets 8,456,000 7,411,000 6,872,000 6,365,000 5,539,000 6,003,000 5,733,000 147.5% 129.3% 119.9% 111.0% 96.6% 104.7% 100.0% 87.1% 74.9% 68.7% 65.2% 57.4% 60.8% 58.5%
Shareholders Funds
Issued Capital 630,000 627,000 625,000 550,000 548,000 545,000 541,000 116.5% 115.9% 115.5% 101.7% 101.3% 100.7% 100.0% 6.5% 6.3% 6.2% 5.6% 5.7% 5.5% 5.5%
Ordinary Shares
Preference Shares
Other Shares
Total Reserves 7,826,000 6,784,000 6,247,000 5,815,000 4,991,000 5,458,000 5,192,000 150.7% 130.7% 120.3% 112.0% 96.1% 105.1% 100.0% 80.6% 68.5% 62.4% 59.6% 51.7% 55.2% 53.0%
Share Premium Account 1,147,000 1,130,000 1,120,000 1,114,000 1,108,000 1,091,000 1,075,000 106.7% 105.1% 104.2% 103.6% 103.1% 101.5% 100.0% 11.8% 11.4% 11.2% 11.4% 11.5% 11.0% 11.0%
Revaluation Reserves 0.0% 0.0% 0.0% 0.0% 0.0% 0.0% 0.0%
Profit (Loss) Account 4,763,000 3,789,000 3,190,000 3,370,000 3,057,000 3,560,000 4,060,000 117.3% 93.3% 78.6% 83.0% 75.3% 87.7% 100.0% 49.1% 38.3% 31.9% 34.5% 31.7% 36.0% 41.4%
Other Reserves 1,916,000 1,865,000 1,937,000 1,331,000 826,000 807,000 57,000 3361.4% 3271.9% 3398.2% 2335.1% 1449.1% 1415.8% 100.0% 19.7% 18.8% 19.4% 13.6% 8.6% 8.2% 0.6%
Shareholders Funds 8,456,000 7,411,000 6,872,000 6,365,000 5,539,000 6,003,000 5,733,000 147.5% 129.3% 119.9% 111.0% 96.6% 104.7% 100.0% 87.1% 74.9% 68.7% 65.2% 57.4% 60.8% 58.5%
J SAINSBURY PLC
Balance sheet
12
⊘ This is a preview!⊘
Do you want full access?
Subscribe today to unlock all pages.
Trusted by 1+ million students worldwide
1 out of 15
Related Documents


Your All-in-One AI-Powered Toolkit for Academic Success.
+13062052269
info@desklib.com
Available 24*7 on WhatsApp / Email
![[object Object]](/_next/static/media/star-bottom.7253800d.svg)
Unlock your academic potential
Copyright © 2020–2026 A2Z Services. All Rights Reserved. Developed and managed by ZUCOL.