Financial Analysis of Sainsbury's plc: Performance and Management
VerifiedAdded on 2023/01/18
|23
|5812
|43
Report
AI Summary
This report offers a detailed financial analysis of Sainsbury's plc, examining its performance and position over a period of time. It begins with an executive summary and an introduction that highlights the significance of accounting and finance in managing a company's monetary resources. The main body includes a macro and micro environmental analysis using PESTLE and SWOT analysis. The report then dives into a comprehensive ratio analysis, including profitability, liquidity, and efficiency ratios, to assess Sainsbury's financial health. The analysis covers the years 2016 to 2019, providing insights into trends and potential areas of concern. Furthermore, the report explores various management and financial accounting techniques used by Sainsbury's. The report concludes with a summary of findings, highlighting the company's strengths and weaknesses, and is supported by appendices and references. This assignment provides a comprehensive overview of Sainsbury's financial standing and offers valuable insights for stakeholders and potential business partners.

ACCOUNTING AND
FINANCE
FINANCE
Paraphrase This Document
Need a fresh take? Get an instant paraphrase of this document with our AI Paraphraser
Table of Contents
EXECUTIVE SUMMARY...................................................................................................3
INTRODUCTION...............................................................................................................3
MAIN BODY.......................................................................................................................3
Part (a) Analysis of financial performance and position.................................................3
Part (b) Management and financial management techniques.....................................10
CONCLUSION.................................................................................................................15
APPENDICES..................................................................................................................16
REFERENCES................................................................................................................20
EXECUTIVE SUMMARY
The project report summarise about financial performance of Sainsbury's plc so
that they small manufacturer can decide about whether they should make transaction
with them or not. In order to make it suitable, different kinds of ratios are calculated
which shows that company's financial performance is not so effective. In addition, the
report abstracts about different number of techniques of management and financial
accounting that are widely used by manager of Sainsbury's plc.
INTRODUCTION
The term accounting and finance play a significant role in aspect of proper
management of monetary resources of companies. Accounting can be defined as a way
of recording financial transactions in systematic manner for a particular time period
(Cleary and Quinn, 2016). If companies records their transactions in an effective then it
becomes easier for them to focus on better utilisation of available financial resources.
The aim of project report is demonstrate understanding about benefits to suppliers
because of merger. The project report is based on Sainsbury's plc financial analysis so
that small companies can take decision about whether they should enter in business
with them or not. The project report is categorised into two parts A & B. The part A
covers about CORE analysis of Sainsbury company. As well as part B includes
information regards to various techniques of management and financial accounting.
MAIN BODY
Part (a) Analysis of financial performance and position.
An analysis of Sainsbury's plc by help of core analysis.
Macro environment analysis- In order to do an effective macro environment analysis
there is a technique which is PESTLE analysis technique. In the context of above
Sainsbury company, it is done below:
PESTLE analysis-
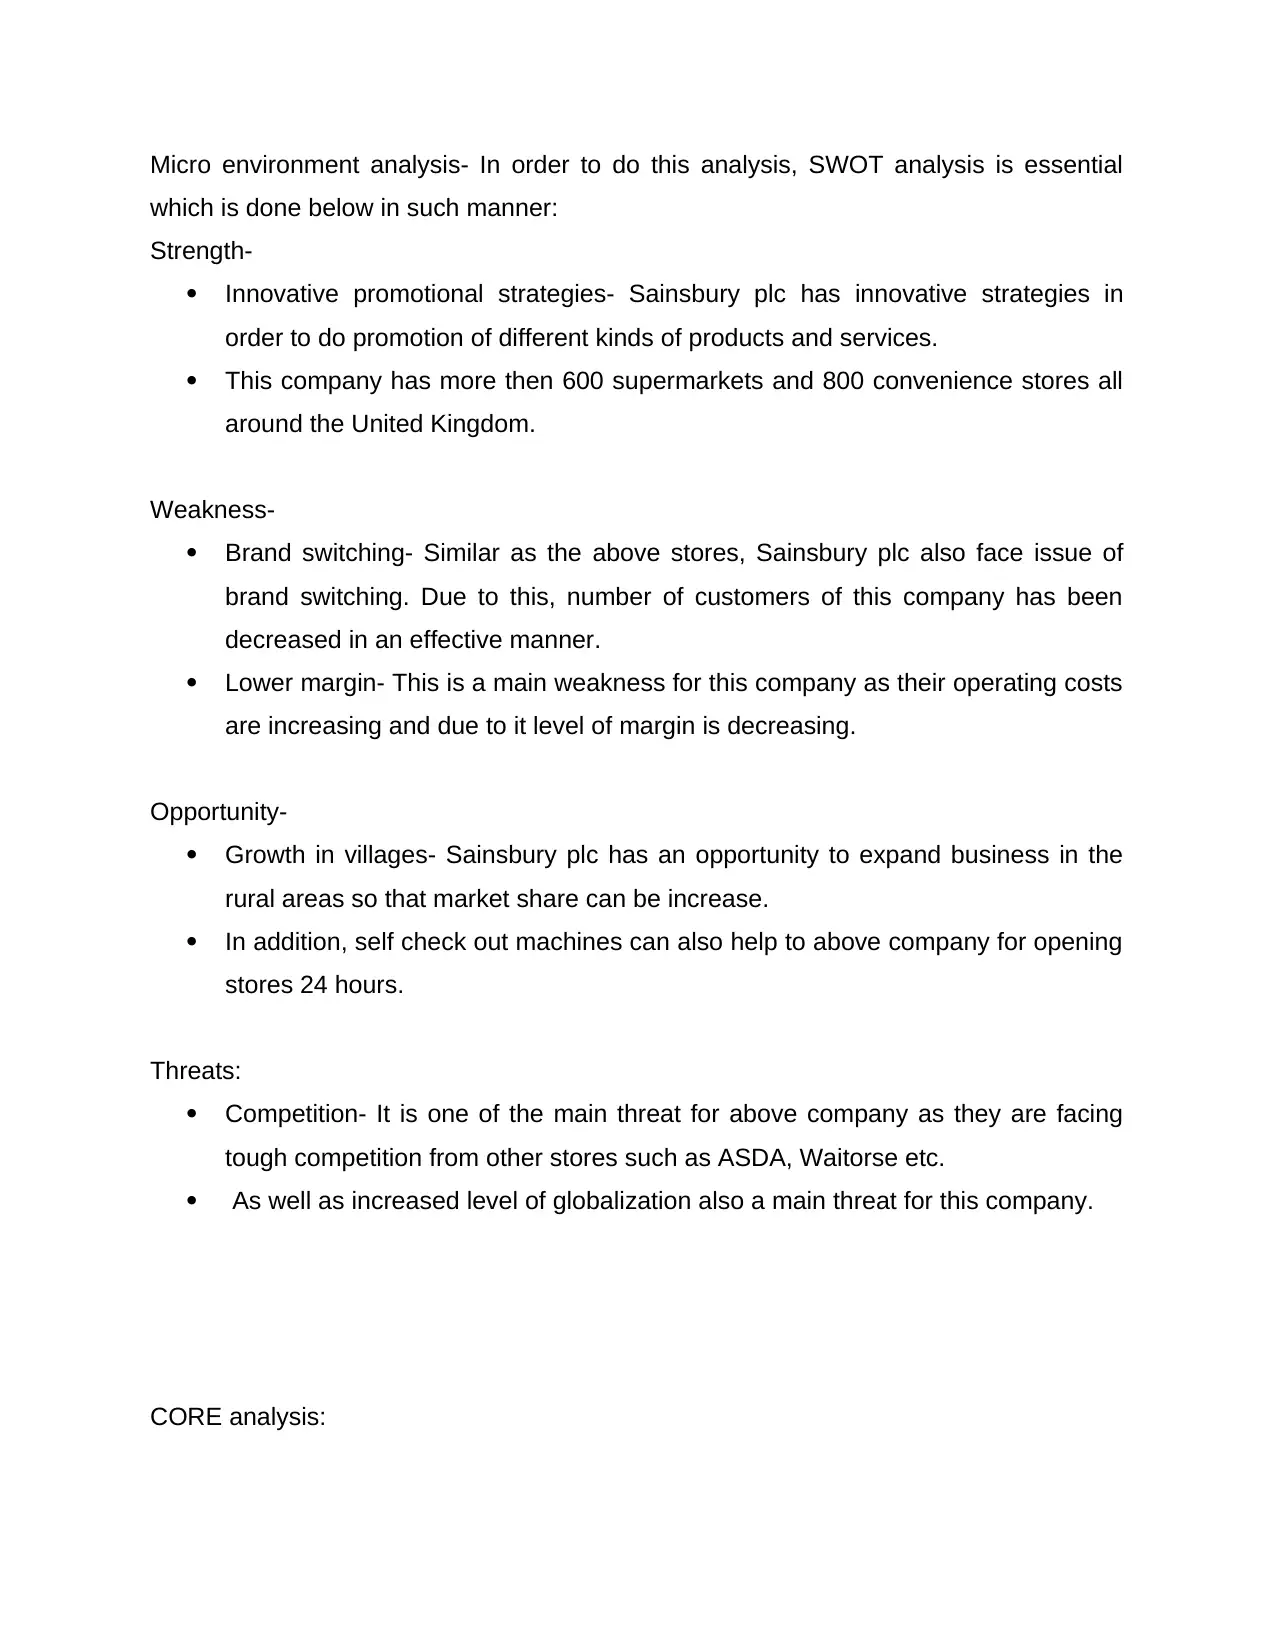
Political factor- This factor is related to the political condition of a nation, relation of a
country with others and many more. It can impact to business entities in both positive
The project report summarise about financial performance of Sainsbury's plc so
that they small manufacturer can decide about whether they should make transaction
with them or not. In order to make it suitable, different kinds of ratios are calculated
which shows that company's financial performance is not so effective. In addition, the
report abstracts about different number of techniques of management and financial
accounting that are widely used by manager of Sainsbury's plc.
INTRODUCTION
The term accounting and finance play a significant role in aspect of proper
management of monetary resources of companies. Accounting can be defined as a way
of recording financial transactions in systematic manner for a particular time period
(Cleary and Quinn, 2016). If companies records their transactions in an effective then it
becomes easier for them to focus on better utilisation of available financial resources.
The aim of project report is demonstrate understanding about benefits to suppliers
because of merger. The project report is based on Sainsbury's plc financial analysis so
that small companies can take decision about whether they should enter in business
with them or not. The project report is categorised into two parts A & B. The part A
covers about CORE analysis of Sainsbury company. As well as part B includes
information regards to various techniques of management and financial accounting.
MAIN BODY
Part (a) Analysis of financial performance and position.
An analysis of Sainsbury's plc by help of core analysis.
Macro environment analysis- In order to do an effective macro environment analysis
there is a technique which is PESTLE analysis technique. In the context of above
Sainsbury company, it is done below:
PESTLE analysis-
Political factor- This factor is related to the political condition of a nation, relation of a
country with others and many more. It can impact to business entities in both positive
⊘ This is a preview!⊘
Do you want full access?
Subscribe today to unlock all pages.
Trusted by 1+ million students worldwide
and negative manner. Sainsbury plc can be affected from this if political condition in UK
will not stable. This is so because they will not be able to do business with other
countries in the case of unstable political condition.
Economical factor- Under this factor various types of economical elements are included
such as interest rate, inflation rate and many more. These aspects can affect company's
performance. It is so because if interest rate will be lower in the market of UK, then this
will be easier for above company to acquire funds at low cost.
Social factor- It is related with different social aspects like people' s like dislike, culture,
tradition and many more. This becomes essential for companies to follow all these
aspects of any nation. Such as for Sainsbury company, it is crucial to them to offer
product and services in accordance of culture and religion of a country in which they are
operating.
Technological factor- It is one of the key factor for companies because technology is
upgrading day by day. This becomes essential for business entities to adopt new and
advanced techniques in their operations and activities. Like for above company, it is
essential to apply new techniques so that they may attract more number of customers.
Legal factor- This becomes essential for businesses to implement various kinds of rules,
regulations and legislation to protect rights of employees & customers. Such as for
Sainsbury plc, it is necessary for them to apply different legislation like equal payment
law for employees.
Environmental factor- This is aligned with environmental condition of any nation. It is not
under control of a business entity. For example if in UK, environmental situation is not
suitable then this may affect business of Sainsbury company.
Paraphrase This Document
Need a fresh take? Get an instant paraphrase of this document with our AI Paraphraser
Micro environment analysis- In order to do this analysis, SWOT analysis is essential
which is done below in such manner:
Strength-
Innovative promotional strategies- Sainsbury plc has innovative strategies in
order to do promotion of different kinds of products and services.
This company has more then 600 supermarkets and 800 convenience stores all
around the United Kingdom.
Weakness-
Brand switching- Similar as the above stores, Sainsbury plc also face issue of
brand switching. Due to this, number of customers of this company has been
decreased in an effective manner.
Lower margin- This is a main weakness for this company as their operating costs
are increasing and due to it level of margin is decreasing.
Opportunity-
Growth in villages- Sainsbury plc has an opportunity to expand business in the
rural areas so that market share can be increase.
In addition, self check out machines can also help to above company for opening
stores 24 hours.
Threats:
Competition- It is one of the main threat for above company as they are facing
tough competition from other stores such as ASDA, Waitorse etc.
As well as increased level of globalization also a main threat for this company.
CORE analysis:
Context- The Sainsbury's plc is third largest chain of supermarket in United Kingdom
and their share in supermarket sector is of 15.3%. This company was founded in year
1869 by John James Sainsbury. The ownership of company is public limited and there
are about 1415 shops in entire United Kingdom. As per the published information in
year 2018, there are about 186900 employees in different stores of United Kingdom
(About Sainsbury's plc, 2019).
Overview- The above Sainsbury's plc is one of the leading food retailer in United
Kingdom and it is registered with LSE and FTSE 100. The company produces and sales
a vital range of products such as food product, clothing and daily using commodities.
The company operates in supermarket field and face tough competition from others
such as Tesco, Morrisons and many more. In order to gain higher value of profitability,
this company merged with ASDA which can be beneficial for external stakeholders.
Ratio- In the aspect of better financial analysis of companies performance, the ratio
analysis play a key role. It is so because by help of calculating and analysis different
number of ratios, this becomes easier to companies in finding strengths and
weaknesses. As per it, their managers prepare and formulae strategies. As well as
stakeholders get aware about actual financial position of companies and accordingly
make investment. In the aspect of above Sainsbury's plc, ratio analysis is done below
that is as follows:
1. Profitability ratio:
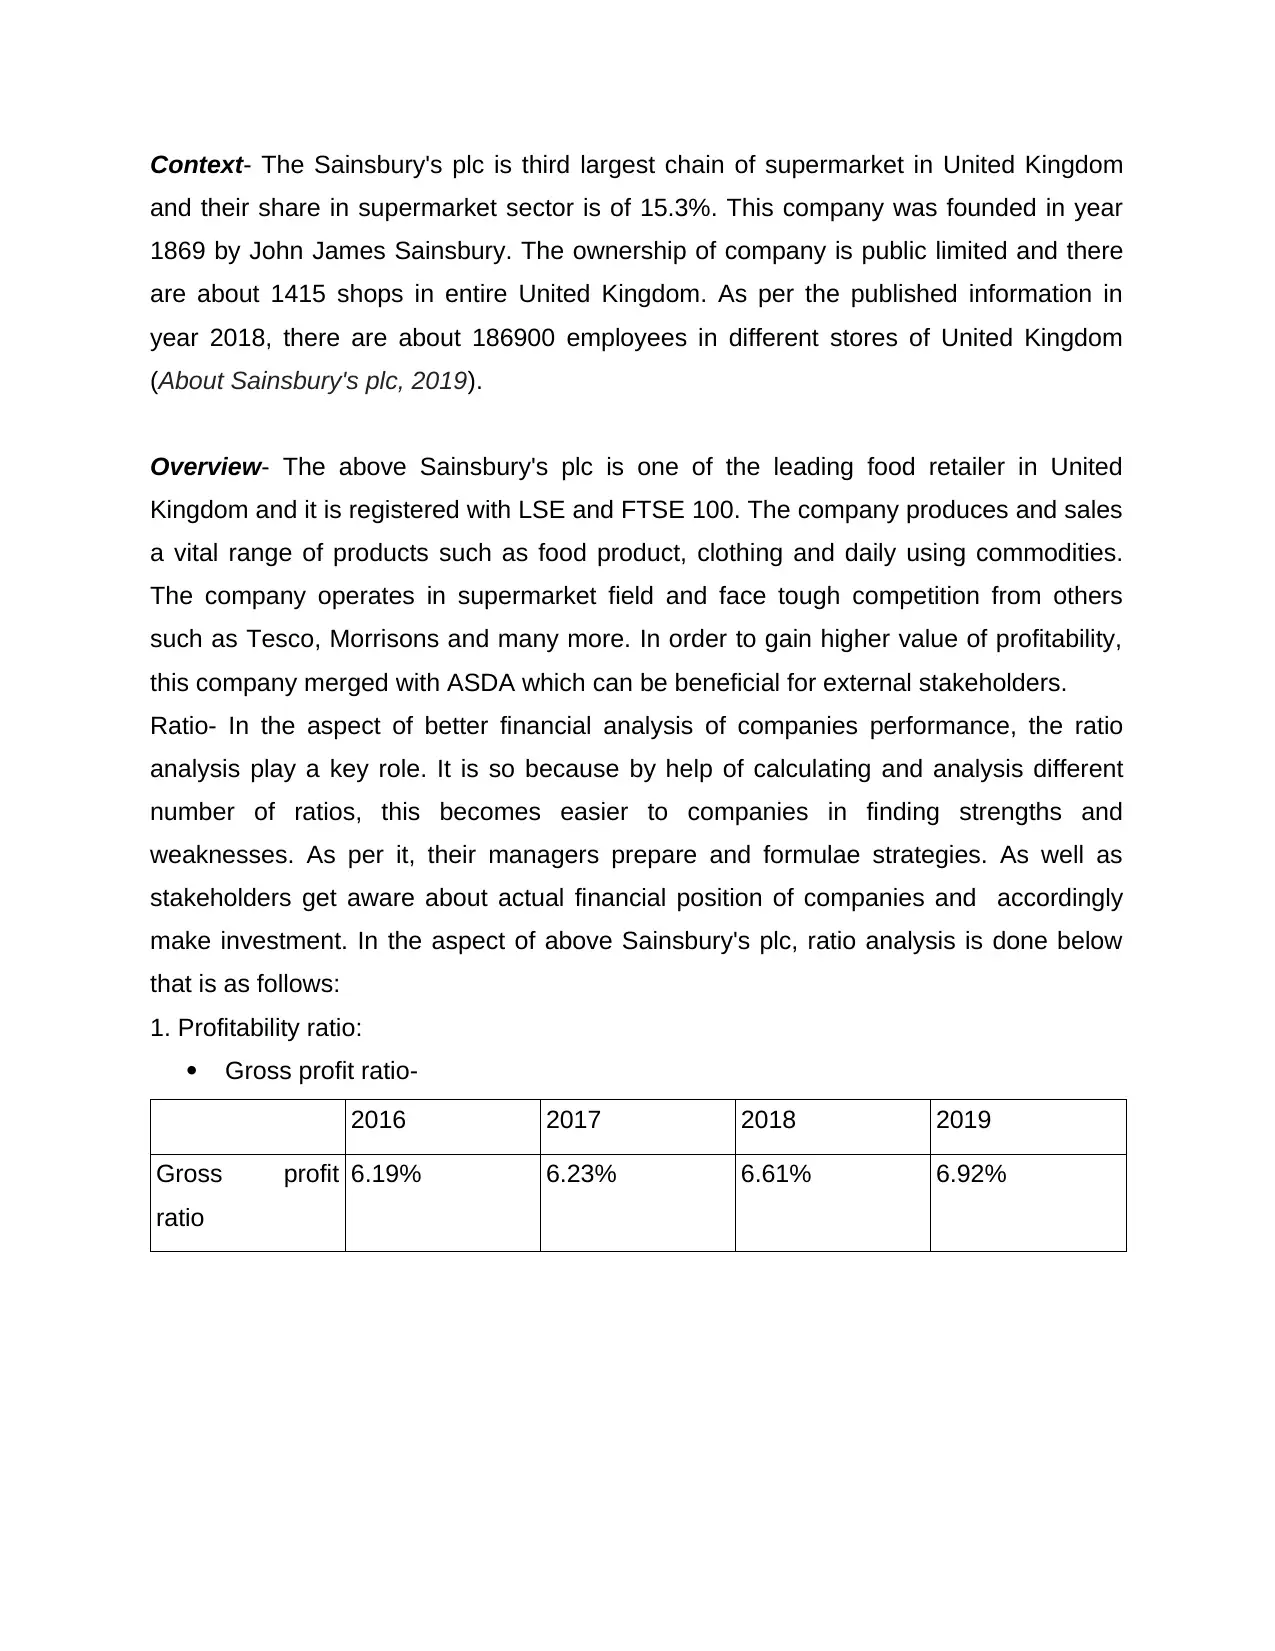
Gross profit ratio-
2016 2017 2018 2019
Gross profit
ratio
6.19% 6.23% 6.61% 6.92%
and their share in supermarket sector is of 15.3%. This company was founded in year
1869 by John James Sainsbury. The ownership of company is public limited and there
are about 1415 shops in entire United Kingdom. As per the published information in
year 2018, there are about 186900 employees in different stores of United Kingdom
(About Sainsbury's plc, 2019).
Overview- The above Sainsbury's plc is one of the leading food retailer in United
Kingdom and it is registered with LSE and FTSE 100. The company produces and sales
a vital range of products such as food product, clothing and daily using commodities.
The company operates in supermarket field and face tough competition from others
such as Tesco, Morrisons and many more. In order to gain higher value of profitability,
this company merged with ASDA which can be beneficial for external stakeholders.
Ratio- In the aspect of better financial analysis of companies performance, the ratio
analysis play a key role. It is so because by help of calculating and analysis different
number of ratios, this becomes easier to companies in finding strengths and
weaknesses. As per it, their managers prepare and formulae strategies. As well as
stakeholders get aware about actual financial position of companies and accordingly
make investment. In the aspect of above Sainsbury's plc, ratio analysis is done below
that is as follows:
1. Profitability ratio:
Gross profit ratio-
2016 2017 2018 2019
Gross profit
ratio
6.19% 6.23% 6.61% 6.92%
⊘ This is a preview!⊘
Do you want full access?
Subscribe today to unlock all pages.
Trusted by 1+ million students worldwide
ratio
0.06
0.06
0.07
0.07
6.19% 6.23%
6.61%
6.92%
2016
2017
2018
2019
Analysis- On the basis of above presented graph this can be find out that above
company's gross profit margin is increasing in significant manner. Such as in year 2016,
it was of 6.19% that raised in middle years and became 6.92% in 2019. It is indicating
that company is gaining better profitability from their sales outcomes.
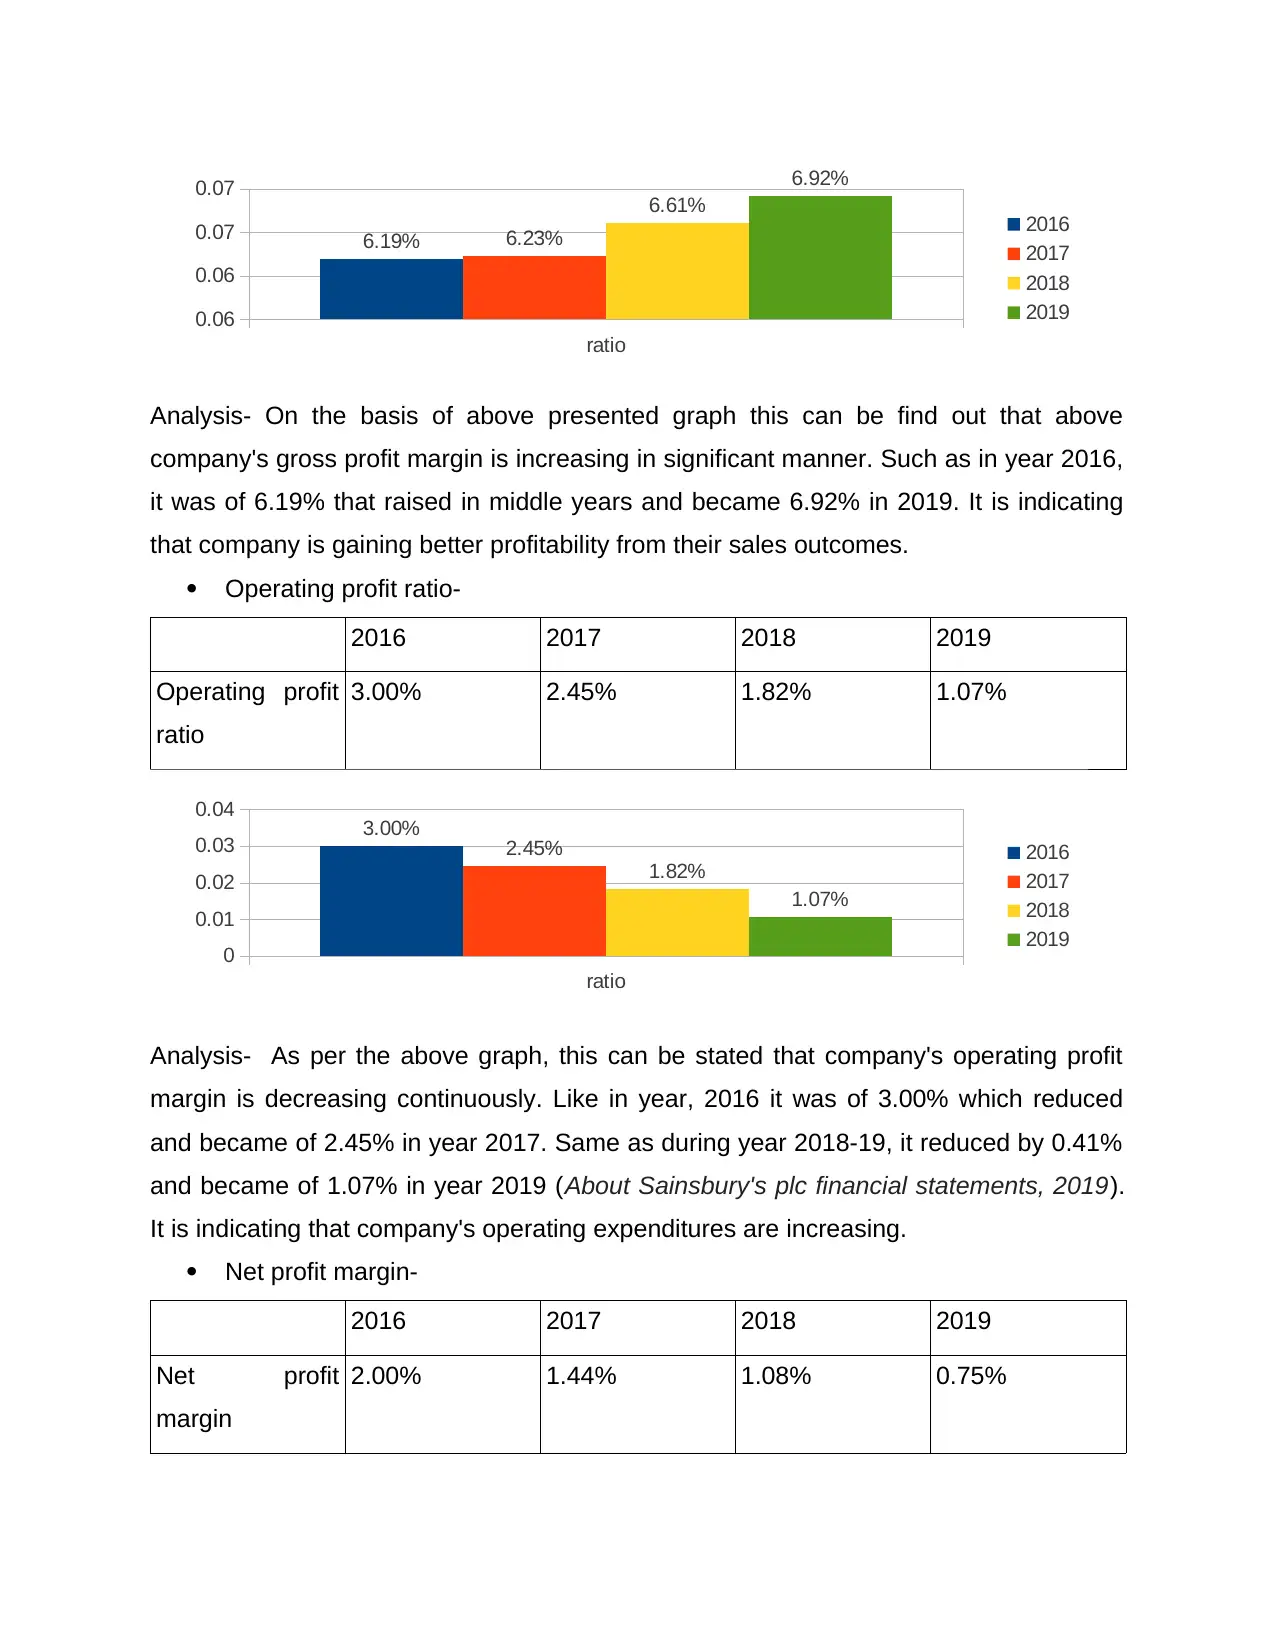
Operating profit ratio-
2016 2017 2018 2019
Operating profit
ratio
3.00% 2.45% 1.82% 1.07%
ratio
0
0.01
0.02
0.03
0.04 3.00% 2.45%
1.82%
1.07%
2016
2017
2018
2019
Analysis- As per the above graph, this can be stated that company's operating profit
margin is decreasing continuously. Like in year, 2016 it was of 3.00% which reduced
and became of 2.45% in year 2017. Same as during year 2018-19, it reduced by 0.41%
and became of 1.07% in year 2019 (About Sainsbury's plc financial statements, 2019).
It is indicating that company's operating expenditures are increasing.
Net profit margin-
2016 2017 2018 2019
Net profit
margin
2.00% 1.44% 1.08% 0.75%
0.06
0.06
0.07
0.07
6.19% 6.23%
6.61%
6.92%
2016
2017
2018
2019
Analysis- On the basis of above presented graph this can be find out that above
company's gross profit margin is increasing in significant manner. Such as in year 2016,
it was of 6.19% that raised in middle years and became 6.92% in 2019. It is indicating
that company is gaining better profitability from their sales outcomes.
Operating profit ratio-
2016 2017 2018 2019
Operating profit
ratio
3.00% 2.45% 1.82% 1.07%
ratio
0
0.01
0.02
0.03
0.04 3.00% 2.45%
1.82%
1.07%
2016
2017
2018
2019
Analysis- As per the above graph, this can be stated that company's operating profit
margin is decreasing continuously. Like in year, 2016 it was of 3.00% which reduced
and became of 2.45% in year 2017. Same as during year 2018-19, it reduced by 0.41%
and became of 1.07% in year 2019 (About Sainsbury's plc financial statements, 2019).
It is indicating that company's operating expenditures are increasing.
Net profit margin-
2016 2017 2018 2019
Net profit
margin
2.00% 1.44% 1.08% 0.75%
Paraphrase This Document
Need a fresh take? Get an instant paraphrase of this document with our AI Paraphraser
ratio
0
0.01
0.01
0.02
0.02
0.03 2.00%
1.44% 1.08% 0.75%
2016
2017
2018
2019
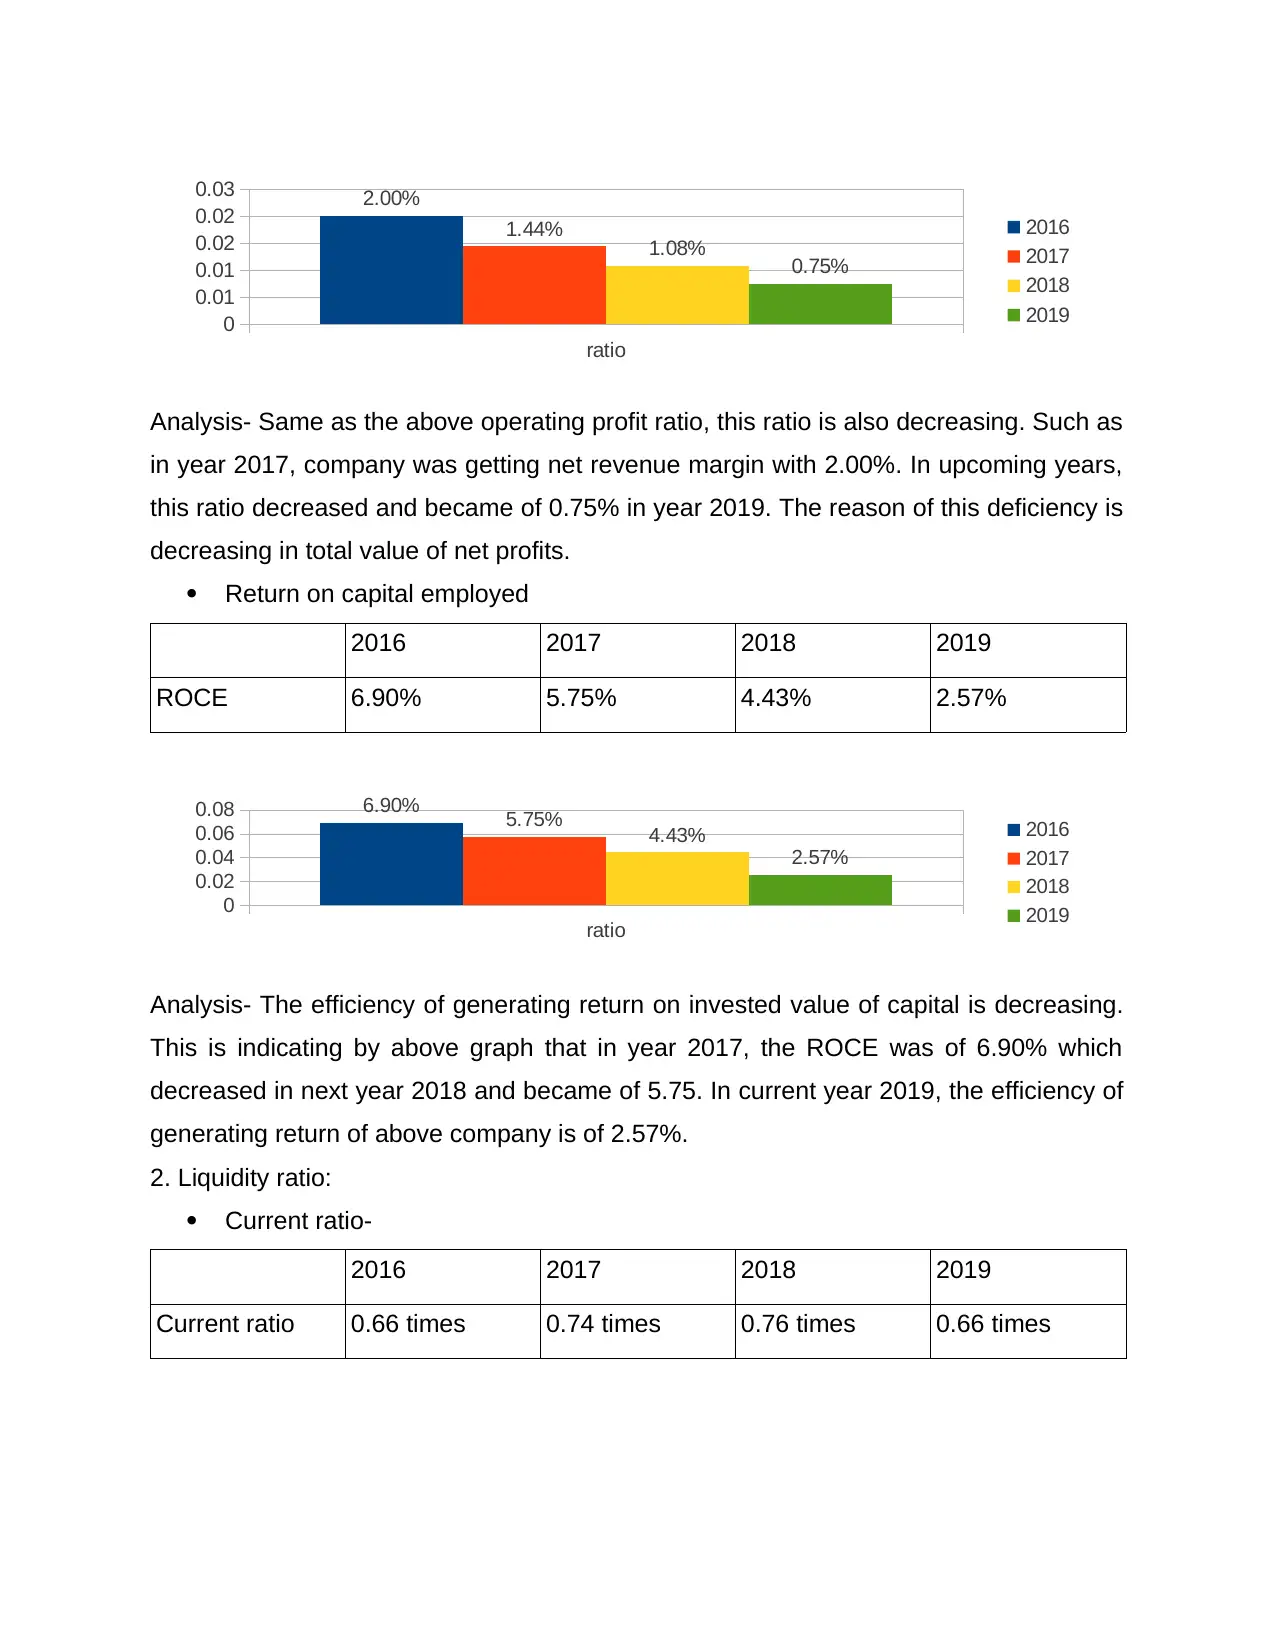
Analysis- Same as the above operating profit ratio, this ratio is also decreasing. Such as
in year 2017, company was getting net revenue margin with 2.00%. In upcoming years,
this ratio decreased and became of 0.75% in year 2019. The reason of this deficiency is
decreasing in total value of net profits.
Return on capital employed
2016 2017 2018 2019
ROCE 6.90% 5.75% 4.43% 2.57%
ratio
0
0.02
0.04
0.06
0.08 6.90% 5.75% 4.43%
2.57%
2016
2017
2018
2019
Analysis- The efficiency of generating return on invested value of capital is decreasing.
This is indicating by above graph that in year 2017, the ROCE was of 6.90% which
decreased in next year 2018 and became of 5.75. In current year 2019, the efficiency of
generating return of above company is of 2.57%.
2. Liquidity ratio:
Current ratio-
2016 2017 2018 2019
Current ratio 0.66 times 0.74 times 0.76 times 0.66 times
0
0.01
0.01
0.02
0.02
0.03 2.00%
1.44% 1.08% 0.75%
2016
2017
2018
2019
Analysis- Same as the above operating profit ratio, this ratio is also decreasing. Such as
in year 2017, company was getting net revenue margin with 2.00%. In upcoming years,
this ratio decreased and became of 0.75% in year 2019. The reason of this deficiency is
decreasing in total value of net profits.
Return on capital employed
2016 2017 2018 2019
ROCE 6.90% 5.75% 4.43% 2.57%
ratio
0
0.02
0.04
0.06
0.08 6.90% 5.75% 4.43%
2.57%
2016
2017
2018
2019
Analysis- The efficiency of generating return on invested value of capital is decreasing.
This is indicating by above graph that in year 2017, the ROCE was of 6.90% which
decreased in next year 2018 and became of 5.75. In current year 2019, the efficiency of
generating return of above company is of 2.57%.
2. Liquidity ratio:
Current ratio-
2016 2017 2018 2019
Current ratio 0.66 times 0.74 times 0.76 times 0.66 times
Current ratio
0.6
0.65
0.7
0.75
0.8
0.66
0.74 0.76
0.66
2016
2017
2018
2019
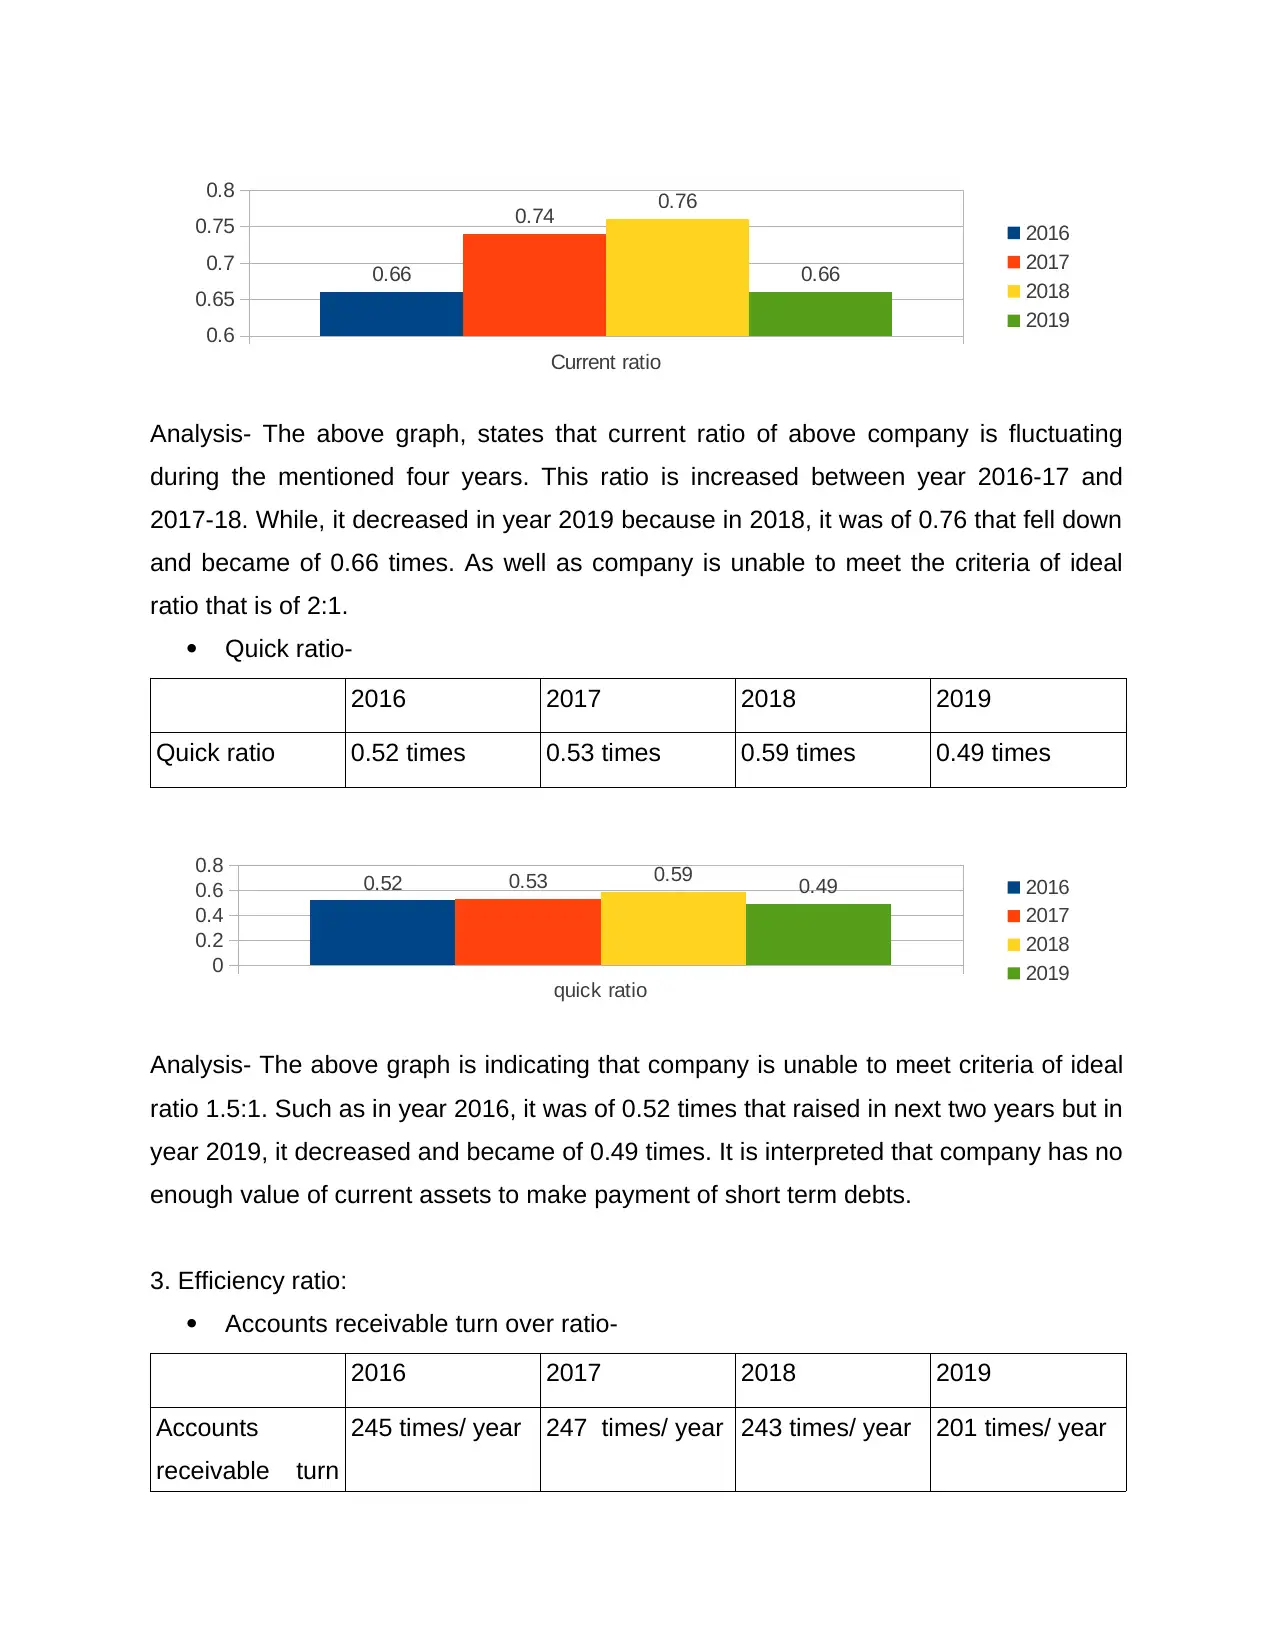
Analysis- The above graph, states that current ratio of above company is fluctuating
during the mentioned four years. This ratio is increased between year 2016-17 and
2017-18. While, it decreased in year 2019 because in 2018, it was of 0.76 that fell down
and became of 0.66 times. As well as company is unable to meet the criteria of ideal
ratio that is of 2:1.
Quick ratio-
2016 2017 2018 2019
Quick ratio 0.52 times 0.53 times 0.59 times 0.49 times
quick ratio
0
0.2
0.4
0.6
0.8 0.52 0.53 0.59 0.49 2016
2017
2018
2019
Analysis- The above graph is indicating that company is unable to meet criteria of ideal
ratio 1.5:1. Such as in year 2016, it was of 0.52 times that raised in next two years but in
year 2019, it decreased and became of 0.49 times. It is interpreted that company has no
enough value of current assets to make payment of short term debts.
3. Efficiency ratio:
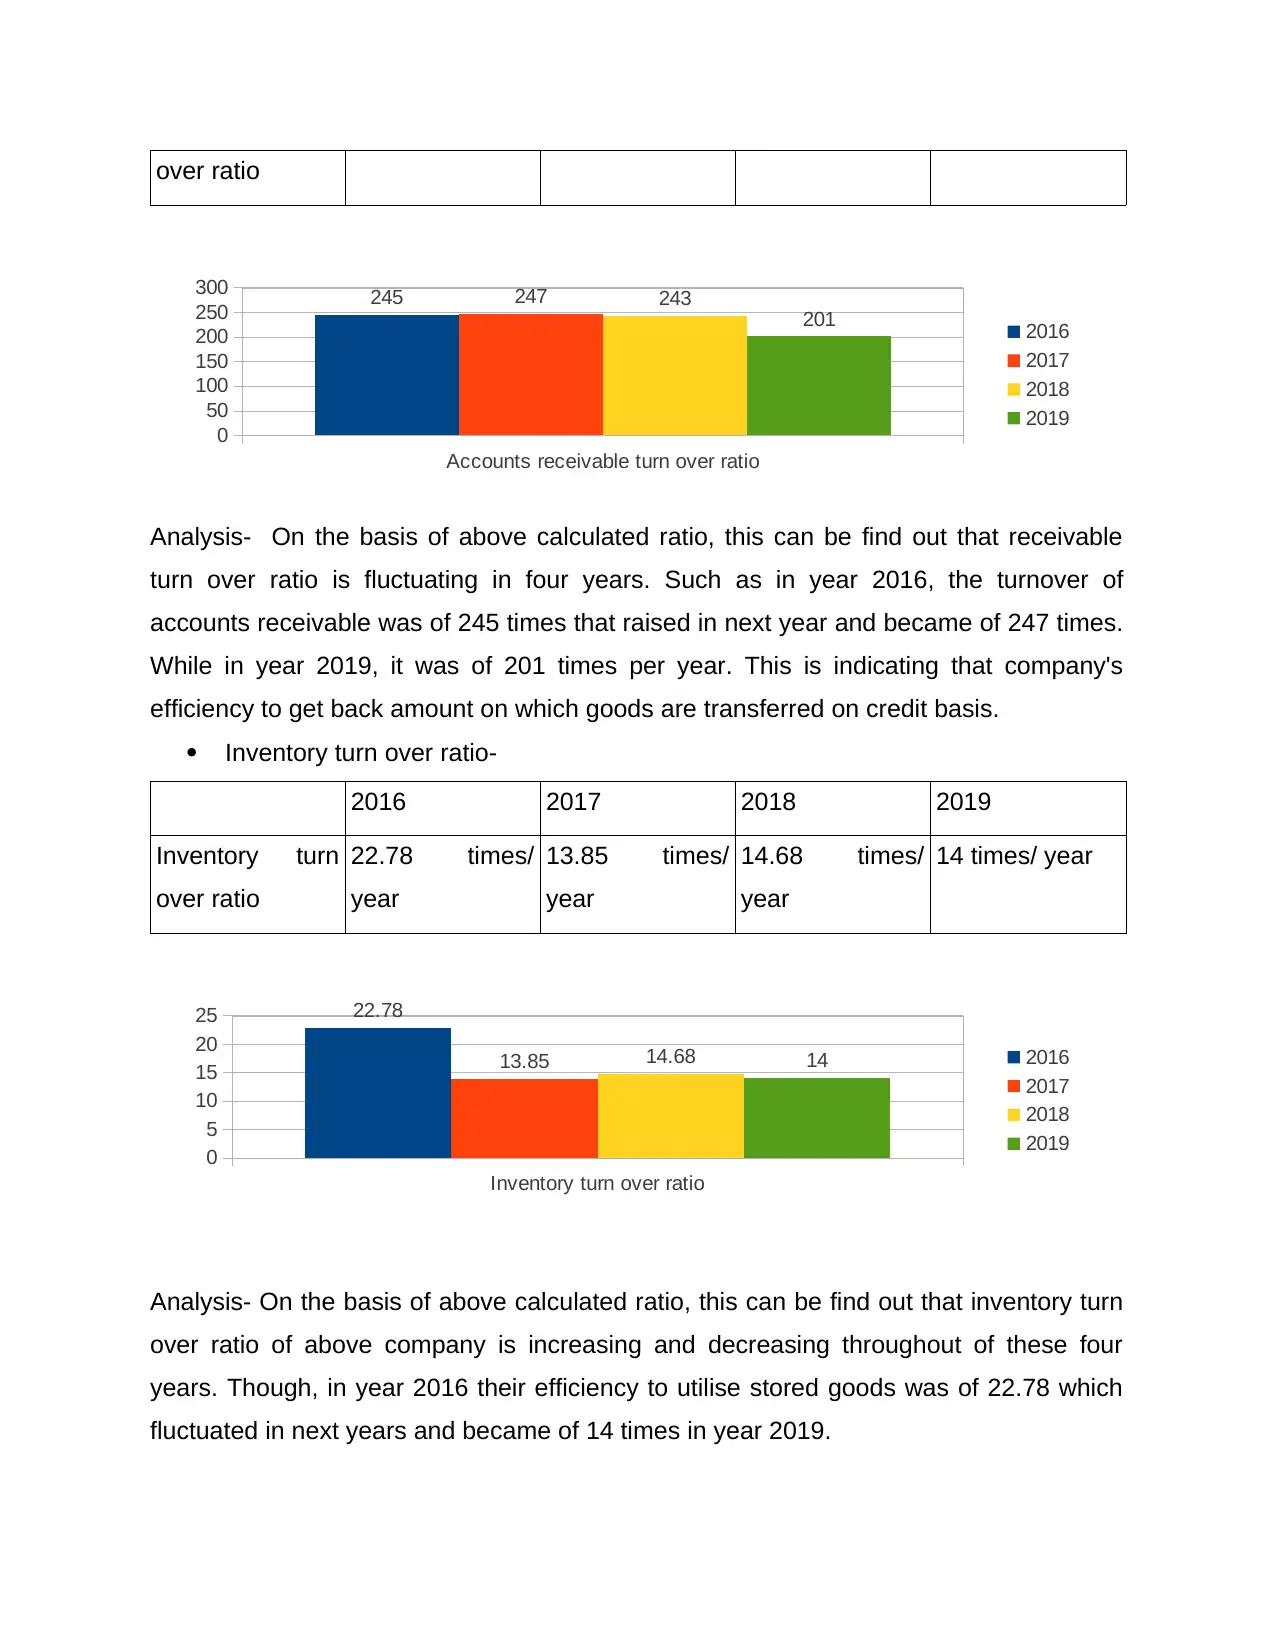
Accounts receivable turn over ratio-
2016 2017 2018 2019
Accounts
receivable turn
245 times/ year 247 times/ year 243 times/ year 201 times/ year
0.6
0.65
0.7
0.75
0.8
0.66
0.74 0.76
0.66
2016
2017
2018
2019
Analysis- The above graph, states that current ratio of above company is fluctuating
during the mentioned four years. This ratio is increased between year 2016-17 and
2017-18. While, it decreased in year 2019 because in 2018, it was of 0.76 that fell down
and became of 0.66 times. As well as company is unable to meet the criteria of ideal
ratio that is of 2:1.
Quick ratio-
2016 2017 2018 2019
Quick ratio 0.52 times 0.53 times 0.59 times 0.49 times
quick ratio
0
0.2
0.4
0.6
0.8 0.52 0.53 0.59 0.49 2016
2017
2018
2019
Analysis- The above graph is indicating that company is unable to meet criteria of ideal
ratio 1.5:1. Such as in year 2016, it was of 0.52 times that raised in next two years but in
year 2019, it decreased and became of 0.49 times. It is interpreted that company has no
enough value of current assets to make payment of short term debts.
3. Efficiency ratio:
Accounts receivable turn over ratio-
2016 2017 2018 2019
Accounts
receivable turn
245 times/ year 247 times/ year 243 times/ year 201 times/ year
⊘ This is a preview!⊘
Do you want full access?
Subscribe today to unlock all pages.
Trusted by 1+ million students worldwide
over ratio
Accounts receivable turn over ratio
0
50
100
150
200
250
300 245 247 243
201 2016
2017
2018
2019
Analysis- On the basis of above calculated ratio, this can be find out that receivable
turn over ratio is fluctuating in four years. Such as in year 2016, the turnover of
accounts receivable was of 245 times that raised in next year and became of 247 times.
While in year 2019, it was of 201 times per year. This is indicating that company's
efficiency to get back amount on which goods are transferred on credit basis.
Inventory turn over ratio-
2016 2017 2018 2019
Inventory turn
over ratio
22.78 times/
year
13.85 times/
year
14.68 times/
year
14 times/ year
Inventory turn over ratio
0
5
10
15
20
25 22.78
13.85 14.68 14 2016
2017
2018
2019
Analysis- On the basis of above calculated ratio, this can be find out that inventory turn
over ratio of above company is increasing and decreasing throughout of these four
years. Though, in year 2016 their efficiency to utilise stored goods was of 22.78 which
fluctuated in next years and became of 14 times in year 2019.
Paraphrase This Document
Need a fresh take? Get an instant paraphrase of this document with our AI Paraphraser
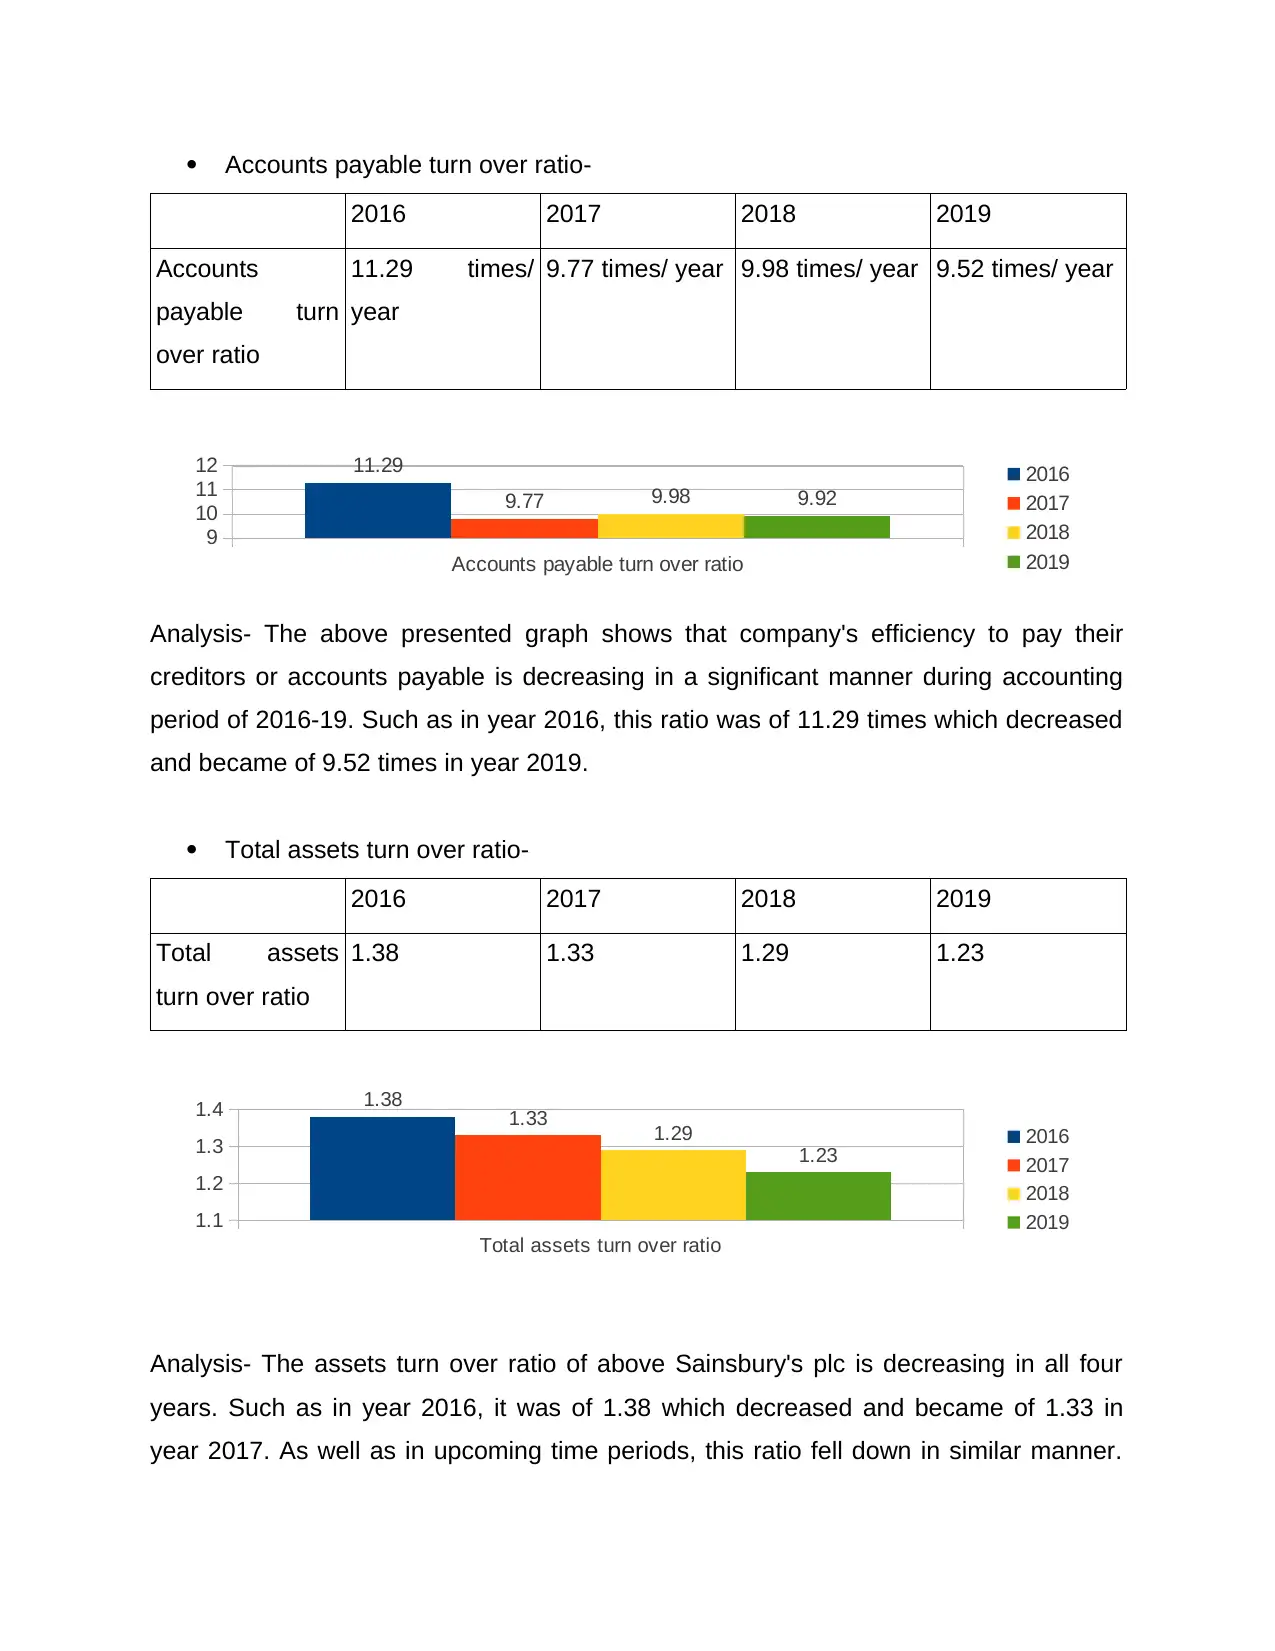
Accounts payable turn over ratio-
2016 2017 2018 2019
Accounts
payable turn
over ratio
11.29 times/
year
9.77 times/ year 9.98 times/ year 9.52 times/ year
Accounts payable turn over ratio
9
10
11
12 11.29
9.77 9.98 9.92
2016
2017
2018
2019
Analysis- The above presented graph shows that company's efficiency to pay their
creditors or accounts payable is decreasing in a significant manner during accounting
period of 2016-19. Such as in year 2016, this ratio was of 11.29 times which decreased
and became of 9.52 times in year 2019.
Total assets turn over ratio-
2016 2017 2018 2019
Total assets
turn over ratio
1.38 1.33 1.29 1.23
Total assets turn over ratio
1.1
1.2
1.3
1.4 1.38 1.33 1.29
1.23 2016
2017
2018
2019
Analysis- The assets turn over ratio of above Sainsbury's plc is decreasing in all four
years. Such as in year 2016, it was of 1.38 which decreased and became of 1.33 in
year 2017. As well as in upcoming time periods, this ratio fell down in similar manner.
2016 2017 2018 2019
Accounts
payable turn
over ratio
11.29 times/
year
9.77 times/ year 9.98 times/ year 9.52 times/ year
Accounts payable turn over ratio
9
10
11
12 11.29
9.77 9.98 9.92
2016
2017
2018
2019
Analysis- The above presented graph shows that company's efficiency to pay their
creditors or accounts payable is decreasing in a significant manner during accounting
period of 2016-19. Such as in year 2016, this ratio was of 11.29 times which decreased
and became of 9.52 times in year 2019.
Total assets turn over ratio-
2016 2017 2018 2019
Total assets
turn over ratio
1.38 1.33 1.29 1.23
Total assets turn over ratio
1.1
1.2
1.3
1.4 1.38 1.33 1.29
1.23 2016
2017
2018
2019
Analysis- The assets turn over ratio of above Sainsbury's plc is decreasing in all four
years. Such as in year 2016, it was of 1.38 which decreased and became of 1.33 in
year 2017. As well as in upcoming time periods, this ratio fell down in similar manner.
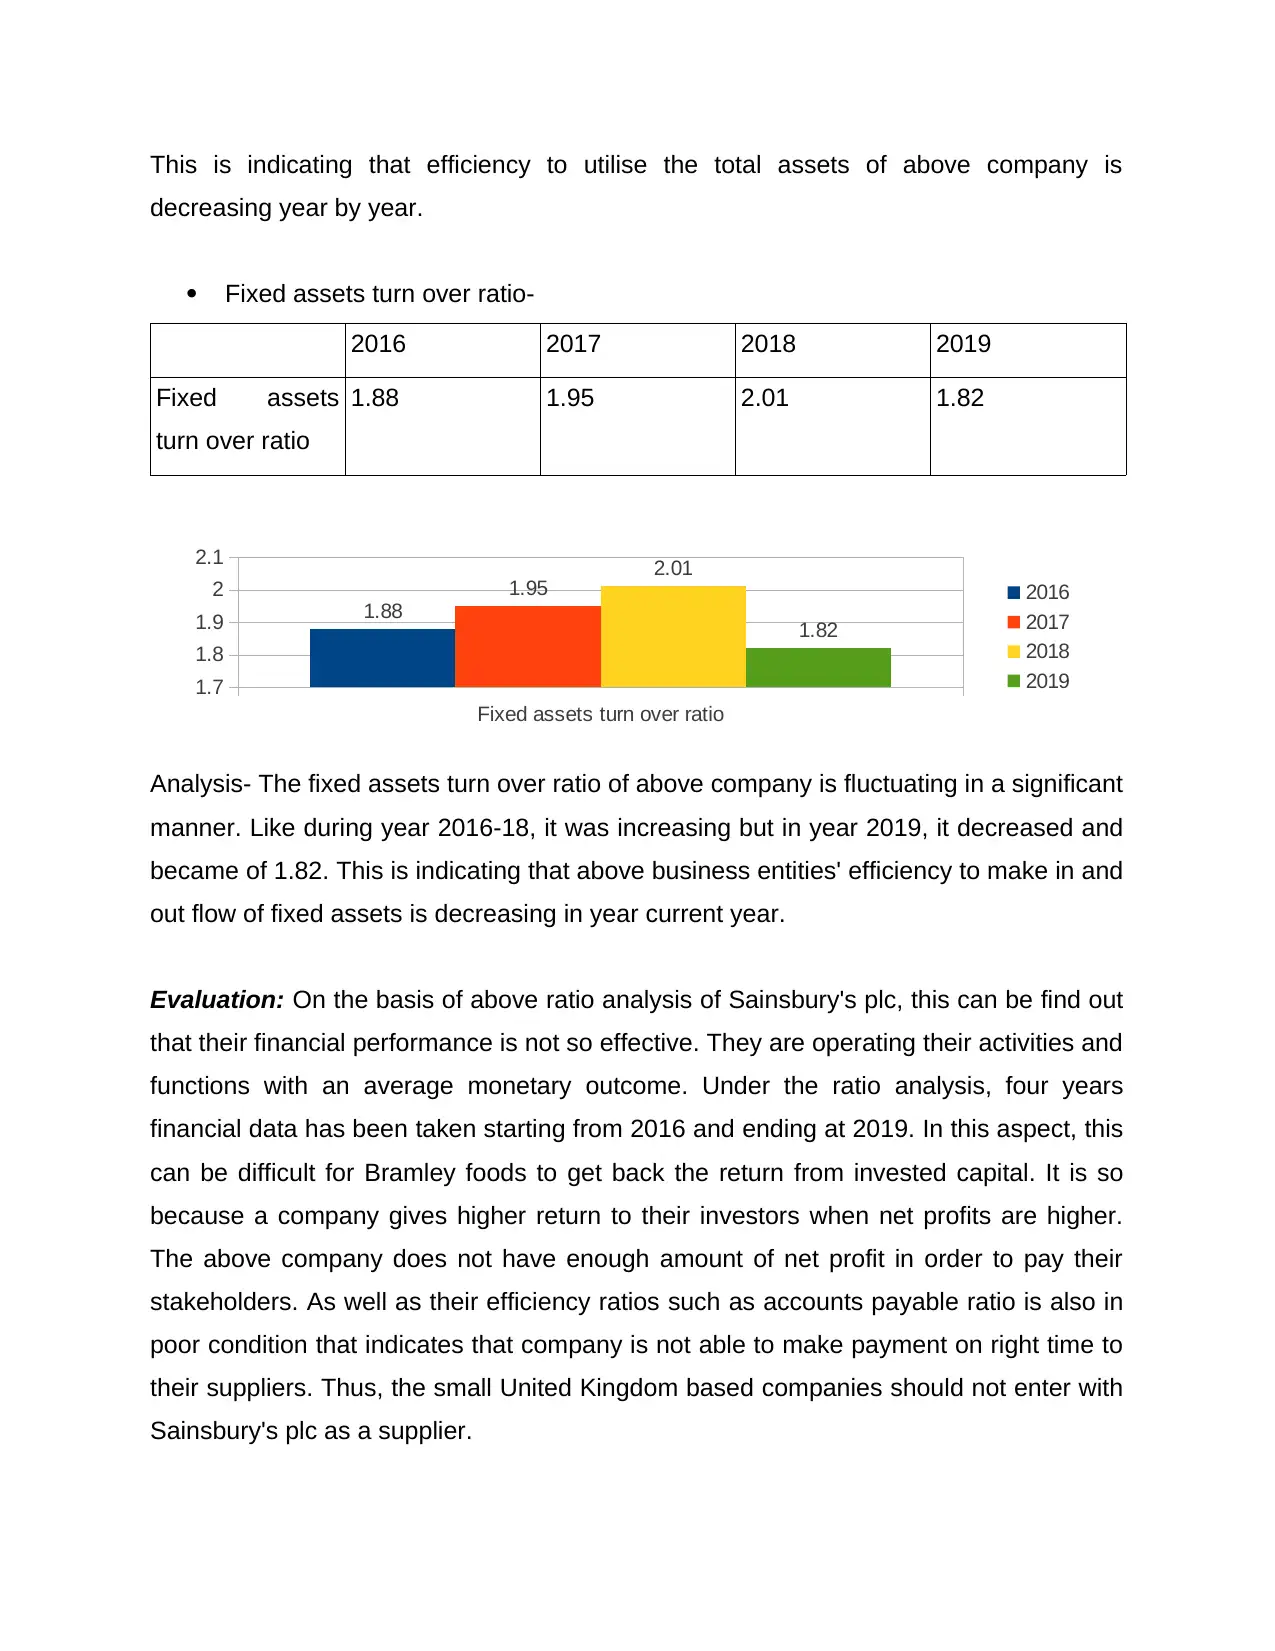
This is indicating that efficiency to utilise the total assets of above company is
decreasing year by year.
Fixed assets turn over ratio-
2016 2017 2018 2019
Fixed assets
turn over ratio
1.88 1.95 2.01 1.82
Fixed assets turn over ratio
1.7
1.8
1.9
2
2.1
1.88
1.95 2.01
1.82
2016
2017
2018
2019
Analysis- The fixed assets turn over ratio of above company is fluctuating in a significant
manner. Like during year 2016-18, it was increasing but in year 2019, it decreased and
became of 1.82. This is indicating that above business entities' efficiency to make in and
out flow of fixed assets is decreasing in year current year.
Evaluation: On the basis of above ratio analysis of Sainsbury's plc, this can be find out
that their financial performance is not so effective. They are operating their activities and
functions with an average monetary outcome. Under the ratio analysis, four years
financial data has been taken starting from 2016 and ending at 2019. In this aspect, this
can be difficult for Bramley foods to get back the return from invested capital. It is so
because a company gives higher return to their investors when net profits are higher.
The above company does not have enough amount of net profit in order to pay their
stakeholders. As well as their efficiency ratios such as accounts payable ratio is also in
poor condition that indicates that company is not able to make payment on right time to
their suppliers. Thus, the small United Kingdom based companies should not enter with
Sainsbury's plc as a supplier.
⊘ This is a preview!⊘
Do you want full access?
Subscribe today to unlock all pages.
Trusted by 1+ million students worldwide
1 out of 23
Related Documents


Your All-in-One AI-Powered Toolkit for Academic Success.
+13062052269
info@desklib.com
Available 24*7 on WhatsApp / Email
![[object Object]](/_next/static/media/star-bottom.7253800d.svg)
Unlock your academic potential
Copyright © 2020–2026 A2Z Services. All Rights Reserved. Developed and managed by ZUCOL.