Financial Analysis of Scentre Group Limited (2017-2018)
VerifiedAdded on 2022/08/29
|20
|2997
|15
Report
AI Summary
This report provides a comprehensive financial analysis of Scentre Group Limited, focusing on its performance during 2017 and 2018. The analysis includes an executive summary, introduction, and detailed examination of profitability, liquidity, solvency, efficiency, and market performance ratios. A competitor analysis is also presented. The report employs horizontal and vertical analysis techniques to identify trends and variances in the company's financial statements, including the income statement and balance sheet. Key findings reveal insights into the company's financial health, including shifts in profitability, liquidity, and debt levels. The analysis concludes with recommendations aimed at improving Scentre Group's financial standing and competitiveness, along with references to supporting sources.
Accounting and Finance for managers 1
Accounting and Finance for managers
Accounting and Finance for managers
Paraphrase This Document
Need a fresh take? Get an instant paraphrase of this document with our AI Paraphraser
Accounting and Finance for managers
Executive summary
Scentre Group Limited is one of the core companies in the area of property management,
designing and construction. In this report a detailed analysis of the company has been undertaken
to analyze the financial performance of the business. In order to analyze the financial
performance of any business, there are several techniques that are required to be undertaken to
get in-depth information. Further, ratio analysis techniques have been used to evaluate the how
well the companies have performed on the basis of previous year and against the competitors.
Each category of ratios has been ascertained to be aware of each department. The techniques foe
evaluation such as horizontal and vertical analysis has been used to record the differences
between the items of the income statement and balance sheet to understand the area of variance if
any. In order to improve the financial performance following recommendations and conclusions
are also provided. These strategies could help the company lift up its position.
Accounting and Finance for managers
Contents
Introduction......................................................................................................................................3
Ratio analysis...................................................................................................................................3
Profitability..................................................................................................................................4
Liquidity.......................................................................................................................................4
Solvency.......................................................................................................................................5
Efficiency.....................................................................................................................................6
Market Performance.....................................................................................................................6
Competitor analysis.........................................................................................................................7
Horizontal Analysis.........................................................................................................................7
Vertical Analysis.............................................................................................................................9
Recommendations and Conclusion................................................................................................12
References......................................................................................................................................13
Appendix 1.....................................................................................................................................15
⊘ This is a preview!⊘
Do you want full access?
Subscribe today to unlock all pages.
Trusted by 1+ million students worldwide
Accounting and Finance for managers
Introduction
Scentre Group Limited is one of the Australian flagships, commonly known as a
shopping Centre having features with retail destinations which is currently operating under the
Westfield brand in Australia and New Zealand. Originally the Scentre Group limited belongs to
the western Suburbs of Sydney. These primary activities of this corporation are to undertake the
ownership, designs or constructs, development, property management, leasing and creating
marketing centers. Founded in the year 2014, as a spin off from Westfield Development
Corporation, the same was also listed on Australian Stock Exchange (Scentre Group Limited,
2019).
Ratio analysis
Ratio analysis is understood as a technique that is useful for comparison of the items
available in the financial report of the Scentre Group limited. Ratios can be evaluated on the
basis of the previous years or on the basis of the benchmark. There are several categories on the
basis of which these ratios are being compared to get an insight of the financial performance off
the business. Mainly this comparison is undertaken to understand the position of the Scentre
Group limited with respect to the competitors (Accountingtools.com, 2018). In this section a
detailed ratio analysis has been undertaken for Scentre Group Limited for the period of 2017 and
2018 (Setiawan & Amboningtyas, 2018).
Paraphrase This Document
Need a fresh take? Get an instant paraphrase of this document with our AI Paraphraser
Accounting and Finance for managers
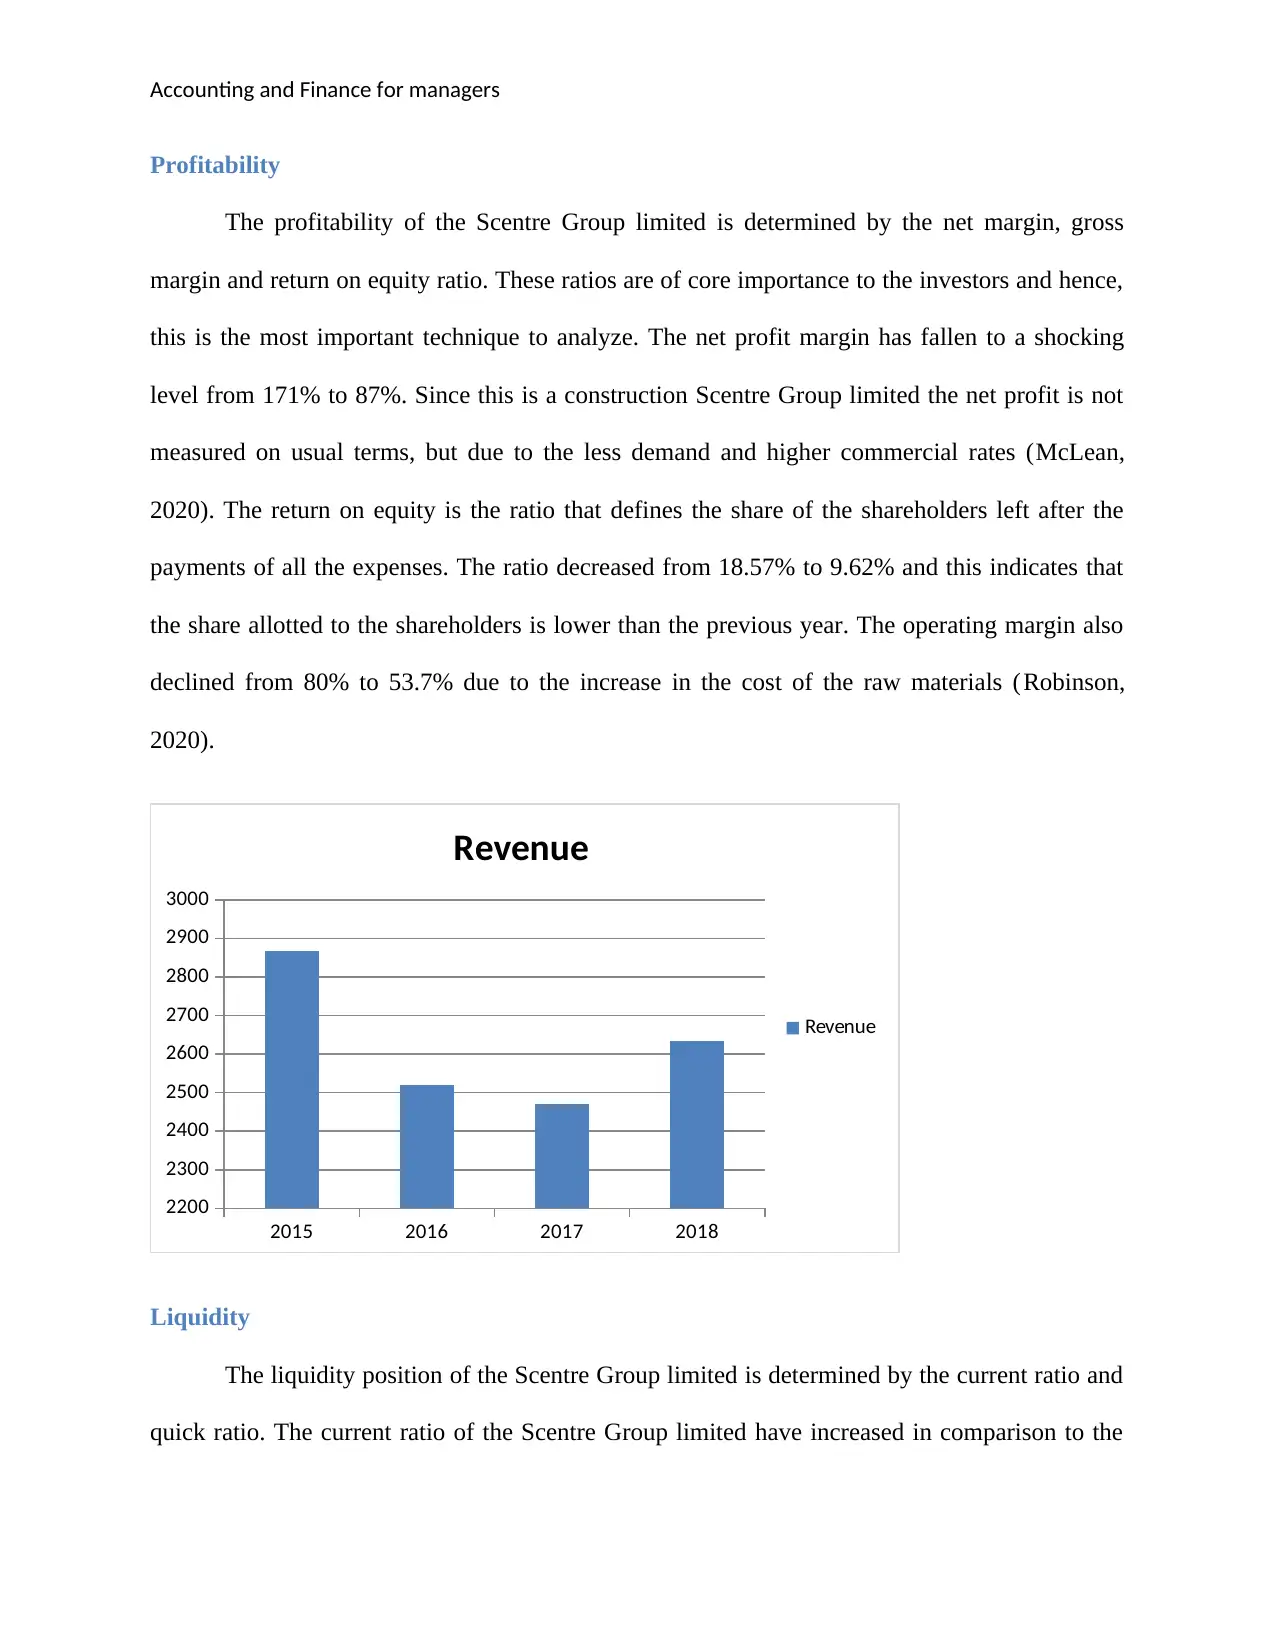
Profitability
The profitability of the Scentre Group limited is determined by the net margin, gross
margin and return on equity ratio. These ratios are of core importance to the investors and hence,
this is the most important technique to analyze. The net profit margin has fallen to a shocking
level from 171% to 87%. Since this is a construction Scentre Group limited the net profit is not
measured on usual terms, but due to the less demand and higher commercial rates (McLean,
2020). The return on equity is the ratio that defines the share of the shareholders left after the
payments of all the expenses. The ratio decreased from 18.57% to 9.62% and this indicates that
the share allotted to the shareholders is lower than the previous year. The operating margin also
declined from 80% to 53.7% due to the increase in the cost of the raw materials (Robinson,
2020).
2015 2016 2017 2018
2200
2300
2400
2500
2600
2700
2800
2900
3000
Revenue
Revenue
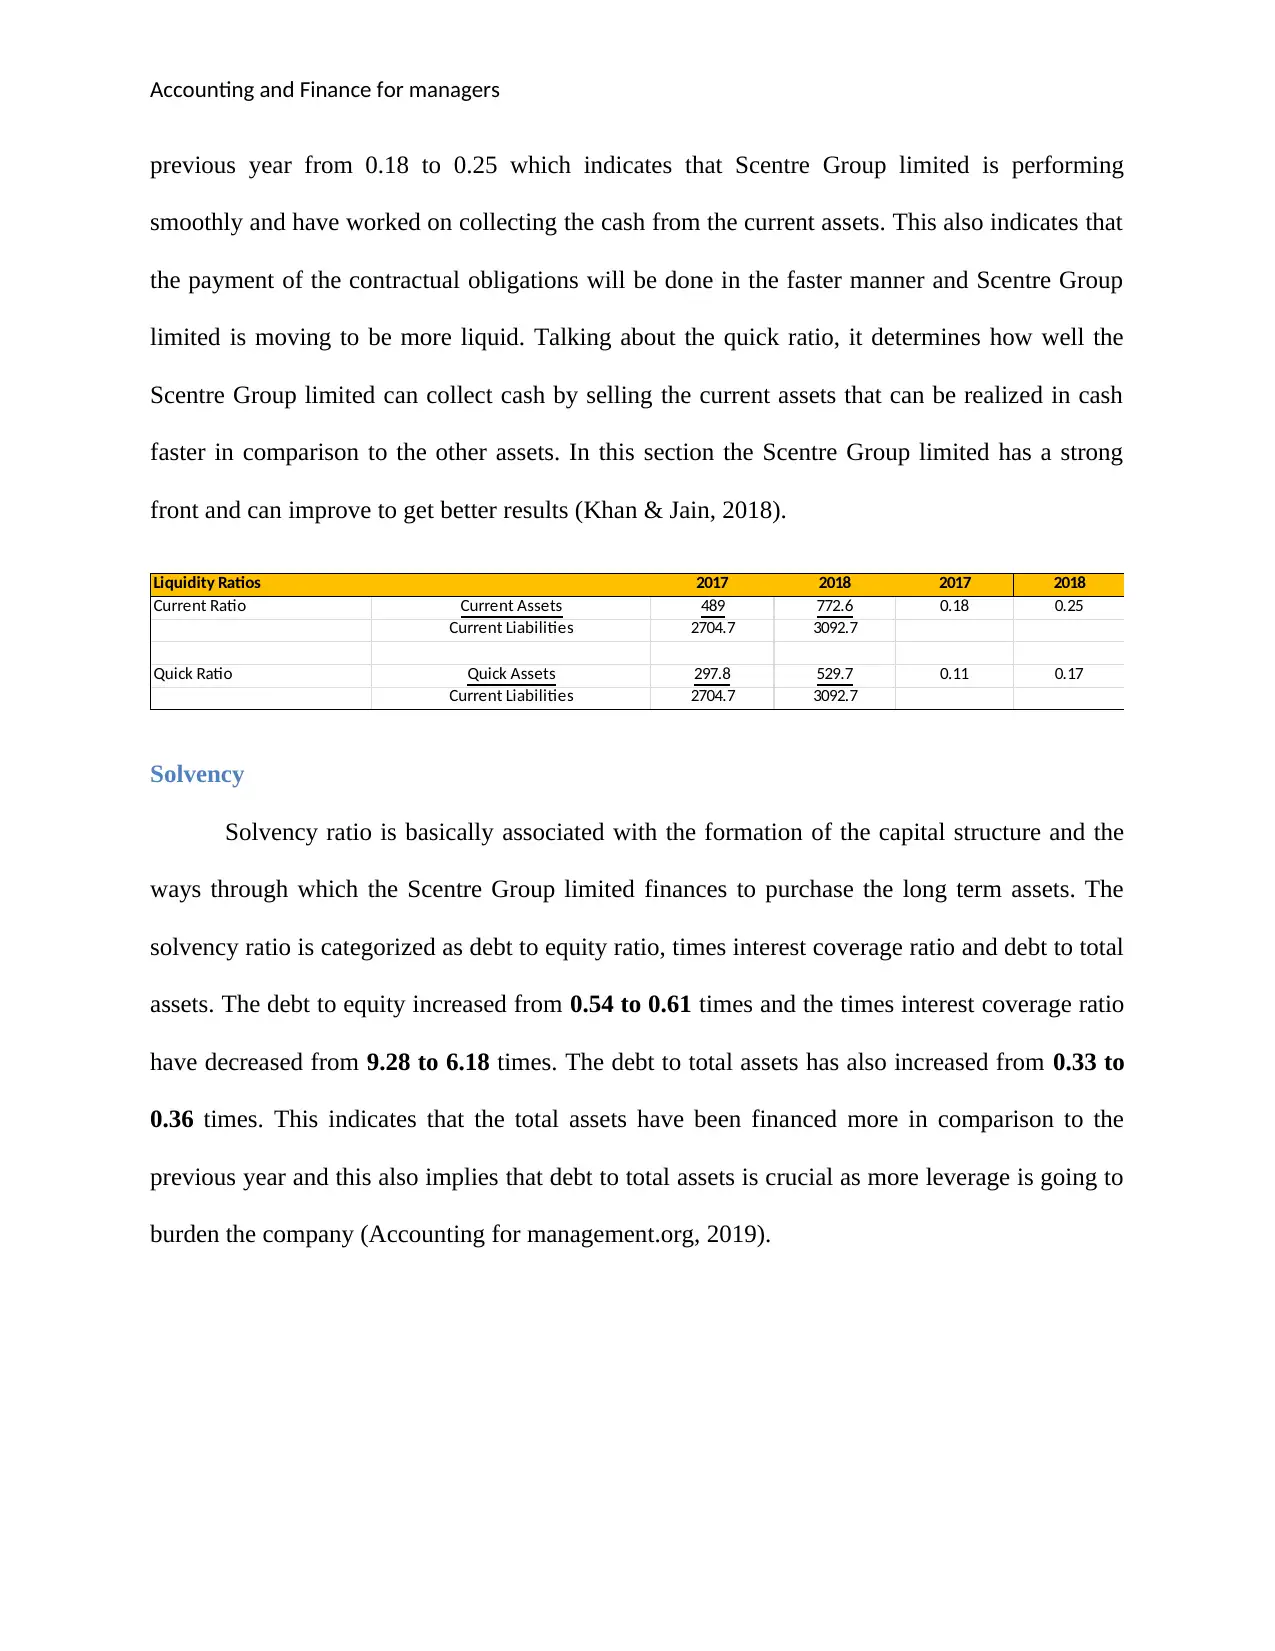
Liquidity
The liquidity position of the Scentre Group limited is determined by the current ratio and
quick ratio. The current ratio of the Scentre Group limited have increased in comparison to the
Profitability
The profitability of the Scentre Group limited is determined by the net margin, gross
margin and return on equity ratio. These ratios are of core importance to the investors and hence,
this is the most important technique to analyze. The net profit margin has fallen to a shocking
level from 171% to 87%. Since this is a construction Scentre Group limited the net profit is not
measured on usual terms, but due to the less demand and higher commercial rates (McLean,
2020). The return on equity is the ratio that defines the share of the shareholders left after the
payments of all the expenses. The ratio decreased from 18.57% to 9.62% and this indicates that
the share allotted to the shareholders is lower than the previous year. The operating margin also
declined from 80% to 53.7% due to the increase in the cost of the raw materials (Robinson,
2020).
2015 2016 2017 2018
2200
2300
2400
2500
2600
2700
2800
2900
3000
Revenue
Revenue
Liquidity
The liquidity position of the Scentre Group limited is determined by the current ratio and
quick ratio. The current ratio of the Scentre Group limited have increased in comparison to the
Accounting and Finance for managers
previous year from 0.18 to 0.25 which indicates that Scentre Group limited is performing
smoothly and have worked on collecting the cash from the current assets. This also indicates that
the payment of the contractual obligations will be done in the faster manner and Scentre Group
limited is moving to be more liquid. Talking about the quick ratio, it determines how well the
Scentre Group limited can collect cash by selling the current assets that can be realized in cash
faster in comparison to the other assets. In this section the Scentre Group limited has a strong
front and can improve to get better results (Khan & Jain, 2018).
Liquidity Ratios 2017 2018 2017 2018
Current Ratio Current Assets 489 772.6 0.18 0.25
Current Liabilities 2704.7 3092.7
Quick Ratio Quick Assets 297.8 529.7 0.11 0.17
Current Liabilities 2704.7 3092.7
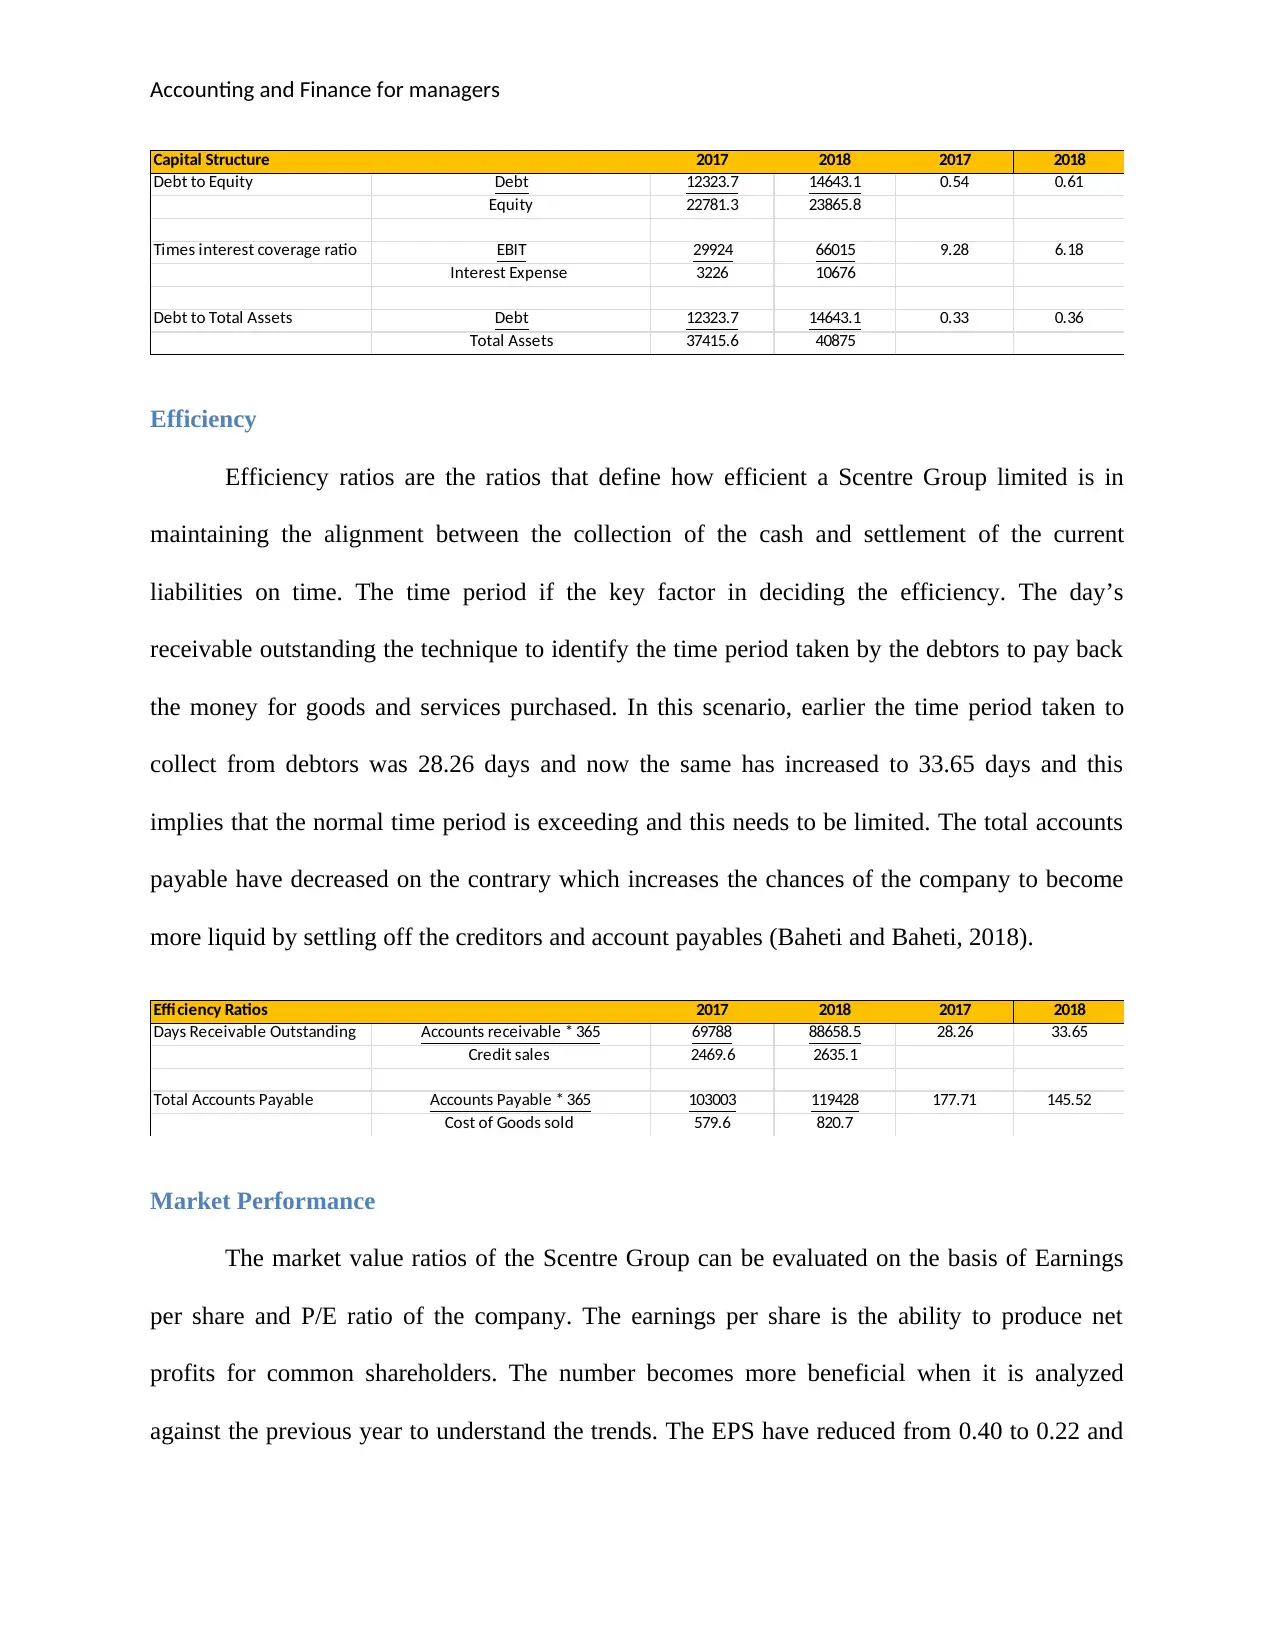
Solvency
Solvency ratio is basically associated with the formation of the capital structure and the
ways through which the Scentre Group limited finances to purchase the long term assets. The
solvency ratio is categorized as debt to equity ratio, times interest coverage ratio and debt to total
assets. The debt to equity increased from 0.54 to 0.61 times and the times interest coverage ratio
have decreased from 9.28 to 6.18 times. The debt to total assets has also increased from 0.33 to
0.36 times. This indicates that the total assets have been financed more in comparison to the
previous year and this also implies that debt to total assets is crucial as more leverage is going to
burden the company (Accounting for management.org, 2019).
previous year from 0.18 to 0.25 which indicates that Scentre Group limited is performing
smoothly and have worked on collecting the cash from the current assets. This also indicates that
the payment of the contractual obligations will be done in the faster manner and Scentre Group
limited is moving to be more liquid. Talking about the quick ratio, it determines how well the
Scentre Group limited can collect cash by selling the current assets that can be realized in cash
faster in comparison to the other assets. In this section the Scentre Group limited has a strong
front and can improve to get better results (Khan & Jain, 2018).
Liquidity Ratios 2017 2018 2017 2018
Current Ratio Current Assets 489 772.6 0.18 0.25
Current Liabilities 2704.7 3092.7
Quick Ratio Quick Assets 297.8 529.7 0.11 0.17
Current Liabilities 2704.7 3092.7
Solvency
Solvency ratio is basically associated with the formation of the capital structure and the
ways through which the Scentre Group limited finances to purchase the long term assets. The
solvency ratio is categorized as debt to equity ratio, times interest coverage ratio and debt to total
assets. The debt to equity increased from 0.54 to 0.61 times and the times interest coverage ratio
have decreased from 9.28 to 6.18 times. The debt to total assets has also increased from 0.33 to
0.36 times. This indicates that the total assets have been financed more in comparison to the
previous year and this also implies that debt to total assets is crucial as more leverage is going to
burden the company (Accounting for management.org, 2019).
⊘ This is a preview!⊘
Do you want full access?
Subscribe today to unlock all pages.
Trusted by 1+ million students worldwide
Accounting and Finance for managers
Capital Structure 2017 2018 2017 2018
Debt to Equity Debt 12323.7 14643.1 0.54 0.61
Equity 22781.3 23865.8
Times interest coverage ratio EBIT 29924 66015 9.28 6.18
Interest Expense 3226 10676
Debt to Total Assets Debt 12323.7 14643.1 0.33 0.36
Total Assets 37415.6 40875
Efficiency
Efficiency ratios are the ratios that define how efficient a Scentre Group limited is in
maintaining the alignment between the collection of the cash and settlement of the current
liabilities on time. The time period if the key factor in deciding the efficiency. The day’s
receivable outstanding the technique to identify the time period taken by the debtors to pay back
the money for goods and services purchased. In this scenario, earlier the time period taken to
collect from debtors was 28.26 days and now the same has increased to 33.65 days and this
implies that the normal time period is exceeding and this needs to be limited. The total accounts
payable have decreased on the contrary which increases the chances of the company to become
more liquid by settling off the creditors and account payables (Baheti and Baheti, 2018).
Efficiency Ratios 2017 2018 2017 2018
Days Receivable Outstanding Accounts receivable * 365 69788 88658.5 28.26 33.65
Credit sales 2469.6 2635.1
Total Accounts Payable Accounts Payable * 365 103003 119428 177.71 145.52
Cost of Goods sold 579.6 820.7
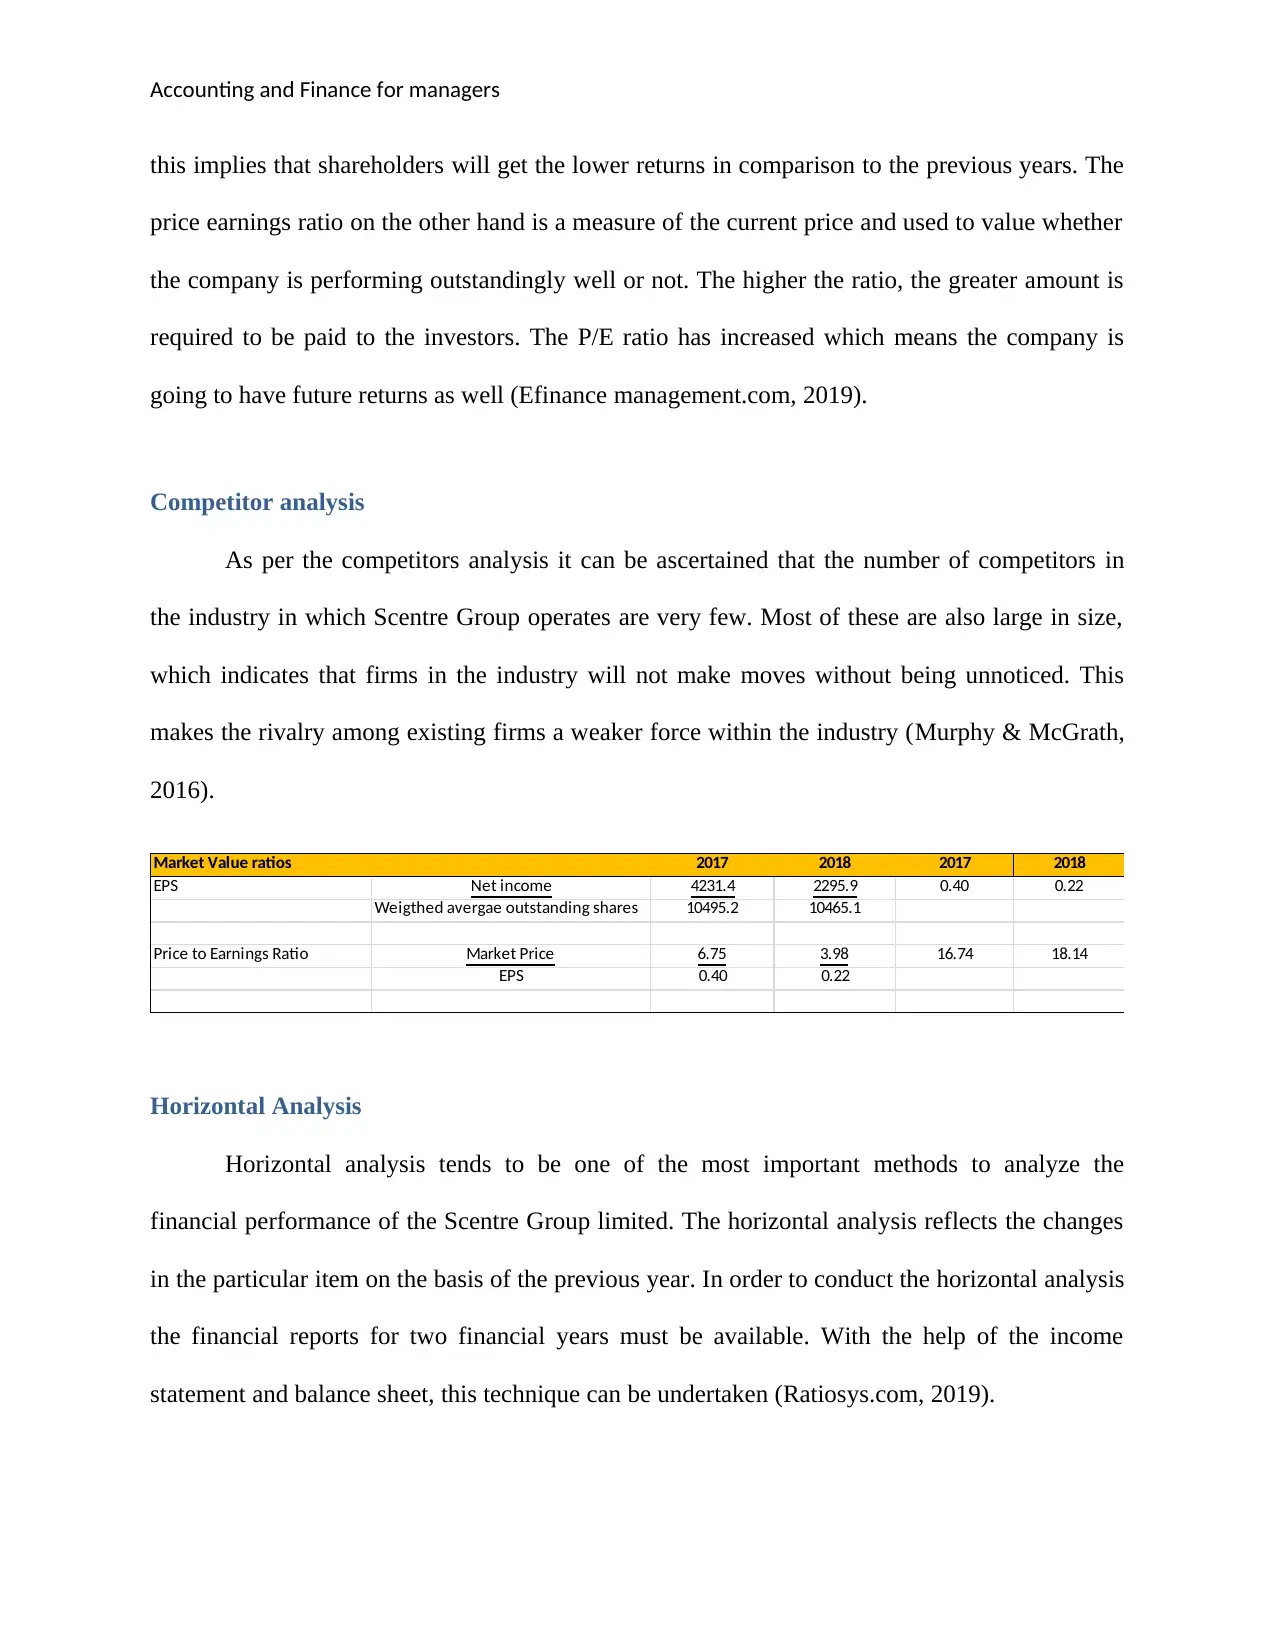
Market Performance
The market value ratios of the Scentre Group can be evaluated on the basis of Earnings
per share and P/E ratio of the company. The earnings per share is the ability to produce net
profits for common shareholders. The number becomes more beneficial when it is analyzed
against the previous year to understand the trends. The EPS have reduced from 0.40 to 0.22 and
Capital Structure 2017 2018 2017 2018
Debt to Equity Debt 12323.7 14643.1 0.54 0.61
Equity 22781.3 23865.8
Times interest coverage ratio EBIT 29924 66015 9.28 6.18
Interest Expense 3226 10676
Debt to Total Assets Debt 12323.7 14643.1 0.33 0.36
Total Assets 37415.6 40875
Efficiency
Efficiency ratios are the ratios that define how efficient a Scentre Group limited is in
maintaining the alignment between the collection of the cash and settlement of the current
liabilities on time. The time period if the key factor in deciding the efficiency. The day’s
receivable outstanding the technique to identify the time period taken by the debtors to pay back
the money for goods and services purchased. In this scenario, earlier the time period taken to
collect from debtors was 28.26 days and now the same has increased to 33.65 days and this
implies that the normal time period is exceeding and this needs to be limited. The total accounts
payable have decreased on the contrary which increases the chances of the company to become
more liquid by settling off the creditors and account payables (Baheti and Baheti, 2018).
Efficiency Ratios 2017 2018 2017 2018
Days Receivable Outstanding Accounts receivable * 365 69788 88658.5 28.26 33.65
Credit sales 2469.6 2635.1
Total Accounts Payable Accounts Payable * 365 103003 119428 177.71 145.52
Cost of Goods sold 579.6 820.7
Market Performance
The market value ratios of the Scentre Group can be evaluated on the basis of Earnings
per share and P/E ratio of the company. The earnings per share is the ability to produce net
profits for common shareholders. The number becomes more beneficial when it is analyzed
against the previous year to understand the trends. The EPS have reduced from 0.40 to 0.22 and
Paraphrase This Document
Need a fresh take? Get an instant paraphrase of this document with our AI Paraphraser
Accounting and Finance for managers
this implies that shareholders will get the lower returns in comparison to the previous years. The
price earnings ratio on the other hand is a measure of the current price and used to value whether
the company is performing outstandingly well or not. The higher the ratio, the greater amount is
required to be paid to the investors. The P/E ratio has increased which means the company is
going to have future returns as well (Efinance management.com, 2019).
Competitor analysis
As per the competitors analysis it can be ascertained that the number of competitors in
the industry in which Scentre Group operates are very few. Most of these are also large in size,
which indicates that firms in the industry will not make moves without being unnoticed. This
makes the rivalry among existing firms a weaker force within the industry (Murphy & McGrath,
2016).
Market Value ratios 2017 2018 2017 2018
EPS Net income 4231.4 2295.9 0.40 0.22
Weigthed avergae outstanding shares 10495.2 10465.1
Price to Earnings Ratio Market Price 6.75 3.98 16.74 18.14
EPS 0.40 0.22
Horizontal Analysis
Horizontal analysis tends to be one of the most important methods to analyze the
financial performance of the Scentre Group limited. The horizontal analysis reflects the changes
in the particular item on the basis of the previous year. In order to conduct the horizontal analysis
the financial reports for two financial years must be available. With the help of the income
statement and balance sheet, this technique can be undertaken (Ratiosys.com, 2019).
Accounting and Finance for managers
2015 2016 2017 2018
0
500
1000
1500
2000
2500
3000
3500
4000
4500
Net profit
Net profit
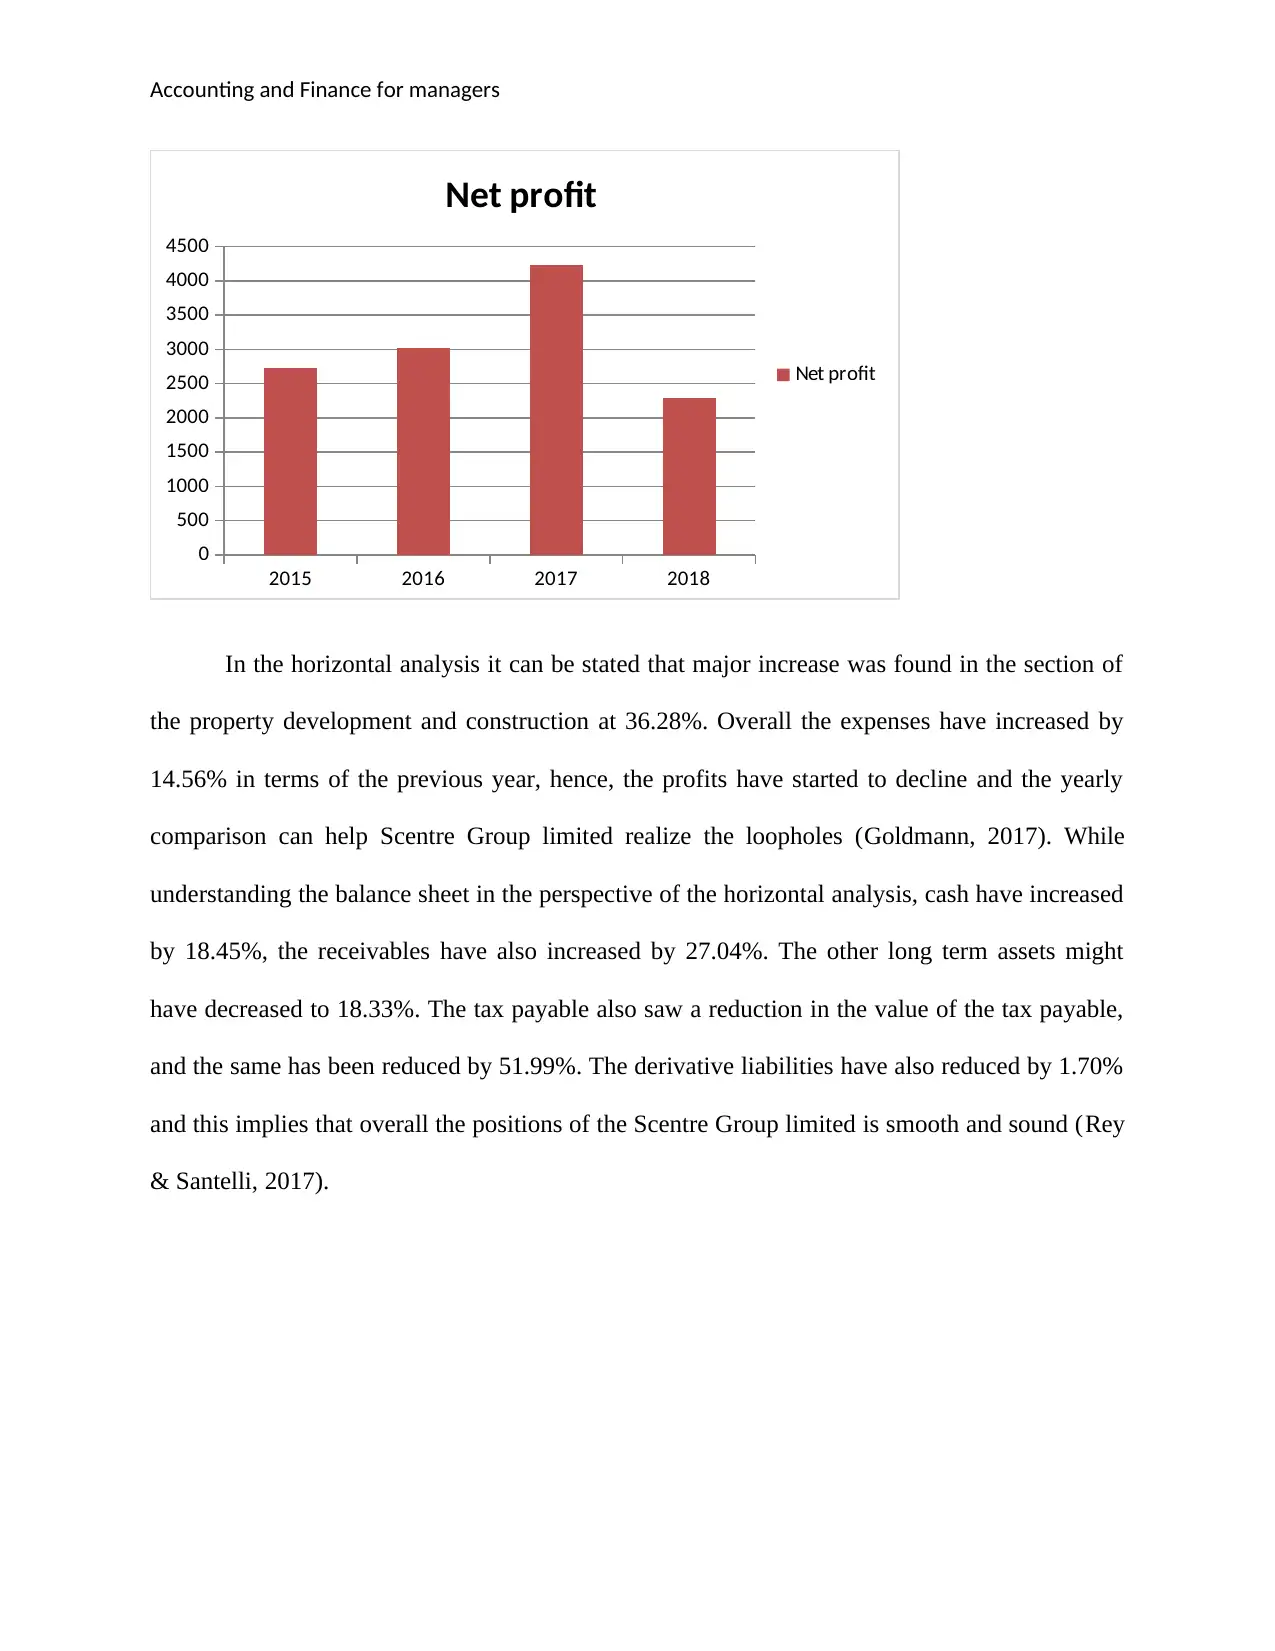
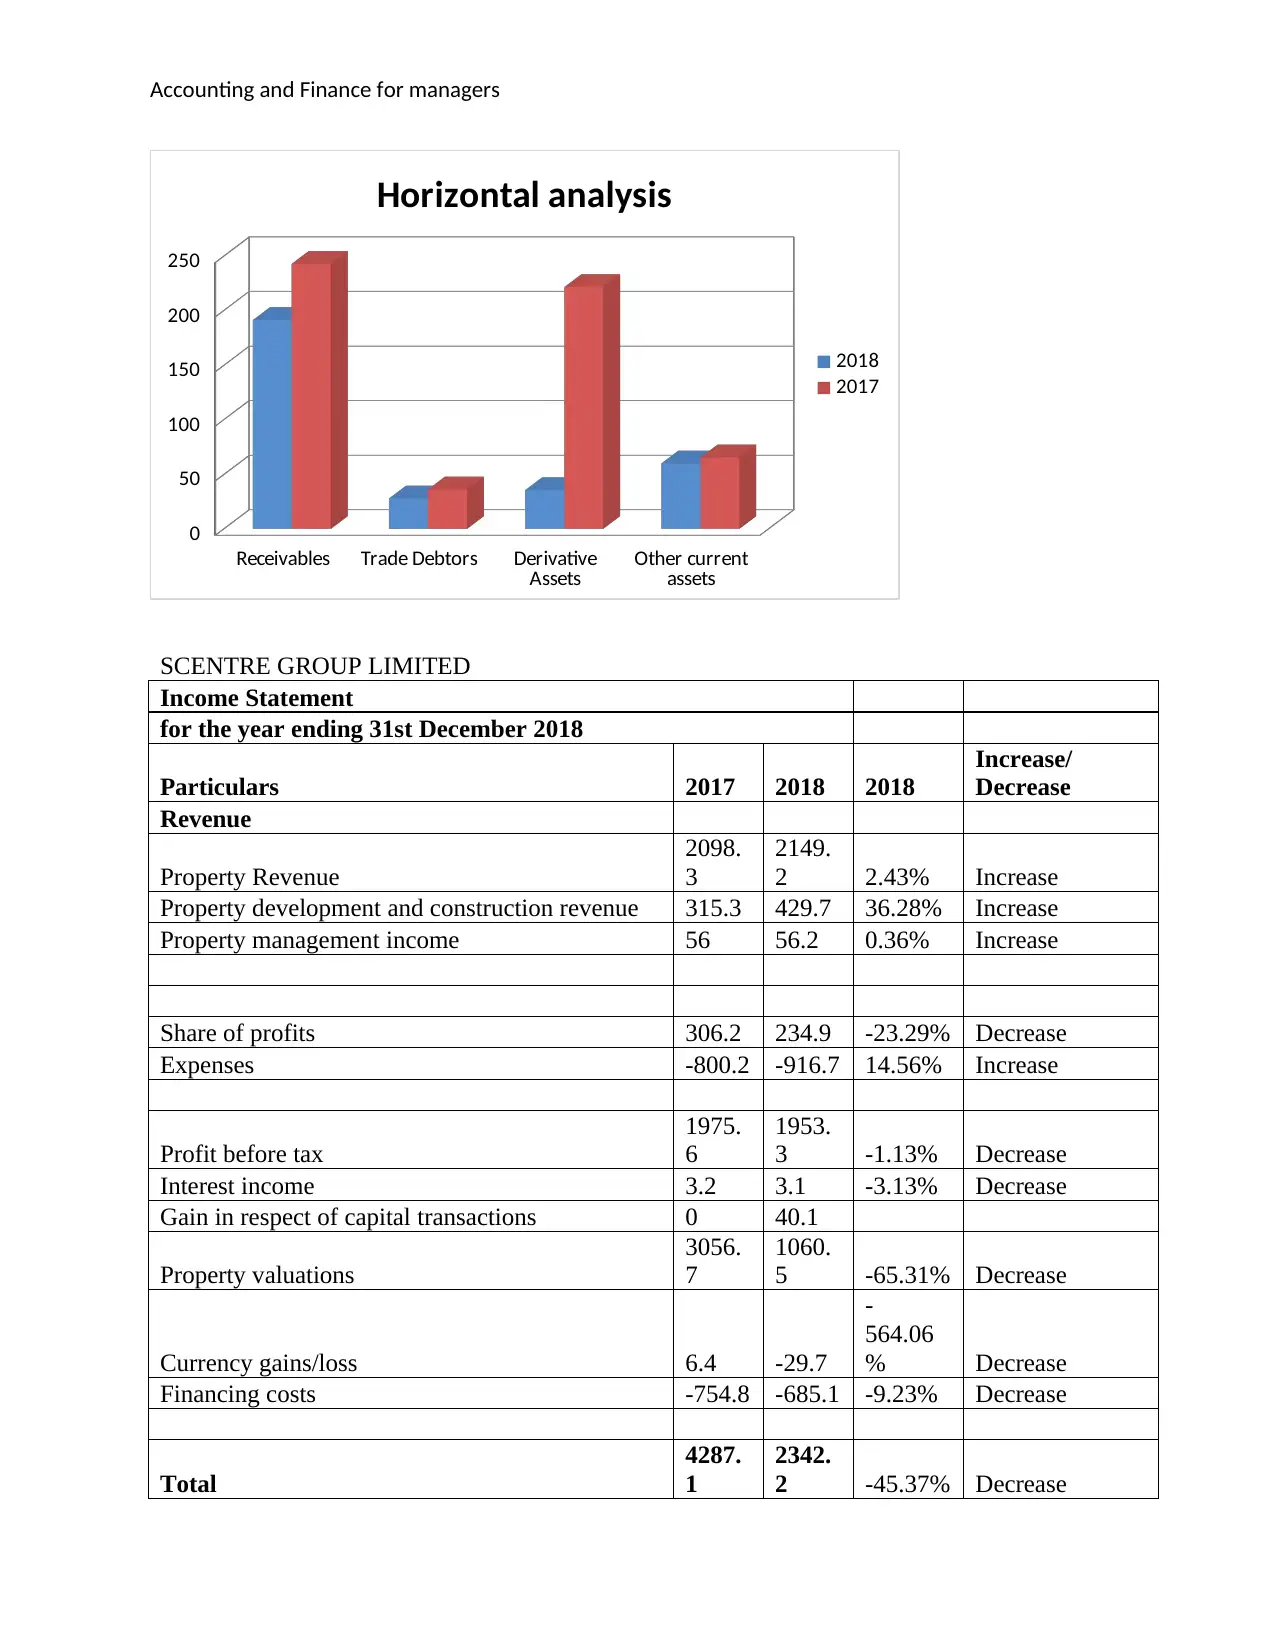
In the horizontal analysis it can be stated that major increase was found in the section of
the property development and construction at 36.28%. Overall the expenses have increased by
14.56% in terms of the previous year, hence, the profits have started to decline and the yearly
comparison can help Scentre Group limited realize the loopholes (Goldmann, 2017). While
understanding the balance sheet in the perspective of the horizontal analysis, cash have increased
by 18.45%, the receivables have also increased by 27.04%. The other long term assets might
have decreased to 18.33%. The tax payable also saw a reduction in the value of the tax payable,
and the same has been reduced by 51.99%. The derivative liabilities have also reduced by 1.70%
and this implies that overall the positions of the Scentre Group limited is smooth and sound (Rey
& Santelli, 2017).
2015 2016 2017 2018
0
500
1000
1500
2000
2500
3000
3500
4000
4500
Net profit
Net profit
In the horizontal analysis it can be stated that major increase was found in the section of
the property development and construction at 36.28%. Overall the expenses have increased by
14.56% in terms of the previous year, hence, the profits have started to decline and the yearly
comparison can help Scentre Group limited realize the loopholes (Goldmann, 2017). While
understanding the balance sheet in the perspective of the horizontal analysis, cash have increased
by 18.45%, the receivables have also increased by 27.04%. The other long term assets might
have decreased to 18.33%. The tax payable also saw a reduction in the value of the tax payable,
and the same has been reduced by 51.99%. The derivative liabilities have also reduced by 1.70%
and this implies that overall the positions of the Scentre Group limited is smooth and sound (Rey
& Santelli, 2017).
⊘ This is a preview!⊘
Do you want full access?
Subscribe today to unlock all pages.
Trusted by 1+ million students worldwide
Accounting and Finance for managers
Receivables Trade Debtors Derivative
Assets Other current
assets
0
50
100
150
200
250
Horizontal analysis
2018
2017
SCENTRE GROUP LIMITED
Income Statement
for the year ending 31st December 2018
Particulars 2017 2018 2018
Increase/
Decrease
Revenue
Property Revenue
2098.
3
2149.
2 2.43% Increase
Property development and construction revenue 315.3 429.7 36.28% Increase
Property management income 56 56.2 0.36% Increase
Share of profits 306.2 234.9 -23.29% Decrease
Expenses -800.2 -916.7 14.56% Increase
Profit before tax
1975.
6
1953.
3 -1.13% Decrease
Interest income 3.2 3.1 -3.13% Decrease
Gain in respect of capital transactions 0 40.1
Property valuations
3056.
7
1060.
5 -65.31% Decrease
Currency gains/loss 6.4 -29.7
-
564.06
% Decrease
Financing costs -754.8 -685.1 -9.23% Decrease
Total
4287.
1
2342.
2 -45.37% Decrease
Paraphrase This Document
Need a fresh take? Get an instant paraphrase of this document with our AI Paraphraser
Accounting and Finance for managers
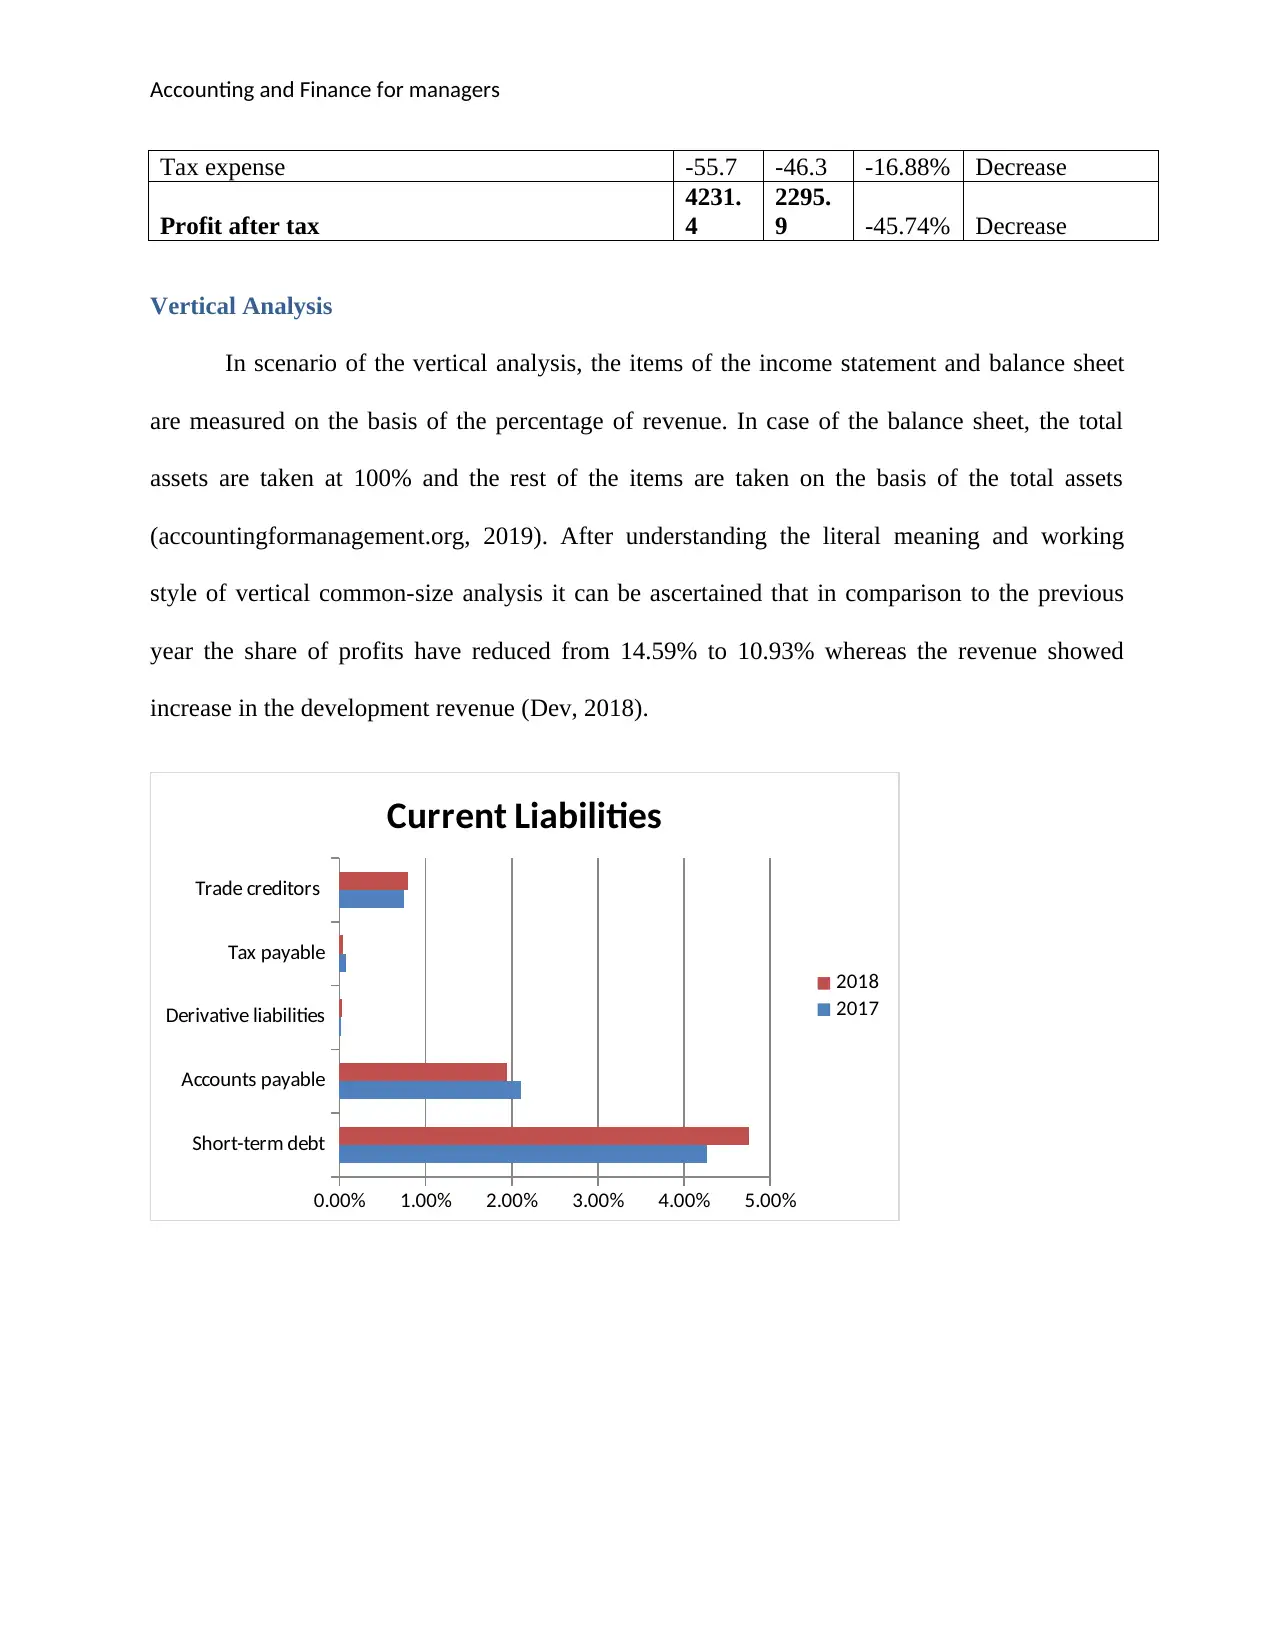
Tax expense -55.7 -46.3 -16.88% Decrease
Profit after tax
4231.
4
2295.
9 -45.74% Decrease
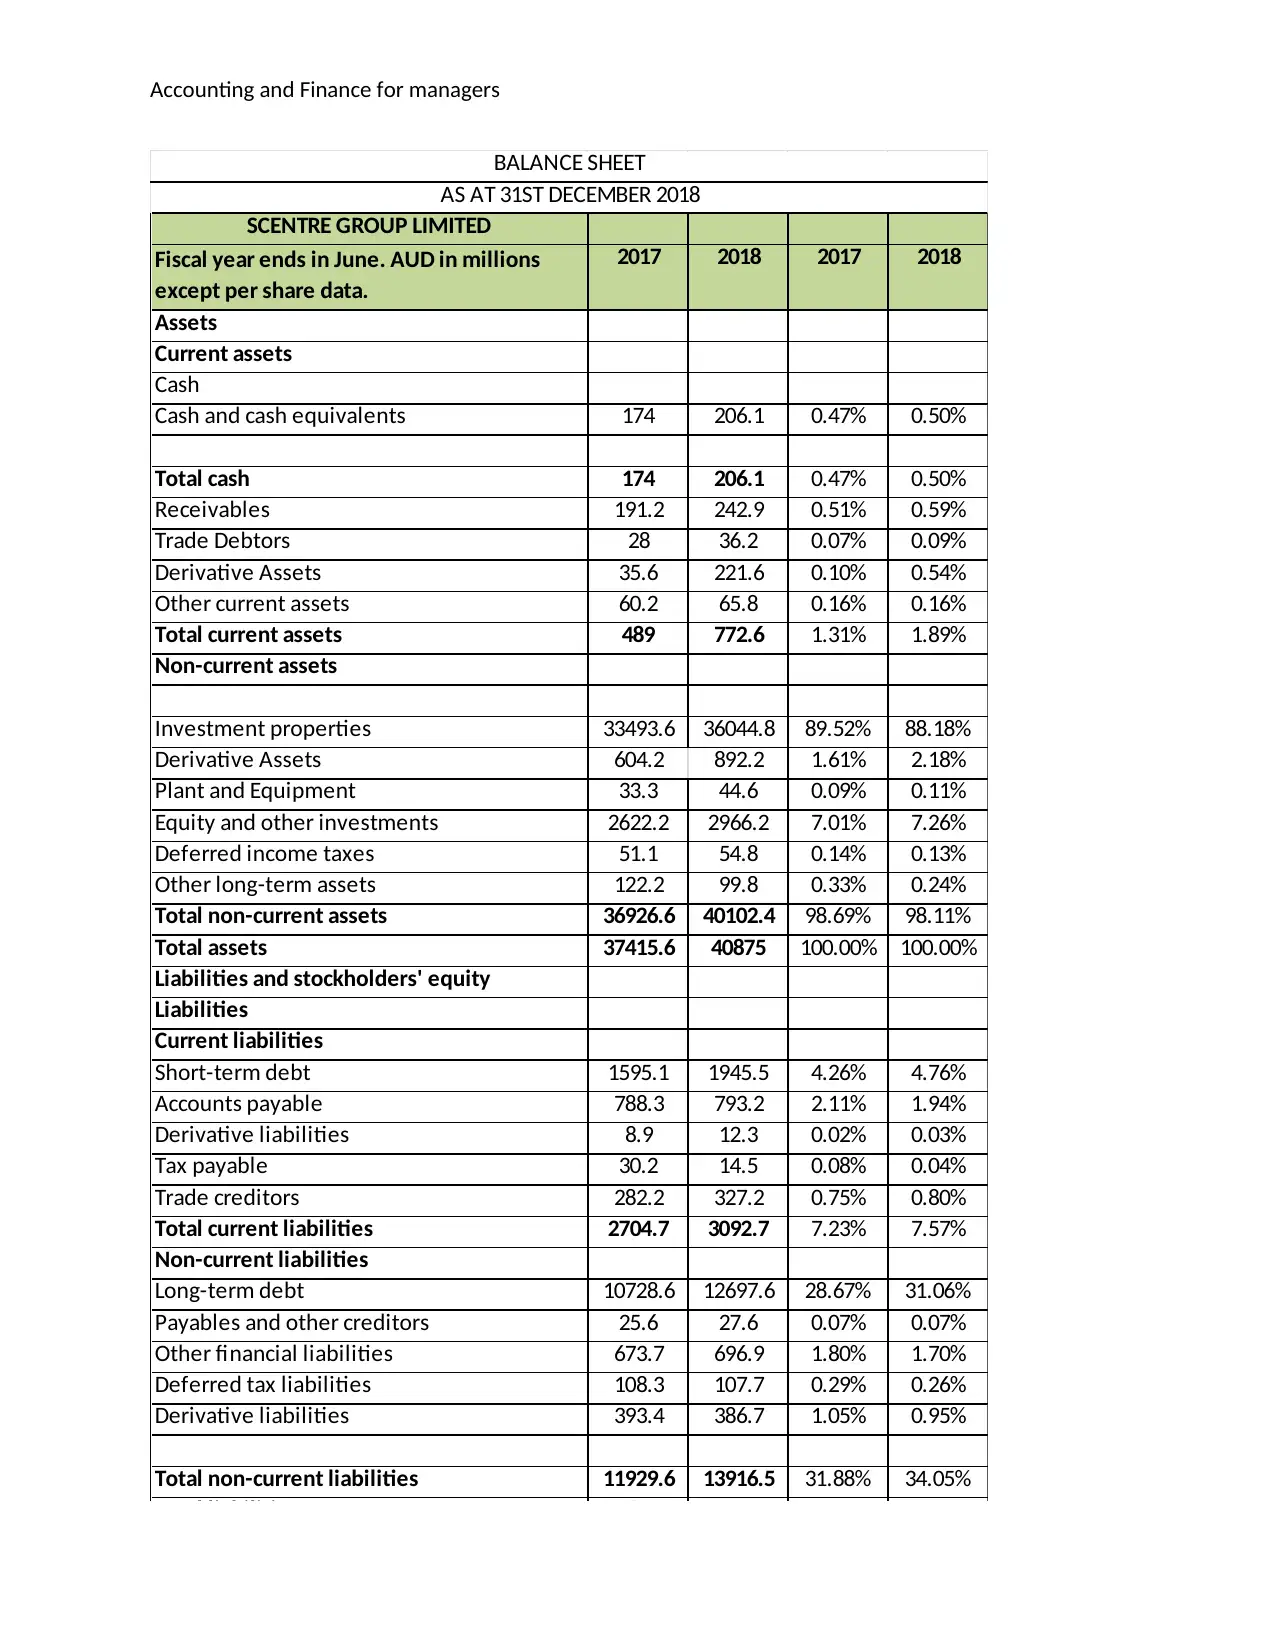
Vertical Analysis
In scenario of the vertical analysis, the items of the income statement and balance sheet
are measured on the basis of the percentage of revenue. In case of the balance sheet, the total
assets are taken at 100% and the rest of the items are taken on the basis of the total assets
(accountingformanagement.org, 2019). After understanding the literal meaning and working
style of vertical common-size analysis it can be ascertained that in comparison to the previous
year the share of profits have reduced from 14.59% to 10.93% whereas the revenue showed
increase in the development revenue (Dev, 2018).
Short-term debt
Accounts payable
Derivative liabilities
Tax payable
Trade creditors
0.00% 1.00% 2.00% 3.00% 4.00% 5.00%
Current Liabilities
2018
2017
Tax expense -55.7 -46.3 -16.88% Decrease
Profit after tax
4231.
4
2295.
9 -45.74% Decrease
Vertical Analysis
In scenario of the vertical analysis, the items of the income statement and balance sheet
are measured on the basis of the percentage of revenue. In case of the balance sheet, the total
assets are taken at 100% and the rest of the items are taken on the basis of the total assets
(accountingformanagement.org, 2019). After understanding the literal meaning and working
style of vertical common-size analysis it can be ascertained that in comparison to the previous
year the share of profits have reduced from 14.59% to 10.93% whereas the revenue showed
increase in the development revenue (Dev, 2018).
Short-term debt
Accounts payable
Derivative liabilities
Tax payable
Trade creditors
0.00% 1.00% 2.00% 3.00% 4.00% 5.00%
Current Liabilities
2018
2017
Accounting and Finance for managers
SCENTRE GROUP LIMITED
Fiscal year ends in June. AUD in millions
except per share data.
2017 2018 2017 2018
Assets
Current assets
Cash
Cash and cash equivalents 174 206.1 0.47% 0.50%
Total cash 174 206.1 0.47% 0.50%
Receivables 191.2 242.9 0.51% 0.59%
Trade Debtors 28 36.2 0.07% 0.09%
Derivative Assets 35.6 221.6 0.10% 0.54%
Other current assets 60.2 65.8 0.16% 0.16%
Total current assets 489 772.6 1.31% 1.89%
Non-current assets
Investment properties 33493.6 36044.8 89.52% 88.18%
Derivative Assets 604.2 892.2 1.61% 2.18%
Plant and Equipment 33.3 44.6 0.09% 0.11%
Equity and other investments 2622.2 2966.2 7.01% 7.26%
Deferred income taxes 51.1 54.8 0.14% 0.13%
Other long-term assets 122.2 99.8 0.33% 0.24%
Total non-current assets 36926.6 40102.4 98.69% 98.11%
Total assets 37415.6 40875 100.00% 100.00%
Liabilities and stockholders' equity
Liabilities
Current liabilities
Short-term debt 1595.1 1945.5 4.26% 4.76%
Accounts payable 788.3 793.2 2.11% 1.94%
Derivative liabilities 8.9 12.3 0.02% 0.03%
Tax payable 30.2 14.5 0.08% 0.04%
Trade creditors 282.2 327.2 0.75% 0.80%
Total current liabilities 2704.7 3092.7 7.23% 7.57%
Non-current liabilities
Long-term debt 10728.6 12697.6 28.67% 31.06%
Payables and other creditors 25.6 27.6 0.07% 0.07%
Other financial liabilities 673.7 696.9 1.80% 1.70%
Deferred tax liabilities 108.3 107.7 0.29% 0.26%
Derivative liabilities 393.4 386.7 1.05% 0.95%
Total non-current liabilities 11929.6 13916.5 31.88% 34.05%
Total liabilities 14634.3 17009.2 39.11% 41.61%
Stockholders' equity
Common stock 10495.2 10465.1 28.05% 25.60%
Reserves 86.6 108.7 0.23% 0.27%
Retained profits 11952.1 13063.9 31.94% 31.96%
BALANCE SHEET
AS AT 31ST DECEMBER 2018
⊘ This is a preview!⊘
Do you want full access?
Subscribe today to unlock all pages.
Trusted by 1+ million students worldwide
1 out of 20
Related Documents


Your All-in-One AI-Powered Toolkit for Academic Success.
+13062052269
info@desklib.com
Available 24*7 on WhatsApp / Email
![[object Object]](/_next/static/media/star-bottom.7253800d.svg)
Unlock your academic potential
Copyright © 2020–2026 A2Z Services. All Rights Reserved. Developed and managed by ZUCOL.