System Management: Server Availability Monitoring Tools Report
VerifiedAdded on 2022/12/01
|10
|2450
|437
Report
AI Summary
This report provides a detailed comparison of various server availability monitoring tools, including Nagios, Ganglia, CollectD, Spiceworks, Cacti, Zabbix, Icinga, OpenNMS, and WhatsUp Gold. The comparison focuses on key metrics such as disk space, CPU monitoring, process monitoring, bandwidth, and resource measuring. The report then discusses and evaluates the architecture of server availability monitoring, emphasizing the importance of constant server activity and the role of monitoring modules. A solution to avoid data vulnerability through server synchronization is proposed, highlighting the significance of data backup and recovery. Finally, the impact of failure prediction on server availability monitoring is discussed, emphasizing the potential consequences of inaccurate data and the importance of real-time data for organizational decision-making. The report concludes by stressing the impact of failure prediction on server availability monitoring.
Running Head: MONITORING TOOLS
MONITORING TOOLS
Insert Your Name Here
Insert Your Tutor’s Name Here
Institution Affiliation
Date
MONITORING TOOLS
Insert Your Name Here
Insert Your Tutor’s Name Here
Institution Affiliation
Date
Paraphrase This Document
Need a fresh take? Get an instant paraphrase of this document with our AI Paraphraser
MONITORING TOOLS
1. Comparison of the above server availability monitoring tools to check their performance
Nagios
Nagios is one of the most used monitoring tool in the servers
I. Disk space
Nagios checks the disk space. The tool looks for three parameters in disk space. They include: the total
disk space on the partition, the currently used disk space and the free disk space. The disk space is
calculated in bytes. The used space is calculated in bytes and percentage. The free disk space is
calculated is also calculated in bytes and percentages. The performance data is then reported by Nagios
tool is reported in bytes in order to scale the graph accordingly and apply the right multiplier.
2.CPI monitoring
Nagios has a plugin called check load that is used to check the current CPU load.
3.Process monitoring
Nagios checks the performance of the server in min/max values and displays warning or critical
thresholds.
4. Band width:
Nagios provides bandwidth monitoring of the switches and the routers in network. It uses SNMP to
deliver the bandwidth utilization for both the inbound and the outbound traffic. Nagios XI is preferred
for this service as it it easier. It discovers the network abusers, there is fast detection and it is has the
ability to track every port utilization and errors.
5. Resource Measuring:
Nagios has a plugin call check_mem that is used to monitor the memory uses on a server.
6 . Overall availability
Nagios is one of the best server monitoring tools as it is easy to understand the report from the server
performance.
Ganglia
Ganglia is a monitoring system that is used for the high performance computing systems such as the
clusters and the grids.
I. Disk space
To get the disk space usage a module called diskstst.py is used. Details of the free space and used
space is displayed in percentages.
MONITORING TOOLS
2.CPU monitoring
The metrics for the CPU load are monitors and the report for the is displayed. Ganglia can be used to
monitor the CPU load for many host upto 20,000 hosts. The host are organized into Ganglia cluster of
100 host each.
3.Process monitoring
With ganglia on can monitor the server process and the time taken in the process.
4. Band width:
As Ganglia is able to monitor multiple host the entire network is also monitored. Actually, Ganglia is
the best tool to monitor the bandwidth in the networks.
5. Resource Measuring:
Ganglia measure the utilization of resources in the host. This include the memory ,swap
6 . Overall availability
The presentation of report from ganglia is okay. The have implemented the ideal data visualization on
the frontend. Ganglia is more expensive than Nagios are it has the capability of motoring up to 20,000
hosts.
CollectD
CollectD is another tool that is used to monitor the performance of server, in order to minimize on
unnecessary crashes of the server. It collect the metric data and store it in the RRD files.
1. Disk space
Collectd collects the performance information of the disks. This includes the information about the read
and write operations and how much time is needed to execute the operations [1].
2.CPU monitoring
CollectD displays the task the CPU is handling . The report is displayed in graphs and each graph
represents a single core of the processor.
3.Process monitoring
CollectD monitors the utilization of the user processes.
4. Band width:
CollectD is also used in measure the network bandwidth usage.
2.CPU monitoring
The metrics for the CPU load are monitors and the report for the is displayed. Ganglia can be used to
monitor the CPU load for many host upto 20,000 hosts. The host are organized into Ganglia cluster of
100 host each.
3.Process monitoring
With ganglia on can monitor the server process and the time taken in the process.
4. Band width:
As Ganglia is able to monitor multiple host the entire network is also monitored. Actually, Ganglia is
the best tool to monitor the bandwidth in the networks.
5. Resource Measuring:
Ganglia measure the utilization of resources in the host. This include the memory ,swap
6 . Overall availability
The presentation of report from ganglia is okay. The have implemented the ideal data visualization on
the frontend. Ganglia is more expensive than Nagios are it has the capability of motoring up to 20,000
hosts.
CollectD
CollectD is another tool that is used to monitor the performance of server, in order to minimize on
unnecessary crashes of the server. It collect the metric data and store it in the RRD files.
1. Disk space
Collectd collects the performance information of the disks. This includes the information about the read
and write operations and how much time is needed to execute the operations [1].
2.CPU monitoring
CollectD displays the task the CPU is handling . The report is displayed in graphs and each graph
represents a single core of the processor.
3.Process monitoring
CollectD monitors the utilization of the user processes.
4. Band width:
CollectD is also used in measure the network bandwidth usage.
⊘ This is a preview!⊘
Do you want full access?
Subscribe today to unlock all pages.
Trusted by 1+ million students worldwide
MONITORING TOOLS
5. Resource Measuring:
CollectD also monitors the memory utilization, and swap space utilization. It alerts when the swap
space has be used. And gives warning when the memory is full.
6 . Overall availability
CollectD displays information regarding the traffic in octets per second, the number of packets and the
errors detected. CollectD tool is cheap and and the support on using the tool is available.
Spiceworks
1. Disk space
Spiceworks uses a plugin named Netwrix disk space monitor. The plugin automatically monitors low
disk space on multiple servers.
2.CPU monitoring
Spiceworks is used to be the CPU load for the process responsible and displays the result in a
graphical representation
3.Process monitoring
It monitors the user processes.
4. Band width:
Spiceworks monitors the network bandwidth and checks for the bottlenecks.
5. Resource Measuring:
Spiceworks measures the memory usage and the rate of swap.
6 . Overall availability
Spiceworks is free and it is efficiency in monitoring the server health. The alerts are also customization
[2].
Cacti
1. Disk space
Cacti is used in monitoring the disk space using SNMP [3].
2.CPU monitoring
Cacti measure the CPU load
3.Process monitoring
5. Resource Measuring:
CollectD also monitors the memory utilization, and swap space utilization. It alerts when the swap
space has be used. And gives warning when the memory is full.
6 . Overall availability
CollectD displays information regarding the traffic in octets per second, the number of packets and the
errors detected. CollectD tool is cheap and and the support on using the tool is available.
Spiceworks
1. Disk space
Spiceworks uses a plugin named Netwrix disk space monitor. The plugin automatically monitors low
disk space on multiple servers.
2.CPU monitoring
Spiceworks is used to be the CPU load for the process responsible and displays the result in a
graphical representation
3.Process monitoring
It monitors the user processes.
4. Band width:
Spiceworks monitors the network bandwidth and checks for the bottlenecks.
5. Resource Measuring:
Spiceworks measures the memory usage and the rate of swap.
6 . Overall availability
Spiceworks is free and it is efficiency in monitoring the server health. The alerts are also customization
[2].
Cacti
1. Disk space
Cacti is used in monitoring the disk space using SNMP [3].
2.CPU monitoring
Cacti measure the CPU load
3.Process monitoring
Paraphrase This Document
Need a fresh take? Get an instant paraphrase of this document with our AI Paraphraser
MONITORING TOOLS
Cacti is used to measure the running processes using SNMP.
4. Band width:
Cacti also measure the network between other hardware and the servers.
5. Resource Measuring:
Its monitor the RAM usage.
6 . Overall availability
The data is displayed in graphical representation using the RDD file. It sends alerts based on the
configurations set. Cacti configuration via the web interface is tedious. Cacti is mainly for collecting a
lot of data and storing in in the database.
Zabbix
1. Disk space
Zabbix monitors the disk space usage. Zabbix does not detect disk increase in a short period
2.CPI monitoring
Zabbix monitors the the use of each processor core.
3.Process monitoring
Zabbix monitors the process in the server efficiently
4. Band width:
Zabbix monitors the network bandwidth and checks for bottle necks.
5. Resource Measuring:
6 . Overall availability
It is free and it can measure the processes, CPU load, network, resources efficiently [4].
Icinga,
1. Disk space
Icinga uses the NRPE file to monitor the disk usage.
2.CPU monitoring
Icinga monitors the processor load.
3.Process monitoring
Icinga monitors the processes for each users.
MONITORING TOOLS
4. Band width:
Icinga is used to monitor the user facing network interface. Its also measures the traffic bandwidth in
the network [5].
5. Resource Measuring:
Icinga is used to monitor the network devices and the resources that are connected to its network.
6 . Overall availability
Icinga tool is free and is Nagios compatible. It is more of a network monitoring tool.
OpenNMS
1. Disk space
OpenNMS is used to monitor the disk utilization and send alerts when the usage is too high.
2.CPU monitoring
OpenNMS monitor the CPU load for the server and shows a report on the CPU utilization.
3.Process monitoring
OpenNMS is used to monitor the user process and give report on ever user processes.
4. Band width:
OpenNMS is used for monitoring the network traffic and the bandwidth consumption.
5. Resource Measuring:
OpenNMS measures resource such as the memory usage, the swap space utilization and send alerts
when there is high utilization in any resource.
6 . Overall availability
The software is free and there is no need to configure the way to collect data. The monitoring tool
provides a suitable data collection platform [6].
WhatsUp Gold
1. Disk space
WhatsUp Gold is used in measuring the disk utilization and sends alerts for low disk space.
2.CPU monitoring
WhatsUp Gold is used to measure the performance of the CPU and reports per device or per CPU.
4. Band width:
Icinga is used to monitor the user facing network interface. Its also measures the traffic bandwidth in
the network [5].
5. Resource Measuring:
Icinga is used to monitor the network devices and the resources that are connected to its network.
6 . Overall availability
Icinga tool is free and is Nagios compatible. It is more of a network monitoring tool.
OpenNMS
1. Disk space
OpenNMS is used to monitor the disk utilization and send alerts when the usage is too high.
2.CPU monitoring
OpenNMS monitor the CPU load for the server and shows a report on the CPU utilization.
3.Process monitoring
OpenNMS is used to monitor the user process and give report on ever user processes.
4. Band width:
OpenNMS is used for monitoring the network traffic and the bandwidth consumption.
5. Resource Measuring:
OpenNMS measures resource such as the memory usage, the swap space utilization and send alerts
when there is high utilization in any resource.
6 . Overall availability
The software is free and there is no need to configure the way to collect data. The monitoring tool
provides a suitable data collection platform [6].
WhatsUp Gold
1. Disk space
WhatsUp Gold is used in measuring the disk utilization and sends alerts for low disk space.
2.CPU monitoring
WhatsUp Gold is used to measure the performance of the CPU and reports per device or per CPU.
⊘ This is a preview!⊘
Do you want full access?
Subscribe today to unlock all pages.
Trusted by 1+ million students worldwide
MONITORING TOOLS
3.Process monitoring
WhatsUp Gold also measure the utilization of processes per user.
4. Band width:
WhatsUp Gold monitors the bandwidth. This tools tends to determine the users, applications and hosts
using a critical bandwidth [7].
5. Resource Measuring:
It monitors the memory utilization on the selected device.
6 . Overall availability
The tools is great has a user interface that is easy to understand. The tools has to be purchased .
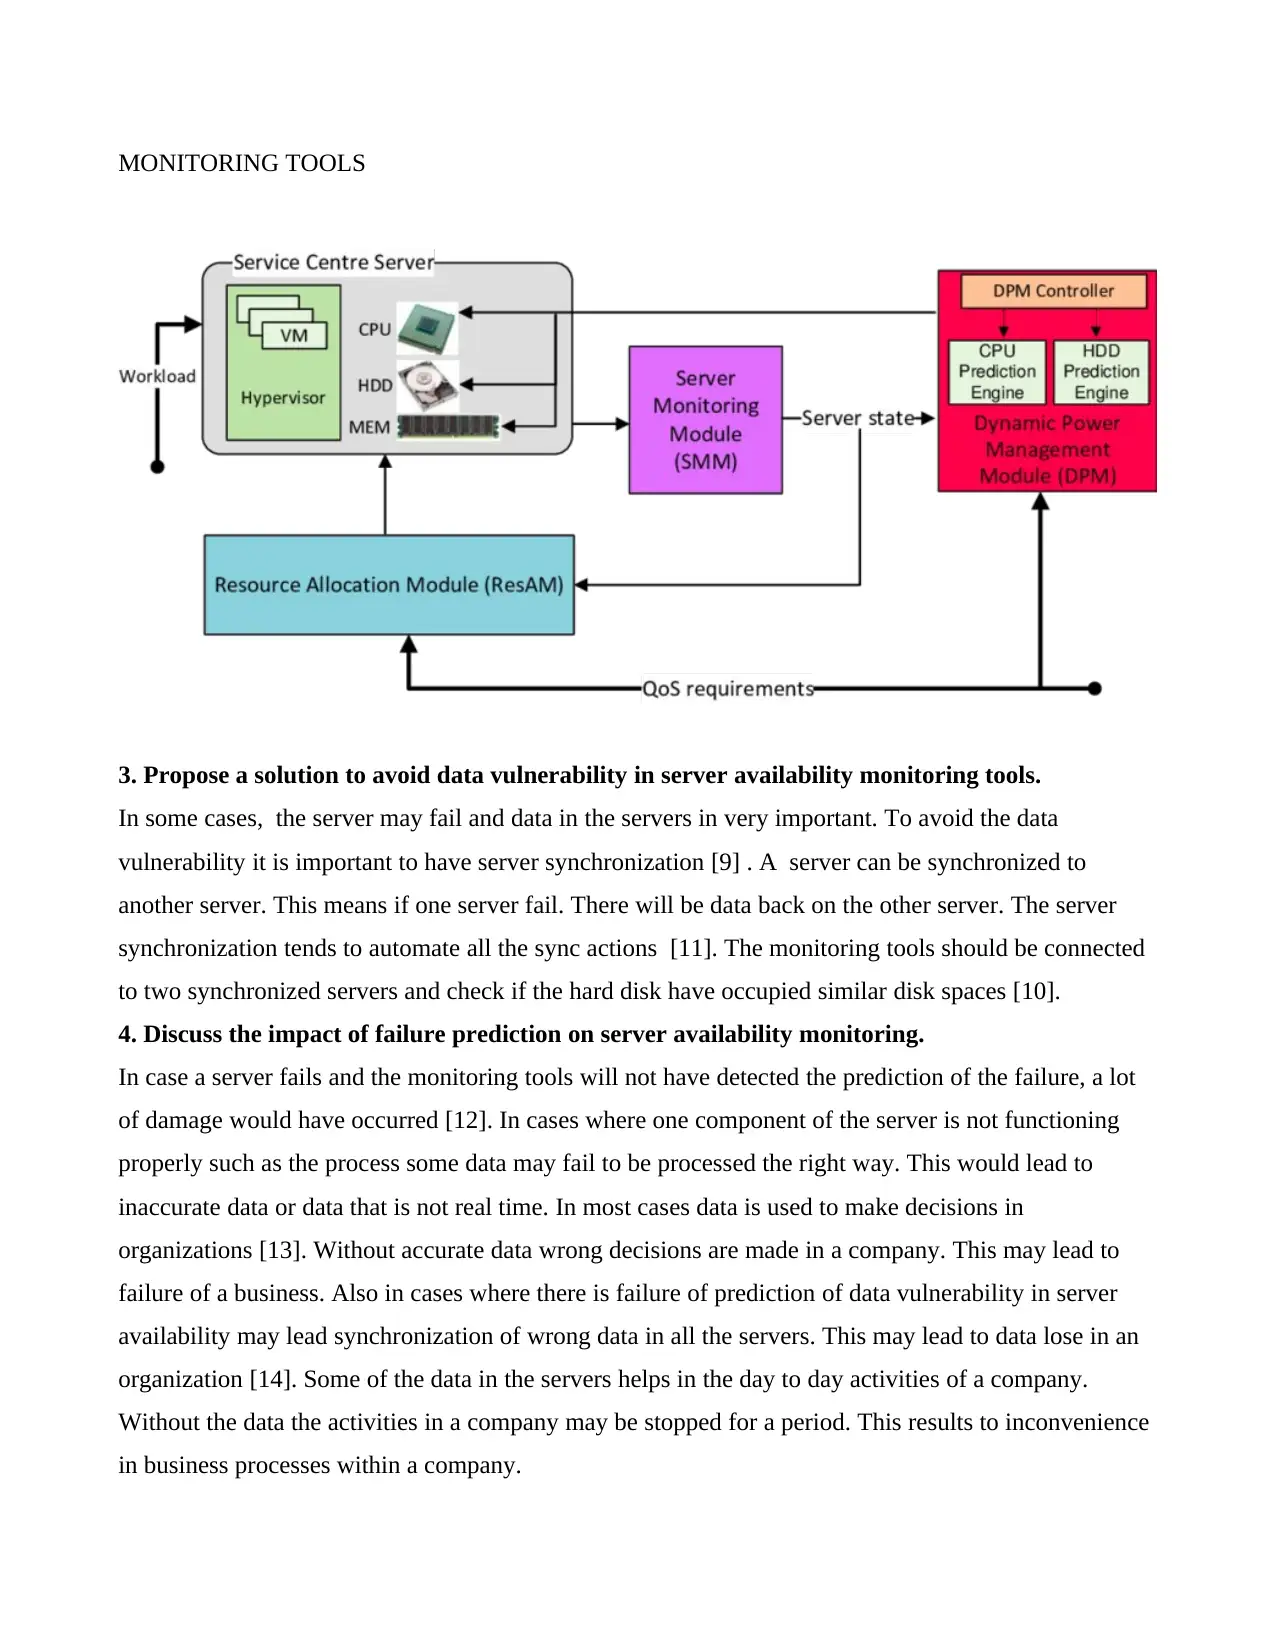
2. Discuss and evaluate in detail the server availability monitoring architecture.
The network servers need to be active constantly. These servers include the web-servers, the email
server and routers. The servers should not have any downtime. The servers could be unavailable due to
lack of power. A Dynamic Power Management Controller is necessary to ensure the server is available.
In the server a monitoring module such as Nagios Core will be installed to check if the CPU , hard disk,
memory and the Virtual Machines (VM). Once the CPU,memory and the hard disks are functioning
okay the the resource allocation module will allocate the resource accordingly to the server. In the way
the server will always be on and the the server component will be monitored frequently [8].
3.Process monitoring
WhatsUp Gold also measure the utilization of processes per user.
4. Band width:
WhatsUp Gold monitors the bandwidth. This tools tends to determine the users, applications and hosts
using a critical bandwidth [7].
5. Resource Measuring:
It monitors the memory utilization on the selected device.
6 . Overall availability
The tools is great has a user interface that is easy to understand. The tools has to be purchased .
2. Discuss and evaluate in detail the server availability monitoring architecture.
The network servers need to be active constantly. These servers include the web-servers, the email
server and routers. The servers should not have any downtime. The servers could be unavailable due to
lack of power. A Dynamic Power Management Controller is necessary to ensure the server is available.
In the server a monitoring module such as Nagios Core will be installed to check if the CPU , hard disk,
memory and the Virtual Machines (VM). Once the CPU,memory and the hard disks are functioning
okay the the resource allocation module will allocate the resource accordingly to the server. In the way
the server will always be on and the the server component will be monitored frequently [8].
Paraphrase This Document
Need a fresh take? Get an instant paraphrase of this document with our AI Paraphraser
MONITORING TOOLS
3. Propose a solution to avoid data vulnerability in server availability monitoring tools.
In some cases, the server may fail and data in the servers in very important. To avoid the data
vulnerability it is important to have server synchronization [9] . A server can be synchronized to
another server. This means if one server fail. There will be data back on the other server. The server
synchronization tends to automate all the sync actions [11]. The monitoring tools should be connected
to two synchronized servers and check if the hard disk have occupied similar disk spaces [10].
4. Discuss the impact of failure prediction on server availability monitoring.
In case a server fails and the monitoring tools will not have detected the prediction of the failure, a lot
of damage would have occurred [12]. In cases where one component of the server is not functioning
properly such as the process some data may fail to be processed the right way. This would lead to
inaccurate data or data that is not real time. In most cases data is used to make decisions in
organizations [13]. Without accurate data wrong decisions are made in a company. This may lead to
failure of a business. Also in cases where there is failure of prediction of data vulnerability in server
availability may lead synchronization of wrong data in all the servers. This may lead to data lose in an
organization [14]. Some of the data in the servers helps in the day to day activities of a company.
Without the data the activities in a company may be stopped for a period. This results to inconvenience
in business processes within a company.
MONITORING TOOLS
References
[1]V. Fernández, A. Pazos, J. Saborido and M. Seco, "Arduino and Nagios integration for monitoring",
Journal of Physics: Conference Series, vol. 513, no. 6, p. 062015, 2014. Available: 10.1088/1742-
6596/513/6/062015.
[2]R. Needleman, "Spiceworks' free network monitoring: What's the catch?", CNET, 2019. [Online].
Available: https://www.cnet.com/news/spiceworks-free-network-monitoring-whats-the-catch/.
[Accessed: 28- Apr- 2019].
[3]"Open Source NMS - Best Free Tools for Network Monitoring & Management", PC & Network
Downloads - PCWDLD.com, 2019. [Online]. Available: https://www.pcwdld.com/best-open-source-
network-monitoring-software. [Accessed: 28- Apr- 2019].
[4]"Zabbix:: The Enterprise-Class Open Source Network Monitoring Solution", Zabbix.com, 2019.
[Online]. Available: https://www.zabbix.com. [Accessed: 28- Apr- 2019].
[5]"Icinga monitoring tool", Icinga, 2019. [Online]. Available: https://icinga.com/. [Accessed: 28- Apr-
2019].
[6]"OpenNMS", The OpenNMS Group, Inc., 2019. [Online]. Available: https://www.opennms.com/.
[Accessed: 28- Apr- 2019].
[7]"Network Monitoring Made Easy - WhatsUp Gold", WhatsUp Gold, 2019. [Online]. Available:
https://www.whatsupgold.com/. [Accessed: 28- Apr- 2019].
[8]"Monitoring server based server selection strategy in content delivery networks", INTERNATIONAL
JOURNAL OF LATEST TRENDS IN ENGINEERING AND TECHNOLOGY, vol. 7, no. 3, 2016.
Available: 10.21172/1.73.523.
⊘ This is a preview!⊘
Do you want full access?
Subscribe today to unlock all pages.
Trusted by 1+ million students worldwide
MONITORING TOOLS
[9]S. Garg and N. Baliyan, "Data on Vulnerability Detection in Servers", Data in Brief, vol. 22, pp.
1081-1087, 2019. Available: 10.1016/j.dib.2018.12.038.
[10]A. Romanovsky, "How to make a recoverable server by synchronization data inheriting", ACM
SIGPLAN OOPS Messenger, vol. 6, no. 1, pp. 7-13, 2013. Available: 10.1145/209866.209868.
[11]"Top Two Ways to Synchronize Files between Windows Servers", Backup-utility.com, 2019.
[Online]. Available: https://www.backup-utility.com/windows-server/synchronize-files-between-
windows-servers.html. [Accessed: 28- Apr- 2019].
[12]F. Ferre and P. Clote, "a web server for disulfide connectivity prediction", Nucleic Acids Research,
vol. 33, no., pp. W230-W232, 2005. Available: 10.1093/nar/gki412.
[13]S. Yadav, U. Verma and C. Bhardwaj, "Data Security in Cloud Computing", International Journal
of Scientific Research, vol. 3, no. 5, pp. 78-81, 2012. Available: 10.15373/22778179/may2014/26.
[14]M. Raut and P. Itkar, "Provable Data Possession at Untrusted Cloud Storage server", International
Journal Of Engineering And Computer Science, 2016. Available: 10.18535/ijecs/v5i2.20.
1 out of 10
Related Documents


Your All-in-One AI-Powered Toolkit for Academic Success.
+13062052269
info@desklib.com
Available 24*7 on WhatsApp / Email
![[object Object]](/_next/static/media/star-bottom.7253800d.svg)
Unlock your academic potential
Copyright © 2020–2026 A2Z Services. All Rights Reserved. Developed and managed by ZUCOL.