System Management: Server Availability Monitoring and Metrics Report
VerifiedAdded on 2023/02/01
|7
|2604
|92
Report
AI Summary
This report provides a comprehensive analysis of server availability monitoring and metrics, focusing on the comparison of various open-source server monitoring tools such as Ganglia, OpenNMS, Nagios Core, Zabbix, Icinga, WhatsUp Gold, Spiceworks, Cacti, and CollectD. The report evaluates these tools based on their disk usage, CPU monitoring capabilities, process monitoring, bandwidth monitoring, and overall availability. Furthermore, it delves into the architecture of server availability monitoring, using Alchemy Eye as an example. The report also proposes solutions to mitigate data vulnerability, including the use of PRTG for proactive warning systems, identifying network bottlenecks through SNMP, Netflow, and packet sniffing, and customizing notifications. Finally, it discusses the impact of failure prediction on server availability monitoring, highlighting the potential consequences of data loss, system attacks, and ineffective monitoring. The report concludes by emphasizing the importance of server monitoring for organizational productivity and suggests the implementation of the discussed solutions to improve server availability.

Running head: SERVER AVAILABILITY MONITORING AND METRICS 1
Server availability monitoring and metrics
Name:
Institution:
Server availability monitoring and metrics
Name:
Institution:
Paraphrase This Document
Need a fresh take? Get an instant paraphrase of this document with our AI Paraphraser
SERVER AVAILABILITY MONITORING AND METRICS
2
Server availability monitoring and metrics
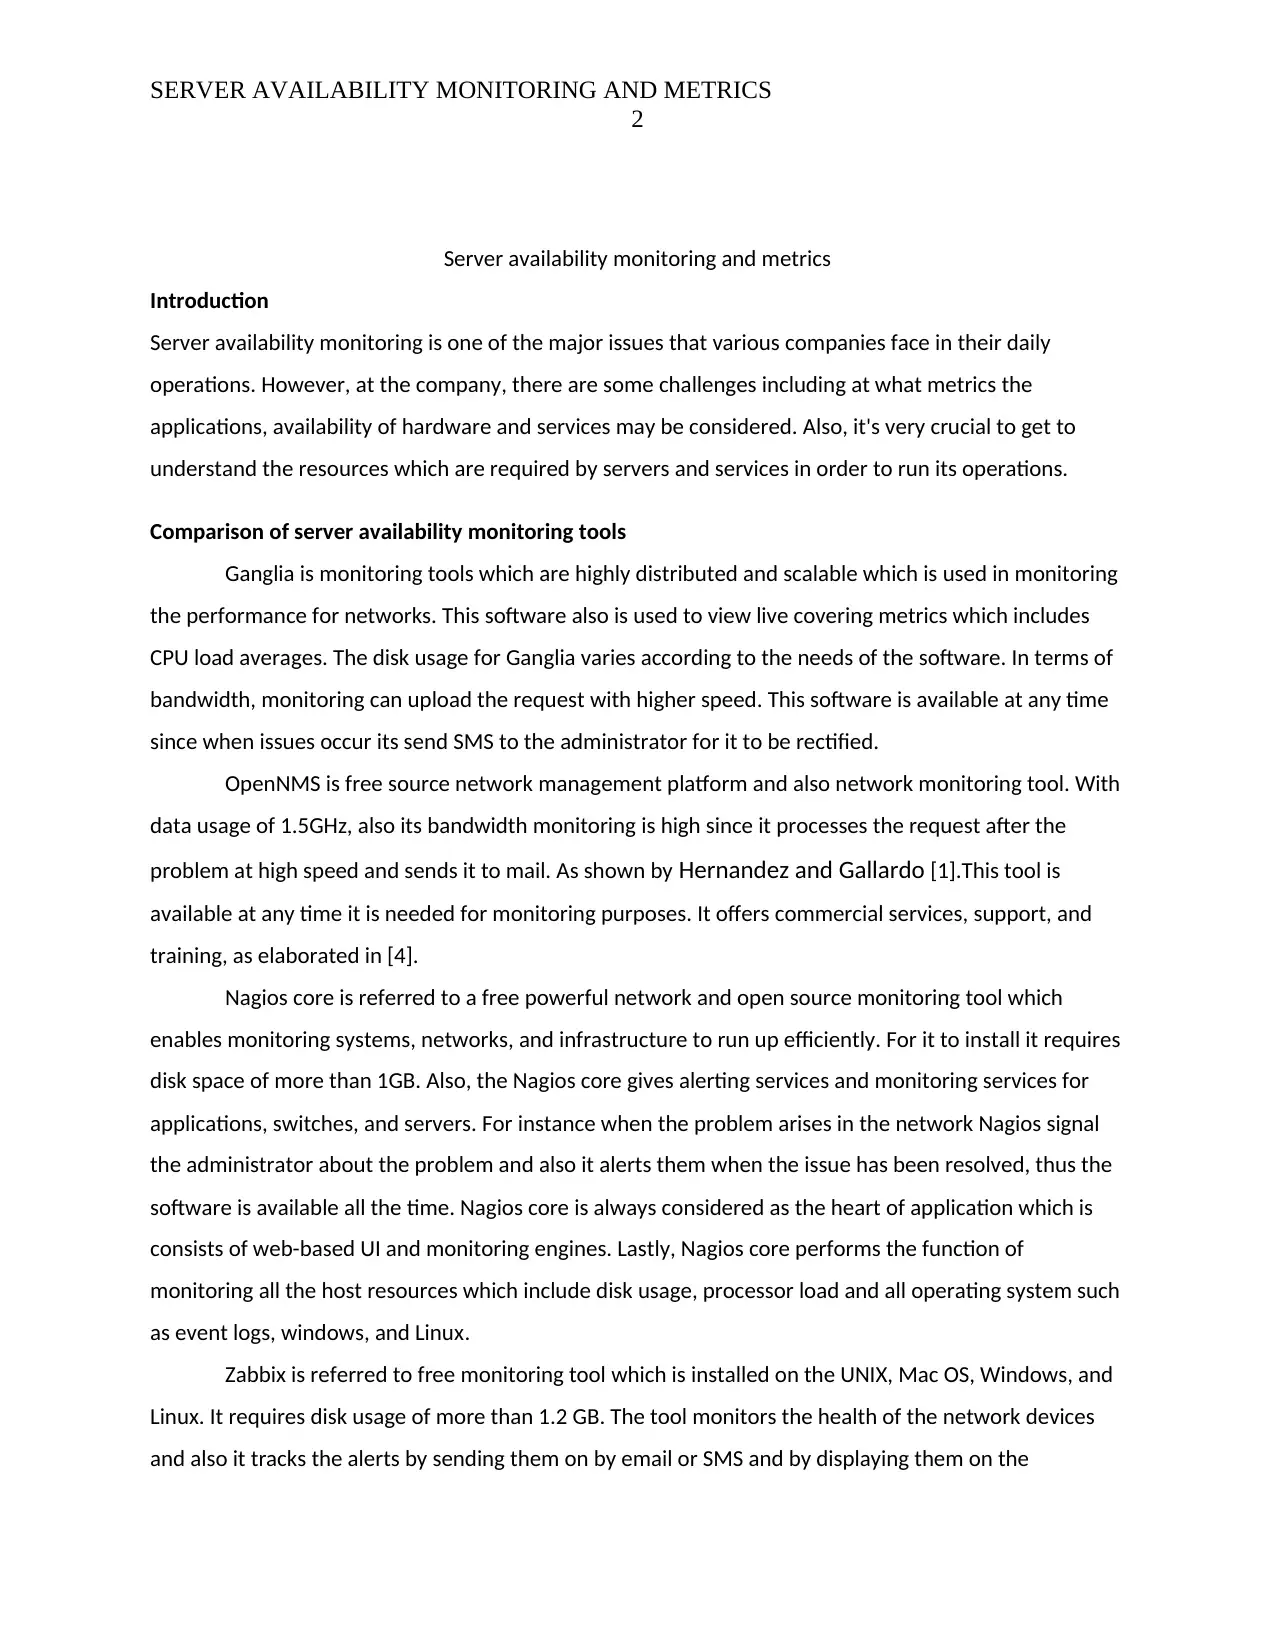
Introduction
Server availability monitoring is one of the major issues that various companies face in their daily
operations. However, at the company, there are some challenges including at what metrics the
applications, availability of hardware and services may be considered. Also, it's very crucial to get to
understand the resources which are required by servers and services in order to run its operations.
Comparison of server availability monitoring tools
Ganglia is monitoring tools which are highly distributed and scalable which is used in monitoring
the performance for networks. This software also is used to view live covering metrics which includes
CPU load averages. The disk usage for Ganglia varies according to the needs of the software. In terms of
bandwidth, monitoring can upload the request with higher speed. This software is available at any time
since when issues occur its send SMS to the administrator for it to be rectified.
OpenNMS is free source network management platform and also network monitoring tool. With
data usage of 1.5GHz, also its bandwidth monitoring is high since it processes the request after the
problem at high speed and sends it to mail. As shown by Hernandez and Gallardo [1].This tool is
available at any time it is needed for monitoring purposes. It offers commercial services, support, and
training, as elaborated in [4].
Nagios core is referred to a free powerful network and open source monitoring tool which
enables monitoring systems, networks, and infrastructure to run up efficiently. For it to install it requires
disk space of more than 1GB. Also, the Nagios core gives alerting services and monitoring services for
applications, switches, and servers. For instance when the problem arises in the network Nagios signal
the administrator about the problem and also it alerts them when the issue has been resolved, thus the
software is available all the time. Nagios core is always considered as the heart of application which is
consists of web-based UI and monitoring engines. Lastly, Nagios core performs the function of
monitoring all the host resources which include disk usage, processor load and all operating system such
as event logs, windows, and Linux.
Zabbix is referred to free monitoring tool which is installed on the UNIX, Mac OS, Windows, and
Linux. It requires disk usage of more than 1.2 GB. The tool monitors the health of the network devices
and also it tracks the alerts by sending them on by email or SMS and by displaying them on the
2
Server availability monitoring and metrics
Introduction
Server availability monitoring is one of the major issues that various companies face in their daily
operations. However, at the company, there are some challenges including at what metrics the
applications, availability of hardware and services may be considered. Also, it's very crucial to get to
understand the resources which are required by servers and services in order to run its operations.
Comparison of server availability monitoring tools
Ganglia is monitoring tools which are highly distributed and scalable which is used in monitoring
the performance for networks. This software also is used to view live covering metrics which includes
CPU load averages. The disk usage for Ganglia varies according to the needs of the software. In terms of
bandwidth, monitoring can upload the request with higher speed. This software is available at any time
since when issues occur its send SMS to the administrator for it to be rectified.
OpenNMS is free source network management platform and also network monitoring tool. With
data usage of 1.5GHz, also its bandwidth monitoring is high since it processes the request after the
problem at high speed and sends it to mail. As shown by Hernandez and Gallardo [1].This tool is
available at any time it is needed for monitoring purposes. It offers commercial services, support, and
training, as elaborated in [4].
Nagios core is referred to a free powerful network and open source monitoring tool which
enables monitoring systems, networks, and infrastructure to run up efficiently. For it to install it requires
disk space of more than 1GB. Also, the Nagios core gives alerting services and monitoring services for
applications, switches, and servers. For instance when the problem arises in the network Nagios signal
the administrator about the problem and also it alerts them when the issue has been resolved, thus the
software is available all the time. Nagios core is always considered as the heart of application which is
consists of web-based UI and monitoring engines. Lastly, Nagios core performs the function of
monitoring all the host resources which include disk usage, processor load and all operating system such
as event logs, windows, and Linux.
Zabbix is referred to free monitoring tool which is installed on the UNIX, Mac OS, Windows, and
Linux. It requires disk usage of more than 1.2 GB. The tool monitors the health of the network devices
and also it tracks the alerts by sending them on by email or SMS and by displaying them on the
SERVER AVAILABILITY MONITORING AND METRICS
3
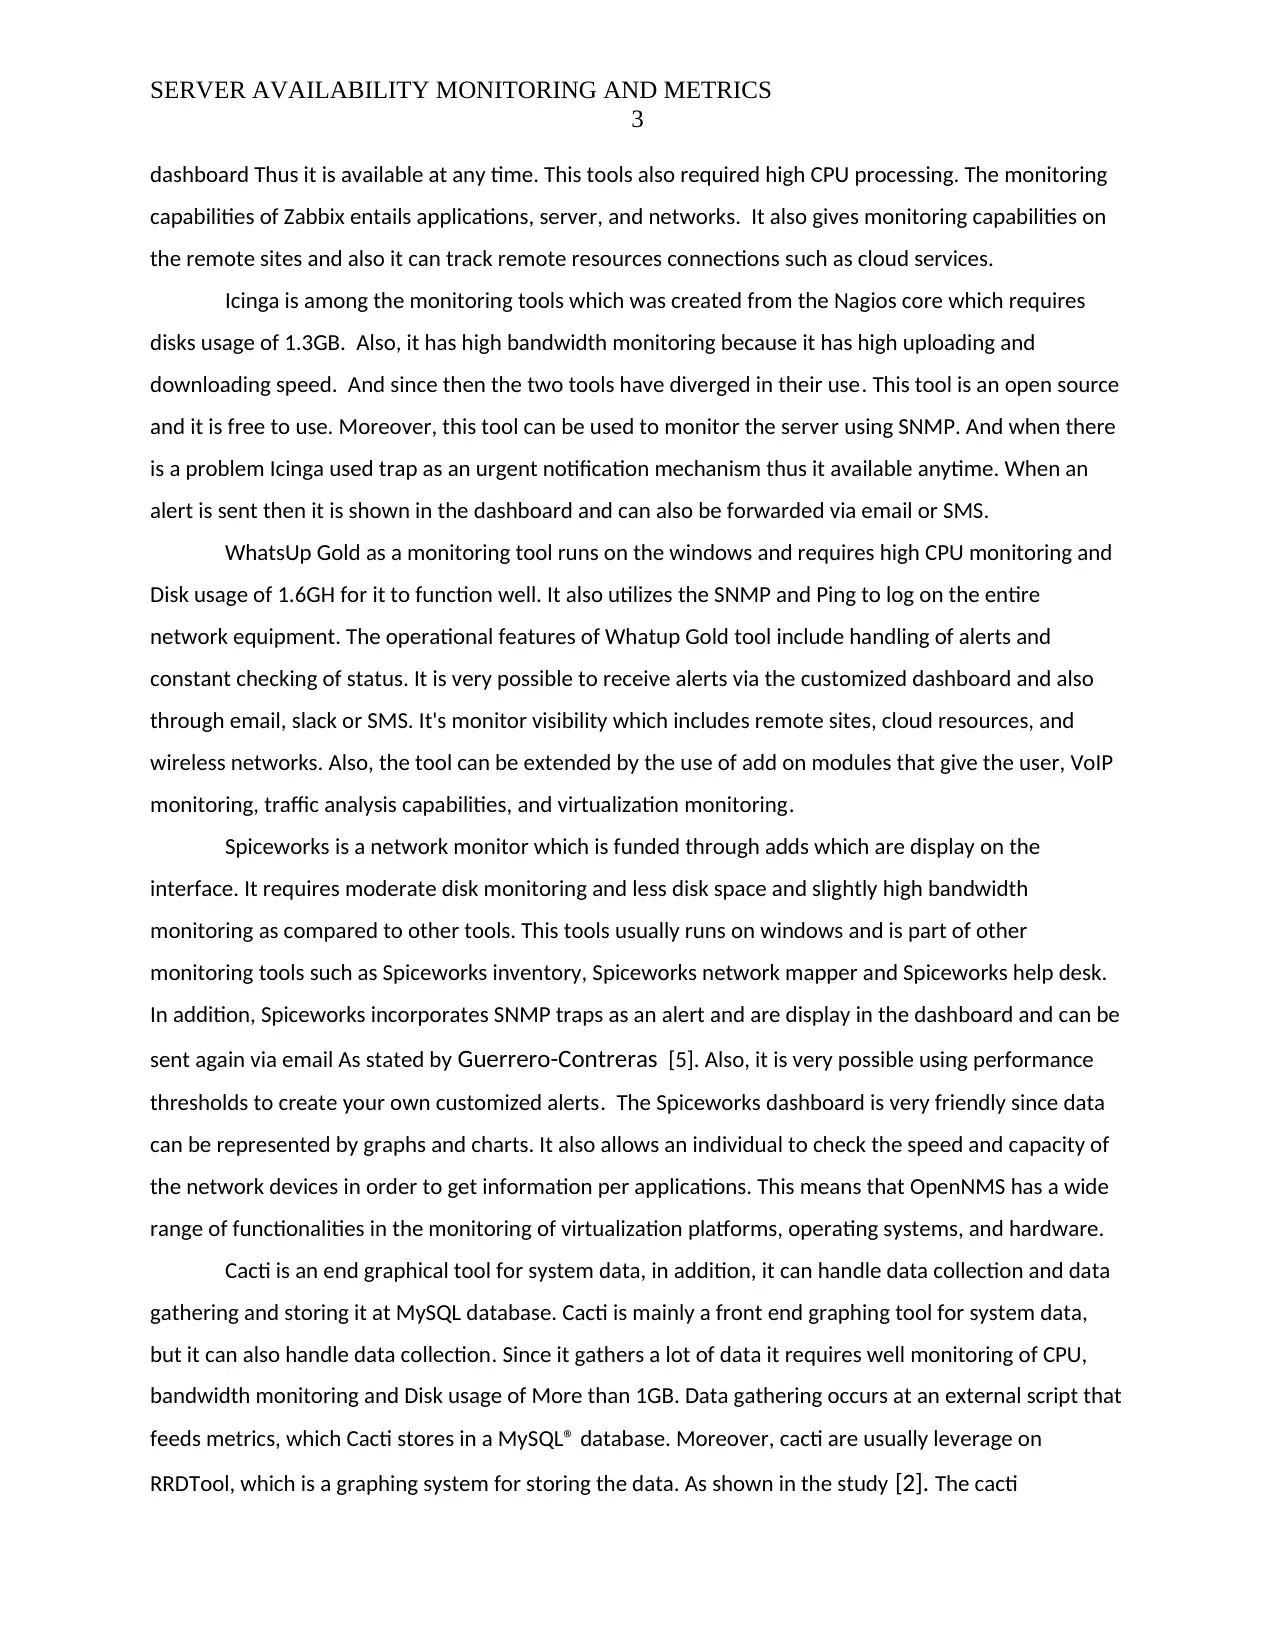
dashboard Thus it is available at any time. This tools also required high CPU processing. The monitoring
capabilities of Zabbix entails applications, server, and networks. It also gives monitoring capabilities on
the remote sites and also it can track remote resources connections such as cloud services.
Icinga is among the monitoring tools which was created from the Nagios core which requires
disks usage of 1.3GB. Also, it has high bandwidth monitoring because it has high uploading and
downloading speed. And since then the two tools have diverged in their use. This tool is an open source
and it is free to use. Moreover, this tool can be used to monitor the server using SNMP. And when there
is a problem Icinga used trap as an urgent notification mechanism thus it available anytime. When an
alert is sent then it is shown in the dashboard and can also be forwarded via email or SMS.
WhatsUp Gold as a monitoring tool runs on the windows and requires high CPU monitoring and
Disk usage of 1.6GH for it to function well. It also utilizes the SNMP and Ping to log on the entire
network equipment. The operational features of Whatup Gold tool include handling of alerts and
constant checking of status. It is very possible to receive alerts via the customized dashboard and also
through email, slack or SMS. It's monitor visibility which includes remote sites, cloud resources, and
wireless networks. Also, the tool can be extended by the use of add on modules that give the user, VoIP
monitoring, traffic analysis capabilities, and virtualization monitoring.
Spiceworks is a network monitor which is funded through adds which are display on the
interface. It requires moderate disk monitoring and less disk space and slightly high bandwidth
monitoring as compared to other tools. This tools usually runs on windows and is part of other
monitoring tools such as Spiceworks inventory, Spiceworks network mapper and Spiceworks help desk.
In addition, Spiceworks incorporates SNMP traps as an alert and are display in the dashboard and can be
sent again via email As stated by Guerrero-Contreras [5]. Also, it is very possible using performance
thresholds to create your own customized alerts. The Spiceworks dashboard is very friendly since data
can be represented by graphs and charts. It also allows an individual to check the speed and capacity of
the network devices in order to get information per applications. This means that OpenNMS has a wide
range of functionalities in the monitoring of virtualization platforms, operating systems, and hardware.
Cacti is an end graphical tool for system data, in addition, it can handle data collection and data
gathering and storing it at MySQL database. Cacti is mainly a front end graphing tool for system data,
but it can also handle data collection. Since it gathers a lot of data it requires well monitoring of CPU,
bandwidth monitoring and Disk usage of More than 1GB. Data gathering occurs at an external script that
feeds metrics, which Cacti stores in a MySQL® database. Moreover, cacti are usually leverage on
RRDTool, which is a graphing system for storing the data. As shown in the study [2]. The cacti
3
dashboard Thus it is available at any time. This tools also required high CPU processing. The monitoring
capabilities of Zabbix entails applications, server, and networks. It also gives monitoring capabilities on
the remote sites and also it can track remote resources connections such as cloud services.
Icinga is among the monitoring tools which was created from the Nagios core which requires
disks usage of 1.3GB. Also, it has high bandwidth monitoring because it has high uploading and
downloading speed. And since then the two tools have diverged in their use. This tool is an open source
and it is free to use. Moreover, this tool can be used to monitor the server using SNMP. And when there
is a problem Icinga used trap as an urgent notification mechanism thus it available anytime. When an
alert is sent then it is shown in the dashboard and can also be forwarded via email or SMS.
WhatsUp Gold as a monitoring tool runs on the windows and requires high CPU monitoring and
Disk usage of 1.6GH for it to function well. It also utilizes the SNMP and Ping to log on the entire
network equipment. The operational features of Whatup Gold tool include handling of alerts and
constant checking of status. It is very possible to receive alerts via the customized dashboard and also
through email, slack or SMS. It's monitor visibility which includes remote sites, cloud resources, and
wireless networks. Also, the tool can be extended by the use of add on modules that give the user, VoIP
monitoring, traffic analysis capabilities, and virtualization monitoring.
Spiceworks is a network monitor which is funded through adds which are display on the
interface. It requires moderate disk monitoring and less disk space and slightly high bandwidth
monitoring as compared to other tools. This tools usually runs on windows and is part of other
monitoring tools such as Spiceworks inventory, Spiceworks network mapper and Spiceworks help desk.
In addition, Spiceworks incorporates SNMP traps as an alert and are display in the dashboard and can be
sent again via email As stated by Guerrero-Contreras [5]. Also, it is very possible using performance
thresholds to create your own customized alerts. The Spiceworks dashboard is very friendly since data
can be represented by graphs and charts. It also allows an individual to check the speed and capacity of
the network devices in order to get information per applications. This means that OpenNMS has a wide
range of functionalities in the monitoring of virtualization platforms, operating systems, and hardware.
Cacti is an end graphical tool for system data, in addition, it can handle data collection and data
gathering and storing it at MySQL database. Cacti is mainly a front end graphing tool for system data,
but it can also handle data collection. Since it gathers a lot of data it requires well monitoring of CPU,
bandwidth monitoring and Disk usage of More than 1GB. Data gathering occurs at an external script that
feeds metrics, which Cacti stores in a MySQL® database. Moreover, cacti are usually leverage on
RRDTool, which is a graphing system for storing the data. As shown in the study [2]. The cacti
⊘ This is a preview!⊘
Do you want full access?
Subscribe today to unlock all pages.
Trusted by 1+ million students worldwide

SERVER AVAILABILITY MONITORING AND METRICS
4
developers have contributed to various templates, plug-ins, and scripts which can be used to monitors
the running of every device.
CollectD is well known Open source tool, which collects the system performance in a given time
and stored it in multiple formats such as RRD files thus its disk usage of 2GB, High CPU monitoring, high
bandwidth. Basically, CollectD is available for multiple operating systems and also it is written in c++
programming language. collectD have many plug-ins in every system which allow the user to collect
data as compared to other system metrics such as memory and CPU. Several studies [2,5,8,9] have
proved that Mostly collected is used in predicting the system load and in creating alerts, thus it has high
data processing and available at any given time. It is also used in DevOps project as an open source
collection agent.
Discuss and evaluate in detail the server availability monitoring architecture.
Some system network such as email servers, access points, routers, and web servers are needed
to be active every time. Alchemy Eye is a tool which is customizable and it is used in monitoring the
network and server availability by checking the availability of server as required. If the problem is
encounter this tool will notify the administrator by SMS, instant messaging and email. The first step in
server availability monitoring architecture is downloading and installing the program and then run the
download setup package and then instill it. As stated by Shamar [3], the second step is launching the
Alchemy eye and this is where the main window will appear. This window is empty and a monitor has
yet been added. After launching the tool you specify the type of service you want to monitor for
example TCP/IP. At this stage, the Alchemy eye will be supporting various network services and methods
of monitoring. The final step is now checking the availability of the server, the monitors are responsible
for checking server availability after every 3 minutes and at this time Alchemy eye reports that our
server is running very well and there is nothing wrong encounter.
Propose a solution to avoid data vulnerability in server availability monitoring tools.
If the data vulnerability in the server is not avoided it will pose many impacts to the servers and
as results monitoring tools will be unsecured. The following are a solution to avoid data vulnerability in
the server. First using of PRTG which is network monitoring software, this software act as an immediate
warning system after the suspicious activity is encountered in the server, For example, see [6]. PRTQ will
prevent any attack that can cause harm to the server. Since PRTG cannot be used for intrusion detection
Paraphrase This Document
Need a fresh take? Get an instant paraphrase of this document with our AI Paraphraser
SERVER AVAILABILITY MONITORING AND METRICS
5
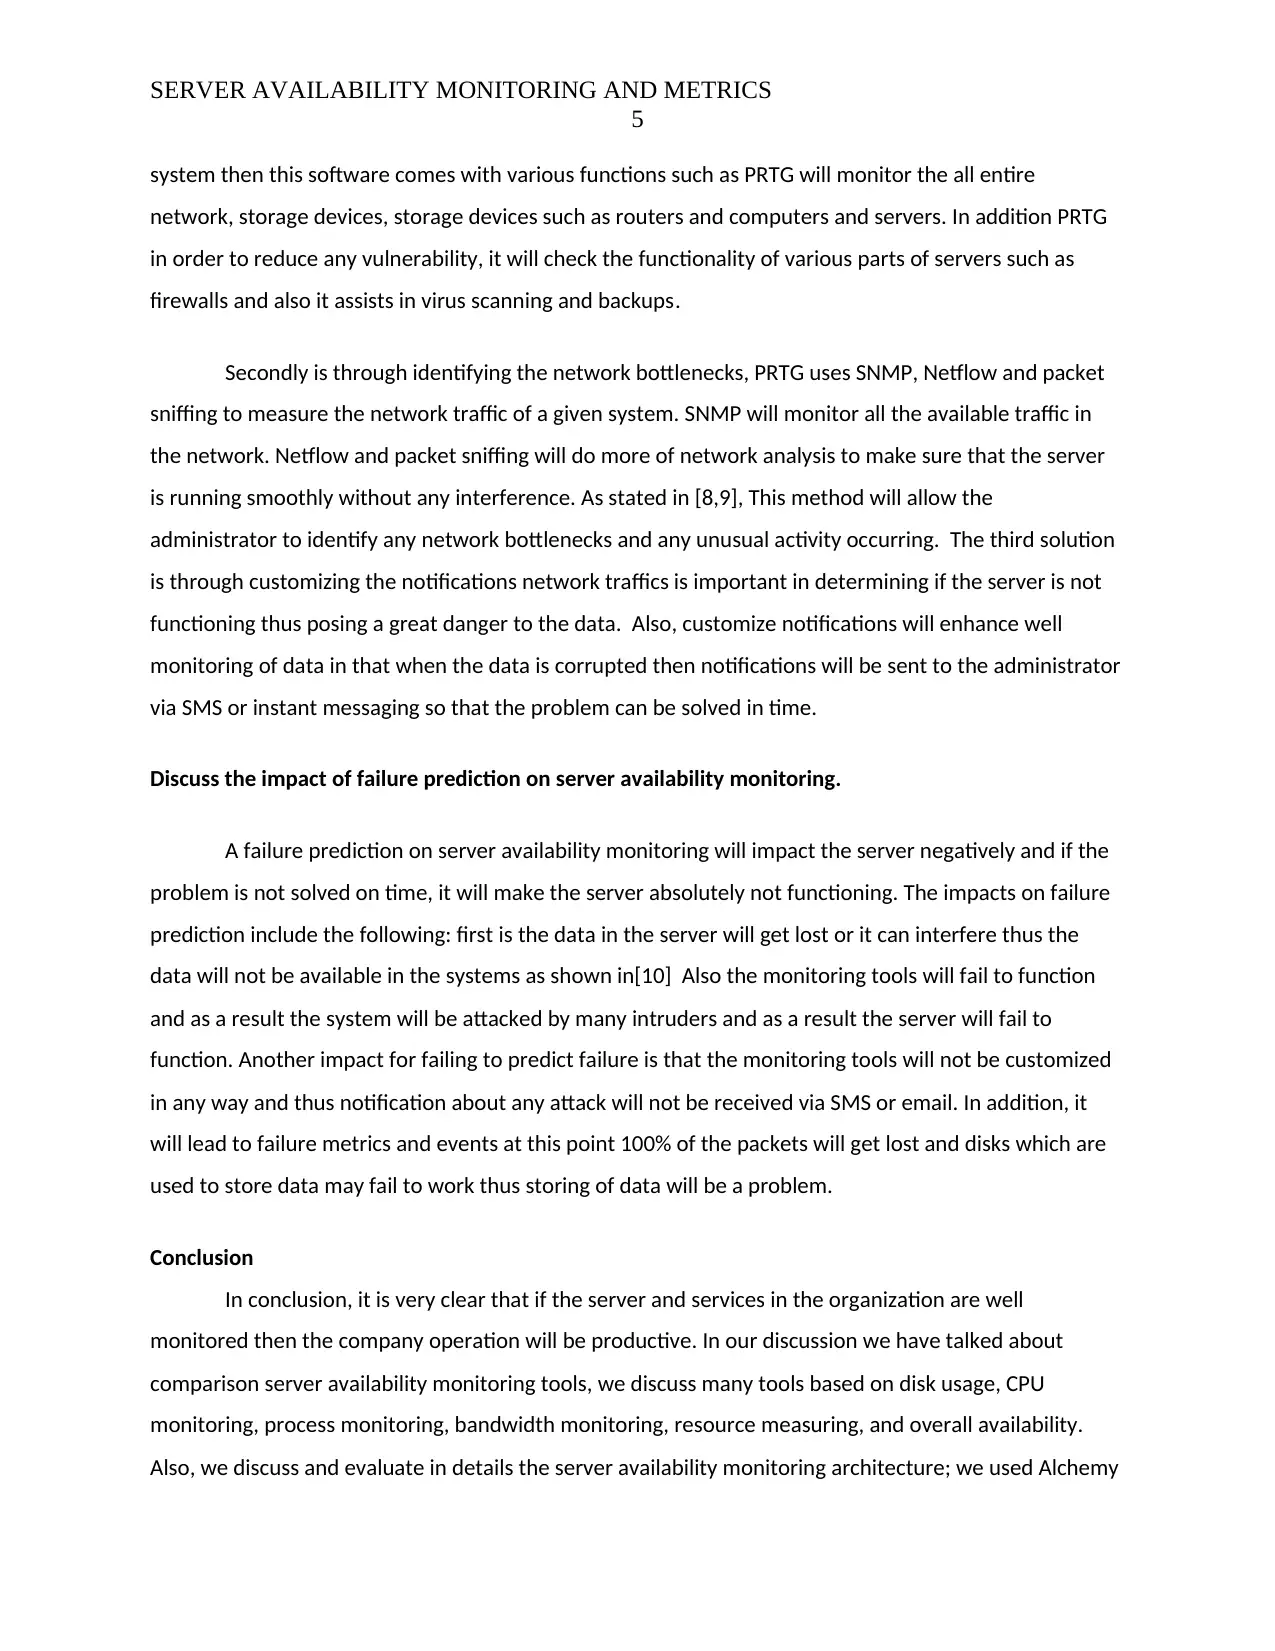
system then this software comes with various functions such as PRTG will monitor the all entire
network, storage devices, storage devices such as routers and computers and servers. In addition PRTG
in order to reduce any vulnerability, it will check the functionality of various parts of servers such as
firewalls and also it assists in virus scanning and backups.
Secondly is through identifying the network bottlenecks, PRTG uses SNMP, Netflow and packet
sniffing to measure the network traffic of a given system. SNMP will monitor all the available traffic in
the network. Netflow and packet sniffing will do more of network analysis to make sure that the server
is running smoothly without any interference. As stated in [8,9], This method will allow the
administrator to identify any network bottlenecks and any unusual activity occurring. The third solution
is through customizing the notifications network traffics is important in determining if the server is not
functioning thus posing a great danger to the data. Also, customize notifications will enhance well
monitoring of data in that when the data is corrupted then notifications will be sent to the administrator
via SMS or instant messaging so that the problem can be solved in time.
Discuss the impact of failure prediction on server availability monitoring.
A failure prediction on server availability monitoring will impact the server negatively and if the
problem is not solved on time, it will make the server absolutely not functioning. The impacts on failure
prediction include the following: first is the data in the server will get lost or it can interfere thus the
data will not be available in the systems as shown in[10] Also the monitoring tools will fail to function
and as a result the system will be attacked by many intruders and as a result the server will fail to
function. Another impact for failing to predict failure is that the monitoring tools will not be customized
in any way and thus notification about any attack will not be received via SMS or email. In addition, it
will lead to failure metrics and events at this point 100% of the packets will get lost and disks which are
used to store data may fail to work thus storing of data will be a problem.
Conclusion
In conclusion, it is very clear that if the server and services in the organization are well
monitored then the company operation will be productive. In our discussion we have talked about
comparison server availability monitoring tools, we discuss many tools based on disk usage, CPU
monitoring, process monitoring, bandwidth monitoring, resource measuring, and overall availability.
Also, we discuss and evaluate in details the server availability monitoring architecture; we used Alchemy
5
system then this software comes with various functions such as PRTG will monitor the all entire
network, storage devices, storage devices such as routers and computers and servers. In addition PRTG
in order to reduce any vulnerability, it will check the functionality of various parts of servers such as
firewalls and also it assists in virus scanning and backups.
Secondly is through identifying the network bottlenecks, PRTG uses SNMP, Netflow and packet
sniffing to measure the network traffic of a given system. SNMP will monitor all the available traffic in
the network. Netflow and packet sniffing will do more of network analysis to make sure that the server
is running smoothly without any interference. As stated in [8,9], This method will allow the
administrator to identify any network bottlenecks and any unusual activity occurring. The third solution
is through customizing the notifications network traffics is important in determining if the server is not
functioning thus posing a great danger to the data. Also, customize notifications will enhance well
monitoring of data in that when the data is corrupted then notifications will be sent to the administrator
via SMS or instant messaging so that the problem can be solved in time.
Discuss the impact of failure prediction on server availability monitoring.
A failure prediction on server availability monitoring will impact the server negatively and if the
problem is not solved on time, it will make the server absolutely not functioning. The impacts on failure
prediction include the following: first is the data in the server will get lost or it can interfere thus the
data will not be available in the systems as shown in[10] Also the monitoring tools will fail to function
and as a result the system will be attacked by many intruders and as a result the server will fail to
function. Another impact for failing to predict failure is that the monitoring tools will not be customized
in any way and thus notification about any attack will not be received via SMS or email. In addition, it
will lead to failure metrics and events at this point 100% of the packets will get lost and disks which are
used to store data may fail to work thus storing of data will be a problem.
Conclusion
In conclusion, it is very clear that if the server and services in the organization are well
monitored then the company operation will be productive. In our discussion we have talked about
comparison server availability monitoring tools, we discuss many tools based on disk usage, CPU
monitoring, process monitoring, bandwidth monitoring, resource measuring, and overall availability.
Also, we discuss and evaluate in details the server availability monitoring architecture; we used Alchemy
SERVER AVAILABILITY MONITORING AND METRICS
6
eye software tools to explain the availability monitoring architecture. Also, we propose various many
solutions to avoid data vulnerability in server available monitoring tools here were discuss tools which
includes PRTG which can be used for notification if there is any problem in the server it will send an
Email or SMS for the problem to be solved on time. Lastly, we discuss the impact of failure prediction on
server availability monitoring here we discuss various problems that occur due to failure prediction. If
we incorporate all that we have discussed and implemented it fully then the server availability
monitoring will be improved in our company.
⊘ This is a preview!⊘
Do you want full access?
Subscribe today to unlock all pages.
Trusted by 1+ million students worldwide
SERVER AVAILABILITY MONITORING AND METRICS
7
References
[1] Hernantes, J., Gallardo, G., & Serrano, N. (2015). IT infrastructure-monitoring tools. IEEE Software,
32(4), 88-93.
[2] Chandran, M., & Walvekar, J. (2018). Monitoring in a Virtualized Environment. GSTF Journal on
Computing (JoC), 1(1).
[3] Sharma, A. B., Mishra, D. R., & Kumar, S. (2015). U.S. Patent No. 8,930,395. Washington, DC: U.S.
Patent and Trademark Office.
[4] Hernantes, J., Gallardo, G., & Serrano, N. (2015). IT infrastructure-monitoring tools. IEEE Software,
32(4), 88-93.
[5] Guerrero-Contreras, G., Garrido, J. L., Balderas-Diaz, S., & Rodríguez-Domínguez, C. (2017). A
context-aware architecture supporting service availability in mobile cloud computing. IEEE Transactions
on Services Computing, 10(6), 956-968.
[6] Jouini, M., & Rabai, L. B. A. (2019). A security framework for secure cloud computing environments.
In Cloud Security: Concepts, Methodologies, Tools, and Applications (pp. 249-263). IGI Global.
[7] Almorsy, M., Grundy, J., & Müller, I. (2016). An analysis of the cloud computing security problem.
arXiv preprint arXiv:1609.01107.
[8] Griffith, D. J., Jaehde, A. A., Muttur, M. B., & Umarani, D. (2016). U.S. Patent No. 9,450,833.
Washington, DC: U.S. Patent and Trademark Office.
[9] Kaitovic, I., & Malek, M. (2016, July). Optimizing failure prediction to maximize availability. In 2016
IEEE International Conference on Autonomic Computing (ICAC) (pp. 111-116). IEEE.
[10] Shah, M., Evans, S. C., Deb, B., Gargulak, A. G., Lasky, T., & Mehta, M. (2016). U.S. Patent No.
9,282,008. Washington, DC: U.S. Patent and Trademark Office.
1 out of 7
Related Documents


Your All-in-One AI-Powered Toolkit for Academic Success.
+13062052269
info@desklib.com
Available 24*7 on WhatsApp / Email
![[object Object]](/_next/static/media/star-bottom.7253800d.svg)
Unlock your academic potential
Copyright © 2020–2026 A2Z Services. All Rights Reserved. Developed and managed by ZUCOL.