Singapore's Economy: An Analysis of Output, Employment, and Inflation
VerifiedAdded on 2023/06/10
|14
|2490
|173
Report
AI Summary
This report provides an in-depth analysis of Singapore's economic performance, focusing on output, labor market dynamics, and price levels. It highlights the significant expansion of the economy's aggregate output due to the growth of the manufacturing and service sectors, while also noting the impact of the 2008 global financial crisis. The study identifies structural, cyclical, and frictional unemployment as prevalent forms in Singapore, emphasizing the government's role in maintaining low unemployment through various programs. Additionally, it examines price level fluctuations influenced by exchange rate volatility and the Monetary Authority of Singapore's anti-inflationary policies. The report concludes that Singapore's economic restructuring and strategic growth initiatives have enabled it to successfully navigate economic challenges and maintain a strong overall performance. Desklib offers similar documents and study resources for students.
Running Head: ECONOMICS ASSIGNMENT
Economics Assignment
Name of the Student
Name of the University
Course ID
Economics Assignment
Name of the Student
Name of the University
Course ID
Paraphrase This Document
Need a fresh take? Get an instant paraphrase of this document with our AI Paraphraser
1ECONOMICS ASSIGNMENT
Introduction
Singapore despite constrained by its geographic size and limited resource availability has
attained a sustained path of economic growth. Operation under free market economy and
openness to global economy help the economy to become one of the fastest growing nation in
Asia. Global financial crisis though hit the economy in 2008 but it soon recovered due to internal
strength of the economy and effective policy design (Chiu, 2018).
The economy is characterized as one of the most open and corrupt free nation. The low
tax rate of 14.2 percent makes the nation a favorable destination for business investment.
Government in Singapore support high value added economic activities in its manufacturing and
service sectors. Some major sectors of the economy include Banking, Biotechnology, Energy
and Infrastructure and Real Estate (Barkat et al., 2016). Export is one main source of revenue in
Singapore. The competitive position of Singapore in production of electronics, chemicals and
different services is largely supportive to export expansion.
Output performance of Singapore
Real GDP, Real GDP growth rate and Real GDP per capita
In order to measure output performance of the economy real GDP, growth in real GDP
and per capita real GDP are used. Real GDP is an inflation corrected measure of aggregate
output where goods and services are valued at base year prices. Growth in real GDP is the
change in real GDP presented as a percentage of previous year GDP. Per capital real GDP is a
measure of per capita income and obtains by dividing GDP with total population (Baumol &
Blinder, 2016).
Performance trend in Singapore
2ECONOMICS ASSIGNMENT
Real GDP
2005 2006 2007 2008 2009 2010 2011 2012 2013 2014
150
170
190
210
230
250
270
290
310
Real GDP
Year
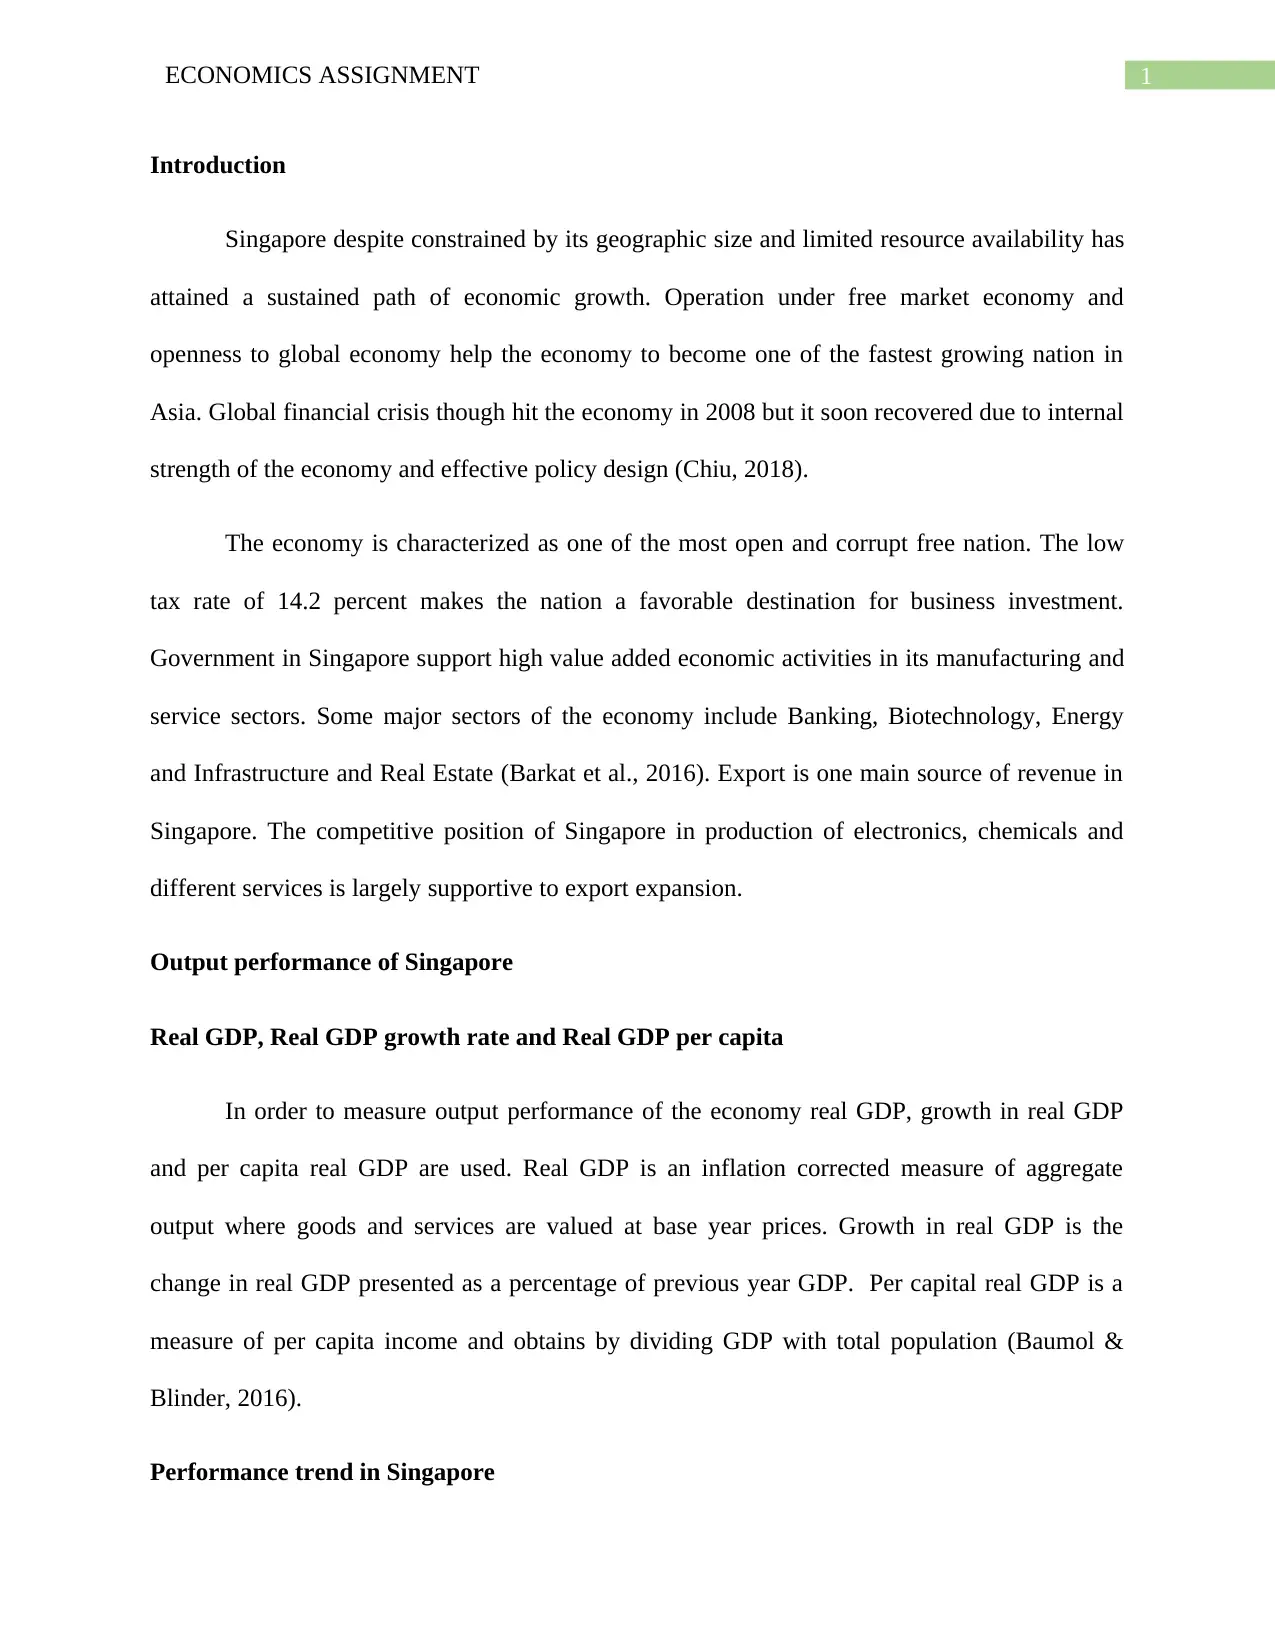
Real GDP
Figure 1: Real GDP in Singapore
(data.worldbank.org, 2018)
Real GDP in Singapore has increased significantly in the past ten years. Factors causing
an increase in real GDP include expansion of export, investment and rapid growth of
manufacturing and service sector in Singapore. This is only in the year 2008 when real GDP
decreased because of global financial crisis. However, recession had not sustained for a long
period and GDP again started to increase since 2010.
GDP growth rate
Real GDP
2005 2006 2007 2008 2009 2010 2011 2012 2013 2014
150
170
190
210
230
250
270
290
310
Real GDP
Year
Real GDP
Figure 1: Real GDP in Singapore
(data.worldbank.org, 2018)
Real GDP in Singapore has increased significantly in the past ten years. Factors causing
an increase in real GDP include expansion of export, investment and rapid growth of
manufacturing and service sector in Singapore. This is only in the year 2008 when real GDP
decreased because of global financial crisis. However, recession had not sustained for a long
period and GDP again started to increase since 2010.
GDP growth rate
⊘ This is a preview!⊘
Do you want full access?
Subscribe today to unlock all pages.
Trusted by 1+ million students worldwide
3ECONOMICS ASSIGNMENT
2004 2006 2008 2010 2012 2014 2016
-2
0
2
4
6
8
10
12
14
16
18
7.5
8.9 9.1
1.8
-0.6
15.2
6.2
3.9 5
3.6
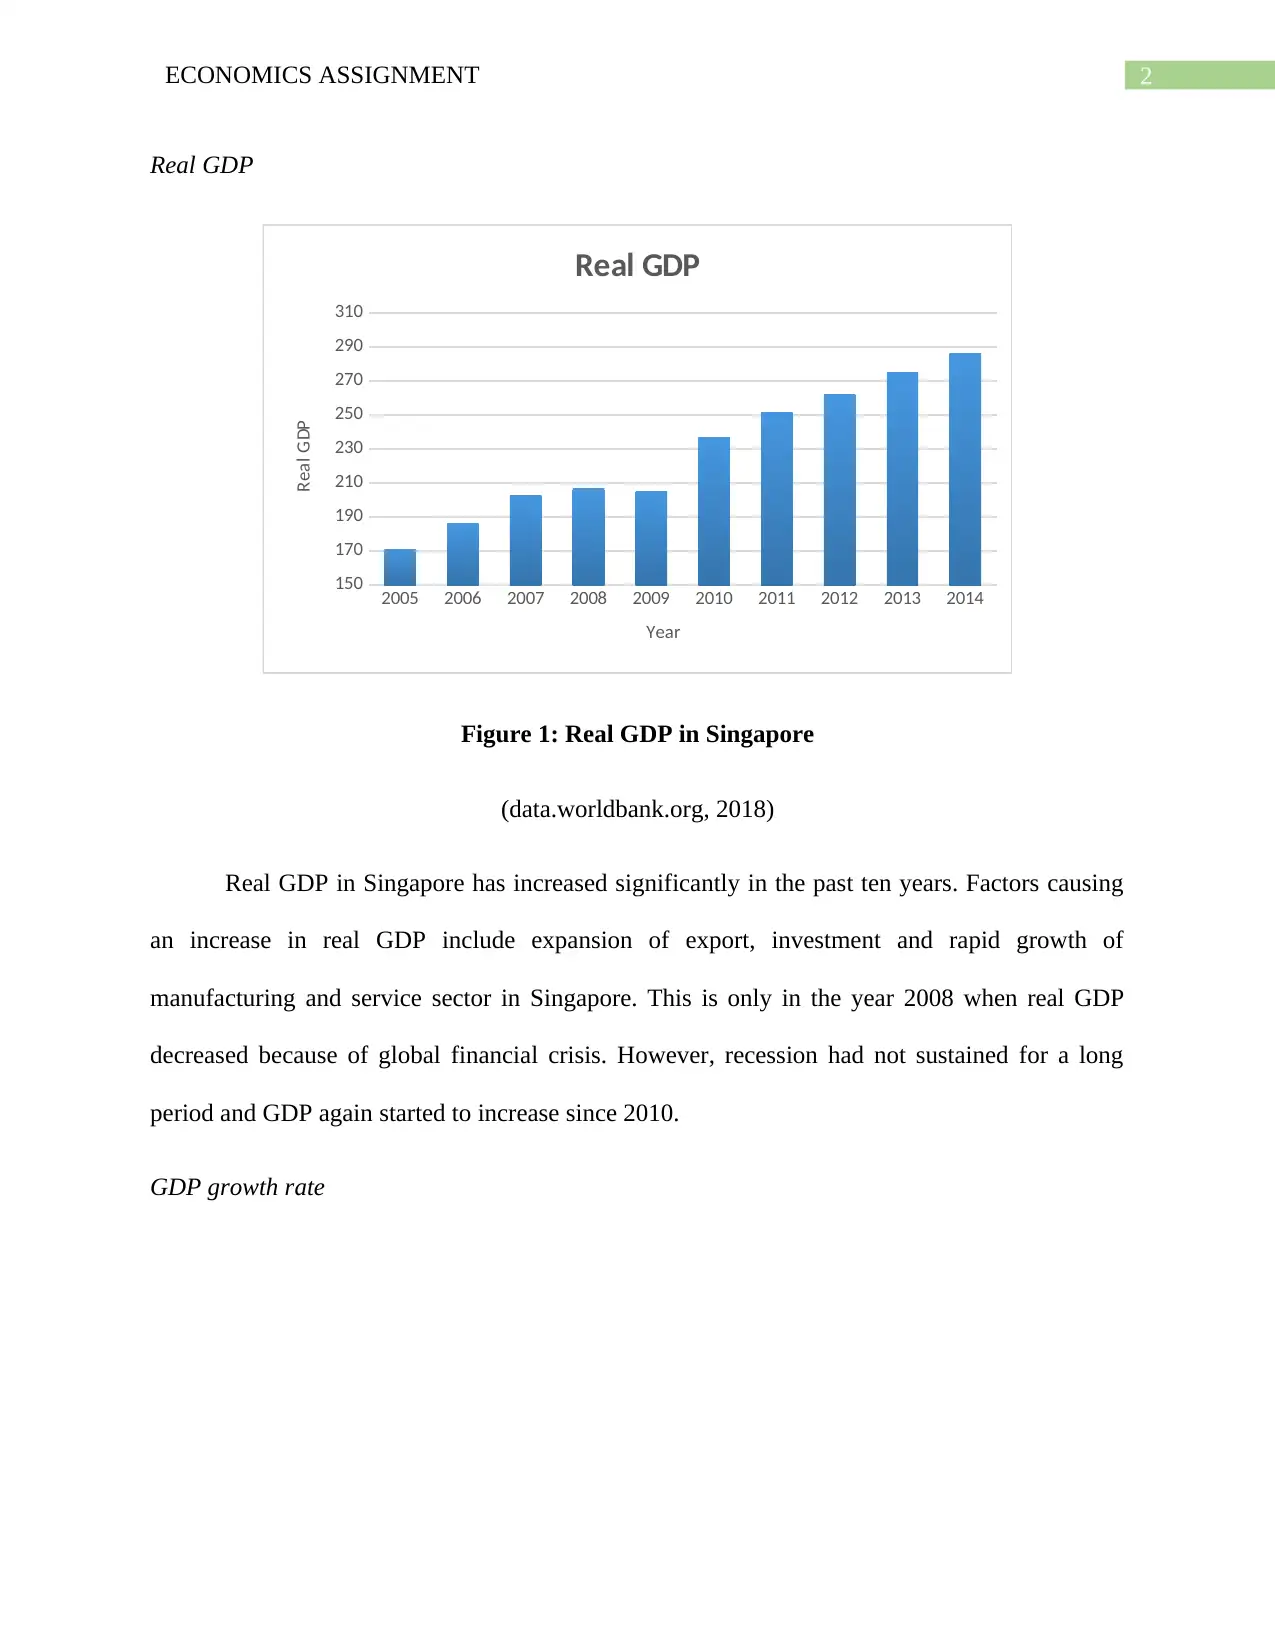
Real GDP Growth Rate
Real GDP Growth Rate
Year
Real GDP growth rate
Figure 2: Trend in real GDP growth in Singapore
(data.worldbank.org, 2018)
Economic growth in Singapore experienced some fluctuation due to fluctuation in internal and
external economic activities. The economic growth rate is lowest in 2009. The recorded growth
rate was -0.6 percent in this year (Benetrix, Lane & Shambaugh, 2015). The highest growth rate
is recorded in 2010 with growth rate being 15.2 percent. A significant portion of economic
growth is accounted by the manufacturing sector. The economic grew at a moderate rate of 3.6
percent in 2014.
Per capita real GDP
2004 2006 2008 2010 2012 2014 2016
-2
0
2
4
6
8
10
12
14
16
18
7.5
8.9 9.1
1.8
-0.6
15.2
6.2
3.9 5
3.6
Real GDP Growth Rate
Real GDP Growth Rate
Year
Real GDP growth rate
Figure 2: Trend in real GDP growth in Singapore
(data.worldbank.org, 2018)
Economic growth in Singapore experienced some fluctuation due to fluctuation in internal and
external economic activities. The economic growth rate is lowest in 2009. The recorded growth
rate was -0.6 percent in this year (Benetrix, Lane & Shambaugh, 2015). The highest growth rate
is recorded in 2010 with growth rate being 15.2 percent. A significant portion of economic
growth is accounted by the manufacturing sector. The economic grew at a moderate rate of 3.6
percent in 2014.
Per capita real GDP
Paraphrase This Document
Need a fresh take? Get an instant paraphrase of this document with our AI Paraphraser
4ECONOMICS ASSIGNMENT
2005 2006 2007 2008 2009 2010 2011 2012 2013 2014
35000
37000
39000
41000
43000
45000
47000
49000
51000
53000
Real GDP Per Capita (US dollar)
Real GDP Per Capita (US dollar)
Year
Per Capita real GDP
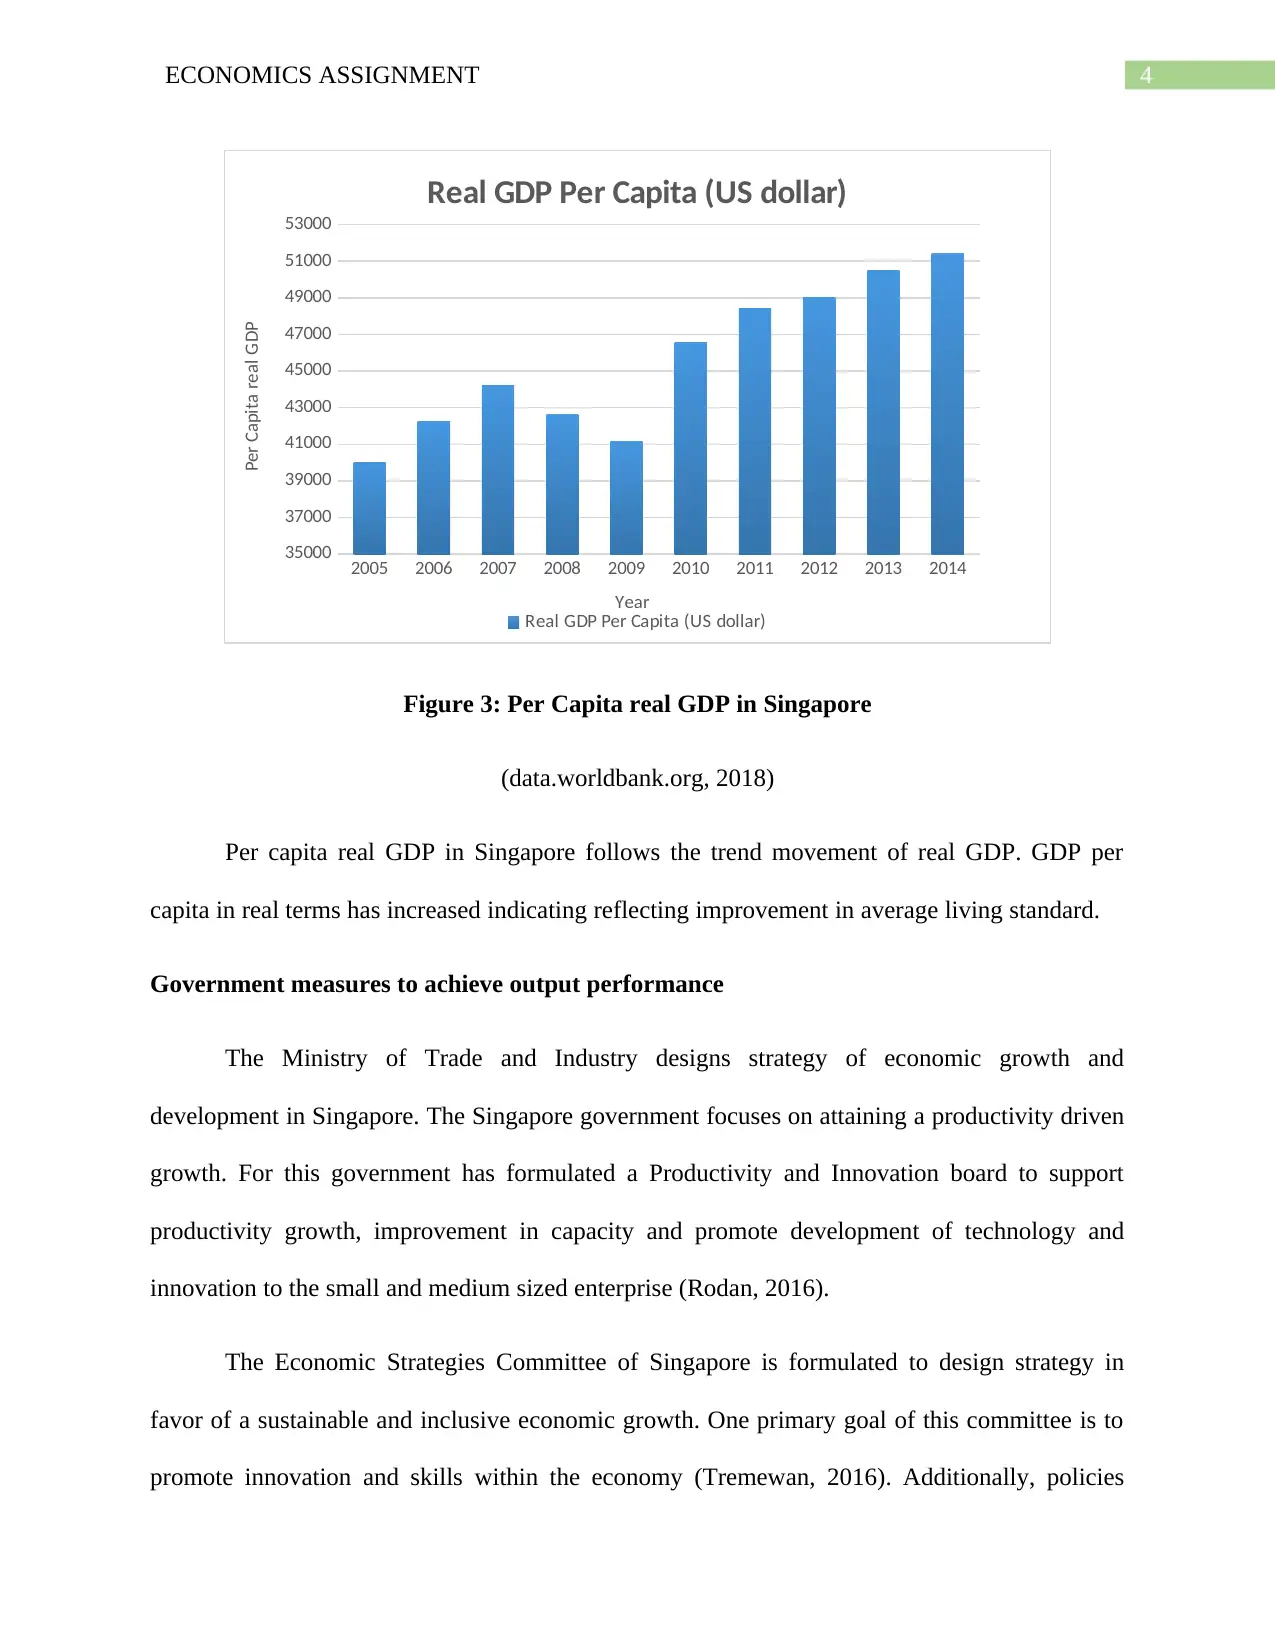
Figure 3: Per Capita real GDP in Singapore
(data.worldbank.org, 2018)
Per capita real GDP in Singapore follows the trend movement of real GDP. GDP per
capita in real terms has increased indicating reflecting improvement in average living standard.
Government measures to achieve output performance
The Ministry of Trade and Industry designs strategy of economic growth and
development in Singapore. The Singapore government focuses on attaining a productivity driven
growth. For this government has formulated a Productivity and Innovation board to support
productivity growth, improvement in capacity and promote development of technology and
innovation to the small and medium sized enterprise (Rodan, 2016).
The Economic Strategies Committee of Singapore is formulated to design strategy in
favor of a sustainable and inclusive economic growth. One primary goal of this committee is to
promote innovation and skills within the economy (Tremewan, 2016). Additionally, policies
2005 2006 2007 2008 2009 2010 2011 2012 2013 2014
35000
37000
39000
41000
43000
45000
47000
49000
51000
53000
Real GDP Per Capita (US dollar)
Real GDP Per Capita (US dollar)
Year
Per Capita real GDP
Figure 3: Per Capita real GDP in Singapore
(data.worldbank.org, 2018)
Per capita real GDP in Singapore follows the trend movement of real GDP. GDP per
capita in real terms has increased indicating reflecting improvement in average living standard.
Government measures to achieve output performance
The Ministry of Trade and Industry designs strategy of economic growth and
development in Singapore. The Singapore government focuses on attaining a productivity driven
growth. For this government has formulated a Productivity and Innovation board to support
productivity growth, improvement in capacity and promote development of technology and
innovation to the small and medium sized enterprise (Rodan, 2016).
The Economic Strategies Committee of Singapore is formulated to design strategy in
favor of a sustainable and inclusive economic growth. One primary goal of this committee is to
promote innovation and skills within the economy (Tremewan, 2016). Additionally, policies
5ECONOMICS ASSIGNMENT
related to efficient energy usage, improvement of land productivity and such others are
undertaken to make Singapore a Global Asian hub.
Analysis of Singapore labor market
Unemployment trend in Singapore
2005 2006 2007 2008 2009 2010 2011 2012 2013 2014
1.5
1.7
1.9
2.1
2.3
2.5
2.7
2.9
3.1
3.3 3.1 3.1
2.1 2.2
3
2.1 2 1.9 1.9 1.95
Unemployment Rate
Year
Rate of Unemployment
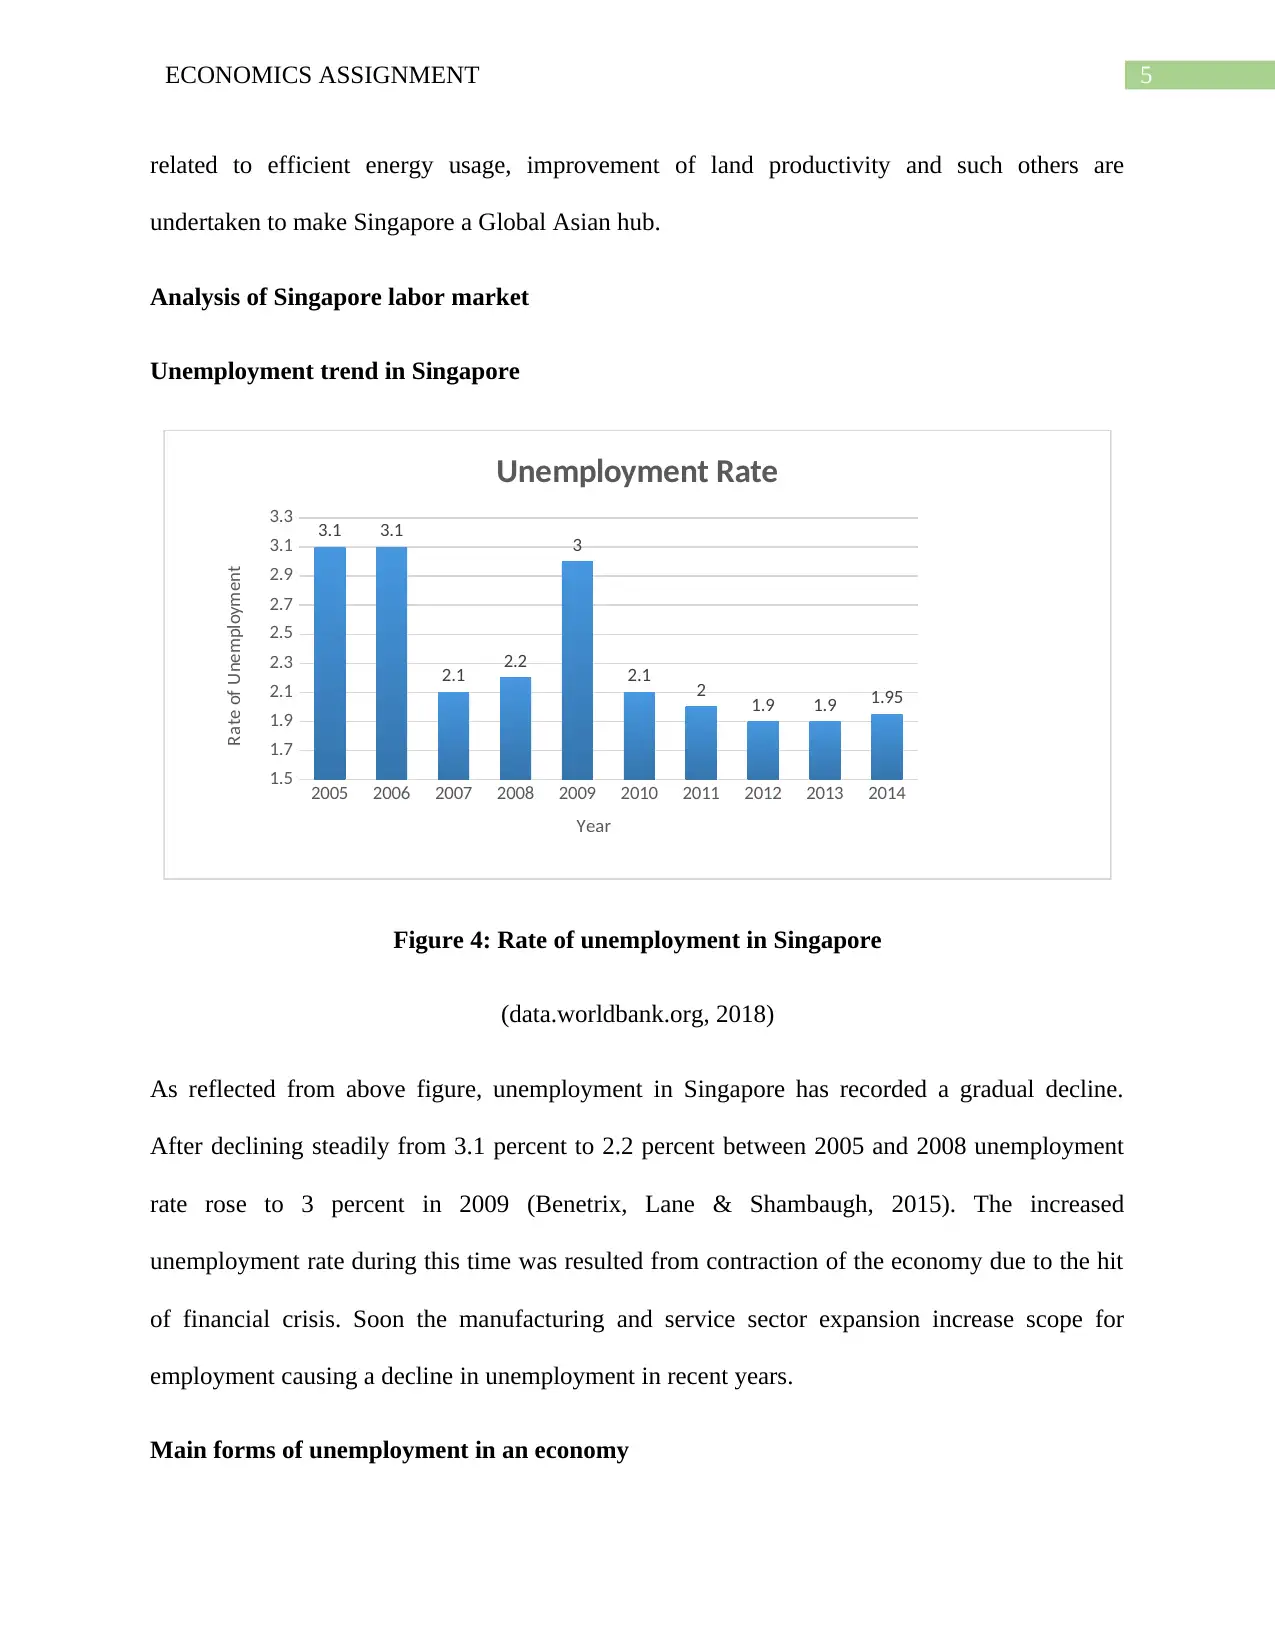
Figure 4: Rate of unemployment in Singapore
(data.worldbank.org, 2018)
As reflected from above figure, unemployment in Singapore has recorded a gradual decline.
After declining steadily from 3.1 percent to 2.2 percent between 2005 and 2008 unemployment
rate rose to 3 percent in 2009 (Benetrix, Lane & Shambaugh, 2015). The increased
unemployment rate during this time was resulted from contraction of the economy due to the hit
of financial crisis. Soon the manufacturing and service sector expansion increase scope for
employment causing a decline in unemployment in recent years.
Main forms of unemployment in an economy
related to efficient energy usage, improvement of land productivity and such others are
undertaken to make Singapore a Global Asian hub.
Analysis of Singapore labor market
Unemployment trend in Singapore
2005 2006 2007 2008 2009 2010 2011 2012 2013 2014
1.5
1.7
1.9
2.1
2.3
2.5
2.7
2.9
3.1
3.3 3.1 3.1
2.1 2.2
3
2.1 2 1.9 1.9 1.95
Unemployment Rate
Year
Rate of Unemployment
Figure 4: Rate of unemployment in Singapore
(data.worldbank.org, 2018)
As reflected from above figure, unemployment in Singapore has recorded a gradual decline.
After declining steadily from 3.1 percent to 2.2 percent between 2005 and 2008 unemployment
rate rose to 3 percent in 2009 (Benetrix, Lane & Shambaugh, 2015). The increased
unemployment rate during this time was resulted from contraction of the economy due to the hit
of financial crisis. Soon the manufacturing and service sector expansion increase scope for
employment causing a decline in unemployment in recent years.
Main forms of unemployment in an economy
⊘ This is a preview!⊘
Do you want full access?
Subscribe today to unlock all pages.
Trusted by 1+ million students worldwide
6ECONOMICS ASSIGNMENT
An economy is said to suffer from the problem of unemployment when people in the
working age though are willing to get a full time job but are unable to find one. There are several
types of unemployment where people remain unemployed for short term or long term period.
Unemployment created by structural change in the economy is termed as structural
unemployment. In case of cyclical unemployment, people lose jobs or unable to find jobs due to
recessionary phase of business cycle (Baumol & Blinder, 2016). Unemployment among new
entered members of labor force or those moving between jobs is known as frictional
unemployment.
Unemployment types in Singapore
Singapore suffers from structural, cyclical and frictional unemployment. Singapore has to
undertake some change in production and economic structure causing structural unemployment.
Shift in production technology from labor intensive to capital intensive is one example of
structural change in the economy. Cyclical unemployment in Singapore is mostly caused due to
fluctuation in external demand (Tan, 2016). Like every economy fresh graduates and newly
entered members faces short term frictional unemployment.
Government measures for full employment
In order to address problem of unemployment resulted from typical cyclical, frictional
and structural factors, government aims to design policies favorable for unemployment. After the
hot of global financial crisis, the economy experienced a worsening condition of labor market as
indicated from a growing number of unemployed people (Wong, 2016). To counter cyclical
unemployment government invested in various job credit schemes.
Paraphrase This Document
Need a fresh take? Get an instant paraphrase of this document with our AI Paraphraser
7ECONOMICS ASSIGNMENT
The Careers support program in Singapore is designed assists labor force belonging to an
age below 40 in searching suitable jobs as professional, technician, managers and executive. The
designed program also addresses the issue of long terms unemployment in Singapore. Under this
program, employer also receive a subsidy constituting 20 percent of workers’ salary in the first
six months (Hampf, Wiederhold & Woessmann, 2017). The amount of subsidy reduced to 10
percent for the next six months in year.
Analysis of price level
Inflation trend in Singapore
2004 2006 2008 2010 2012 2014 2016
0
1
2
3
4
5
6
7
0.4
1
2.1
6.5
0.6
2.8
5.2
4.6
2.4
1.01
Infl ati on Rate
Inflation Rate
Year
Rate of inflation
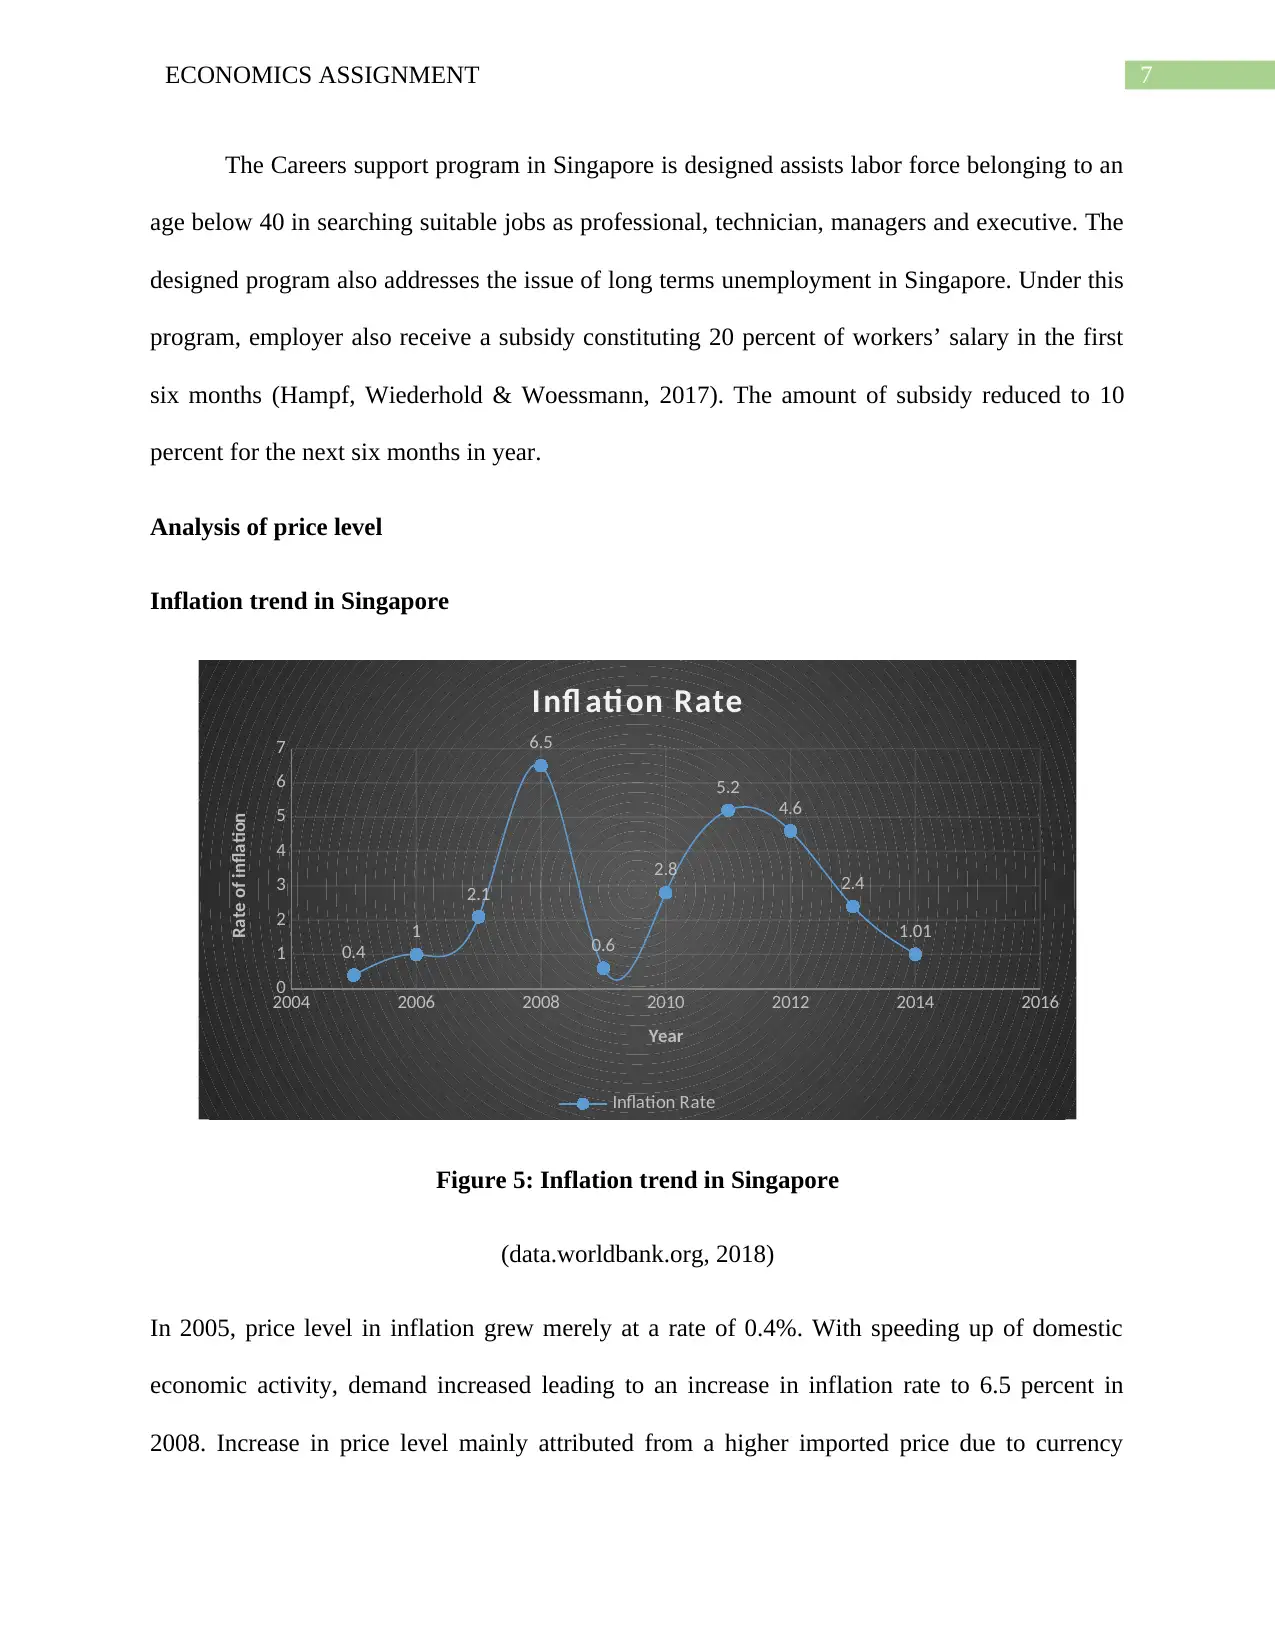
Figure 5: Inflation trend in Singapore
(data.worldbank.org, 2018)
In 2005, price level in inflation grew merely at a rate of 0.4%. With speeding up of domestic
economic activity, demand increased leading to an increase in inflation rate to 6.5 percent in
2008. Increase in price level mainly attributed from a higher imported price due to currency
The Careers support program in Singapore is designed assists labor force belonging to an
age below 40 in searching suitable jobs as professional, technician, managers and executive. The
designed program also addresses the issue of long terms unemployment in Singapore. Under this
program, employer also receive a subsidy constituting 20 percent of workers’ salary in the first
six months (Hampf, Wiederhold & Woessmann, 2017). The amount of subsidy reduced to 10
percent for the next six months in year.
Analysis of price level
Inflation trend in Singapore
2004 2006 2008 2010 2012 2014 2016
0
1
2
3
4
5
6
7
0.4
1
2.1
6.5
0.6
2.8
5.2
4.6
2.4
1.01
Infl ati on Rate
Inflation Rate
Year
Rate of inflation
Figure 5: Inflation trend in Singapore
(data.worldbank.org, 2018)
In 2005, price level in inflation grew merely at a rate of 0.4%. With speeding up of domestic
economic activity, demand increased leading to an increase in inflation rate to 6.5 percent in
2008. Increase in price level mainly attributed from a higher imported price due to currency
8ECONOMICS ASSIGNMENT
depreciation. The volatility of price level is subject to the fluctuation of exchange rate (Benetrix,
Lane & Shambaugh, 2015). Price level recovered and grew at a rate of 5.2 percent in 2011.
Thereafter, following policies of price stability inflation rate has followed the path of gradual
decline with rate of inflation being 1.01% during 2014.
Typical causes of inflation
Inflation captures a gradual increase in the level of average price. The two typical cause
of inflation in an economy is increase in demand and increase in cost. Aggregate demand in an
economy might be increased due to an increase in consumption or investment or government
expenditure or net export. Increase in aggregate demand push up price and is known as demand
–pull inflation.
An increase in factor prices (mainly wage) boosts cost of producing goods and services.
In order to maintain profit margin producers then pass the higher cost by charging a high price.
When price level rises in response to a higher cost, it is known as cost-push inflation (Miller &
Benjamin, 2017).
Factors responsible for inflation in Singapore
Singapore experiences demand-pull inflation due to increase in government spending
mainly in police or armed forces. Reduction in personal income tax also increases aggregate
demand by increasing consumption. The higher cost of wage leads to cost-push inflation in
Singapore. Imported inflation where inflation caused because of an increase in price of imported
good is a special form of inflation in context of Singapore economy (Dany-Knedlik & Garcia,
2018).
Government measures for price stability
⊘ This is a preview!⊘
Do you want full access?
Subscribe today to unlock all pages.
Trusted by 1+ million students worldwide
9ECONOMICS ASSIGNMENT
The policies to achieve a stable price level is designed by Monetary Authority of
Singapore. A rise in import price due to depreciation of dollar is one significant factor causing
inflation in Singapore. To stabilize price, the monetary authority adapts policies to control
exchange. In the budget held in 2013, a policy of currency appreciation was taken to fight against
imported inflation. In January 2018, government has introduced disinflationary policy in the
form of disbursing rebates on additional services and other conservancy charges to reduce
headline inflation (Chow, 2017).
Government takes supply side policies to counter cost-push inflation. For example,
government provides necessary support to companies and unions to enhance productivity. The
idea is that increased productivity helps to increase profit of employers who then able to offer a
higher wage (gov.sg, 2018). If profitability increases more than wage cost, then producers no
longer need to pass the higher cost to the consumers.
Conclusion
The evaluation of output, labor market and price level indicates a strong economic
performance of Singapore. Aggregate output of the economy has been expanded in response to
growth of manufacturing and service sector. Output has declined due to global financial crisis
occurred in 2008. The recession however was short lived. Singapore successfully escaped from
recession due to economic restructuring and several growth strategies undertaken by
government. Form of unemployment prevalent in Singapore include structural, cyclical and
frictional unemployment. The steady decline in unemployment has resulted from creation of
new jobs in manufacturing and service sectors. The direct and indirect assistance of government
in form of government run programs help the nation to maintain a low level of unemployment.
Paraphrase This Document
Need a fresh take? Get an instant paraphrase of this document with our AI Paraphraser
10ECONOMICS ASSIGNMENT
Price level after experiencing some degree of fluctuation due to exchange rate volatility finally
stabilized in response to anti-inflationary policy designed by Monetary Authority of Singapore.
Price level after experiencing some degree of fluctuation due to exchange rate volatility finally
stabilized in response to anti-inflationary policy designed by Monetary Authority of Singapore.
11ECONOMICS ASSIGNMENT
Reference list
Barkat, W., Beh, L. S., Andreeva, T., Garanina, T., Lev, B., Subramaniam, M., ... & Sabherwal,
R. (2016). Intellectual capital, innovation and performance: Empirical evidence from
SMEs. Asian Journal of Scientific Research, 11(3), 397-412.
Baumol, W. J., & Blinder, A. S. (2016). Principles of Macroeconomics. Cengage Learning.
Benetrix, A. S., Lane, P. R., & Shambaugh, J. C. (2015). International currency exposures,
valuation effects and the global financial crisis. Journal of International Economics, 96,
S98-S109.
Chiu, S. W. K. (2018). City states in the global economy: Industrial restructuring in Hong Kong
and Singapore. Routledge.
Chow, H. K. (2017). Domestic liquidity conditions and monetary policy in Singapore. In Cash in
East Asia (pp. 65-76). Springer, Cham.
Dany-Knedlik, G., & Garcia, J. A. (2018). Monetary Policy and Inflation Dynamics in ASEAN
Economies. International Monetary Fund.
GDP (constant 2010 US$) | Data. (2018). Retrieved from
https://data.worldbank.org/indicator/NY.GDP.MKTP.KD?locations=SG
Hampf, F., Wiederhold, S., & Woessmann, L. (2017). Skills, earnings, and employment:
exploring causality in the estimation of returns to skills. Large-scale Assessments in
Education, 5(1), 12.
⊘ This is a preview!⊘
Do you want full access?
Subscribe today to unlock all pages.
Trusted by 1+ million students worldwide
1 out of 14
Related Documents


Your All-in-One AI-Powered Toolkit for Academic Success.
+13062052269
info@desklib.com
Available 24*7 on WhatsApp / Email
![[object Object]](/_next/static/media/star-bottom.7253800d.svg)
Unlock your academic potential
Copyright © 2020–2026 A2Z Services. All Rights Reserved. Developed and managed by ZUCOL.