iMBA Finance Autumn 2018 Project: Smiths Group Financial Analysis
VerifiedAdded on 2023/05/30
|15
|3669
|364
Report
AI Summary
This finance project report provides a comprehensive financial analysis of Smiths Group plc, comparing its performance with Hitachi Limited and assessing its industry position. The analysis includes profitability, liquidity, capital structure, asset efficiency, and shareholder ratios to evaluate the company's financial health. Furthermore, the report employs asset-based valuation, dividend valuation model, and P/E ratios to determine the intrinsic value of Smiths Group's stock, offering investment recommendations based on these valuations. The report concludes with a discussion on the limitations of ratio analysis and valuation models, ultimately suggesting that investors consider selling the stock based on P/E ratio analysis. This detailed study aims to provide valuable insights for informed decision-making regarding Smiths Group.

Finance
1
Project Report: Finance
1
Project Report: Finance
Paraphrase This Document
Need a fresh take? Get an instant paraphrase of this document with our AI Paraphraser
Finance
2
Introduction:
In this report, the financial analysis study has been done on Smiths Group to identify
the company’s performance in the industry, Hitachi limited and industry performance have
also been assessed in the report. In the report, the overall financial performance of the
company has been evaluated through study over the financial statement along with that, the
valuation study has also been performed on the company so that the better result could be
made. A new project of the company has also been studied to recommend the top level
management that whether the project should be accepted or not.
Company brief:
Smith Group plc is British company which is operating its business at multinational
level. The company is operating its business under the engineering industry. Headquarter of
the company is in London, UK. The company has its operation under the engineering
industry. It is world’s largest manufacturer of sensors for explosive detection, chemical
agents, narcotics, biohazards and contraband (Home, 2018). The company has 5 divisions
which are John Crane Inc, Flex-tek, Smiths Medical, Smiths Detection and Smiths
Interconnect.
Financial analysis:
In order to evaluate the performance and the financial changes in Smith Group plc,
ratio analysis method has been applied on the company and it has been compared with the
ratios of Hitachi plc, one of the main competitors of Smith group plc. The ratio analysis study
of Smith group plc and the competition analysis is as follows:
Profitability analysis:
Profitability analysis is an analysis process which evaluates the profitability level of
the business in order to determine the efficiency and performance level of the business. It
evaluates the total earnings of the business on various bases to make the decision about profit
level (Gapenski, 2008). Profitability analysis measures the margin and return of the business
mainly.
In case of Smith group plc, ROCE and profit margin ratio have been calculated.
Return on capital employed ratio brief that how much return have been generated by the
business against the total capital of the business (Barlow, 2006). The ratio analysis briefs the
Finance
3
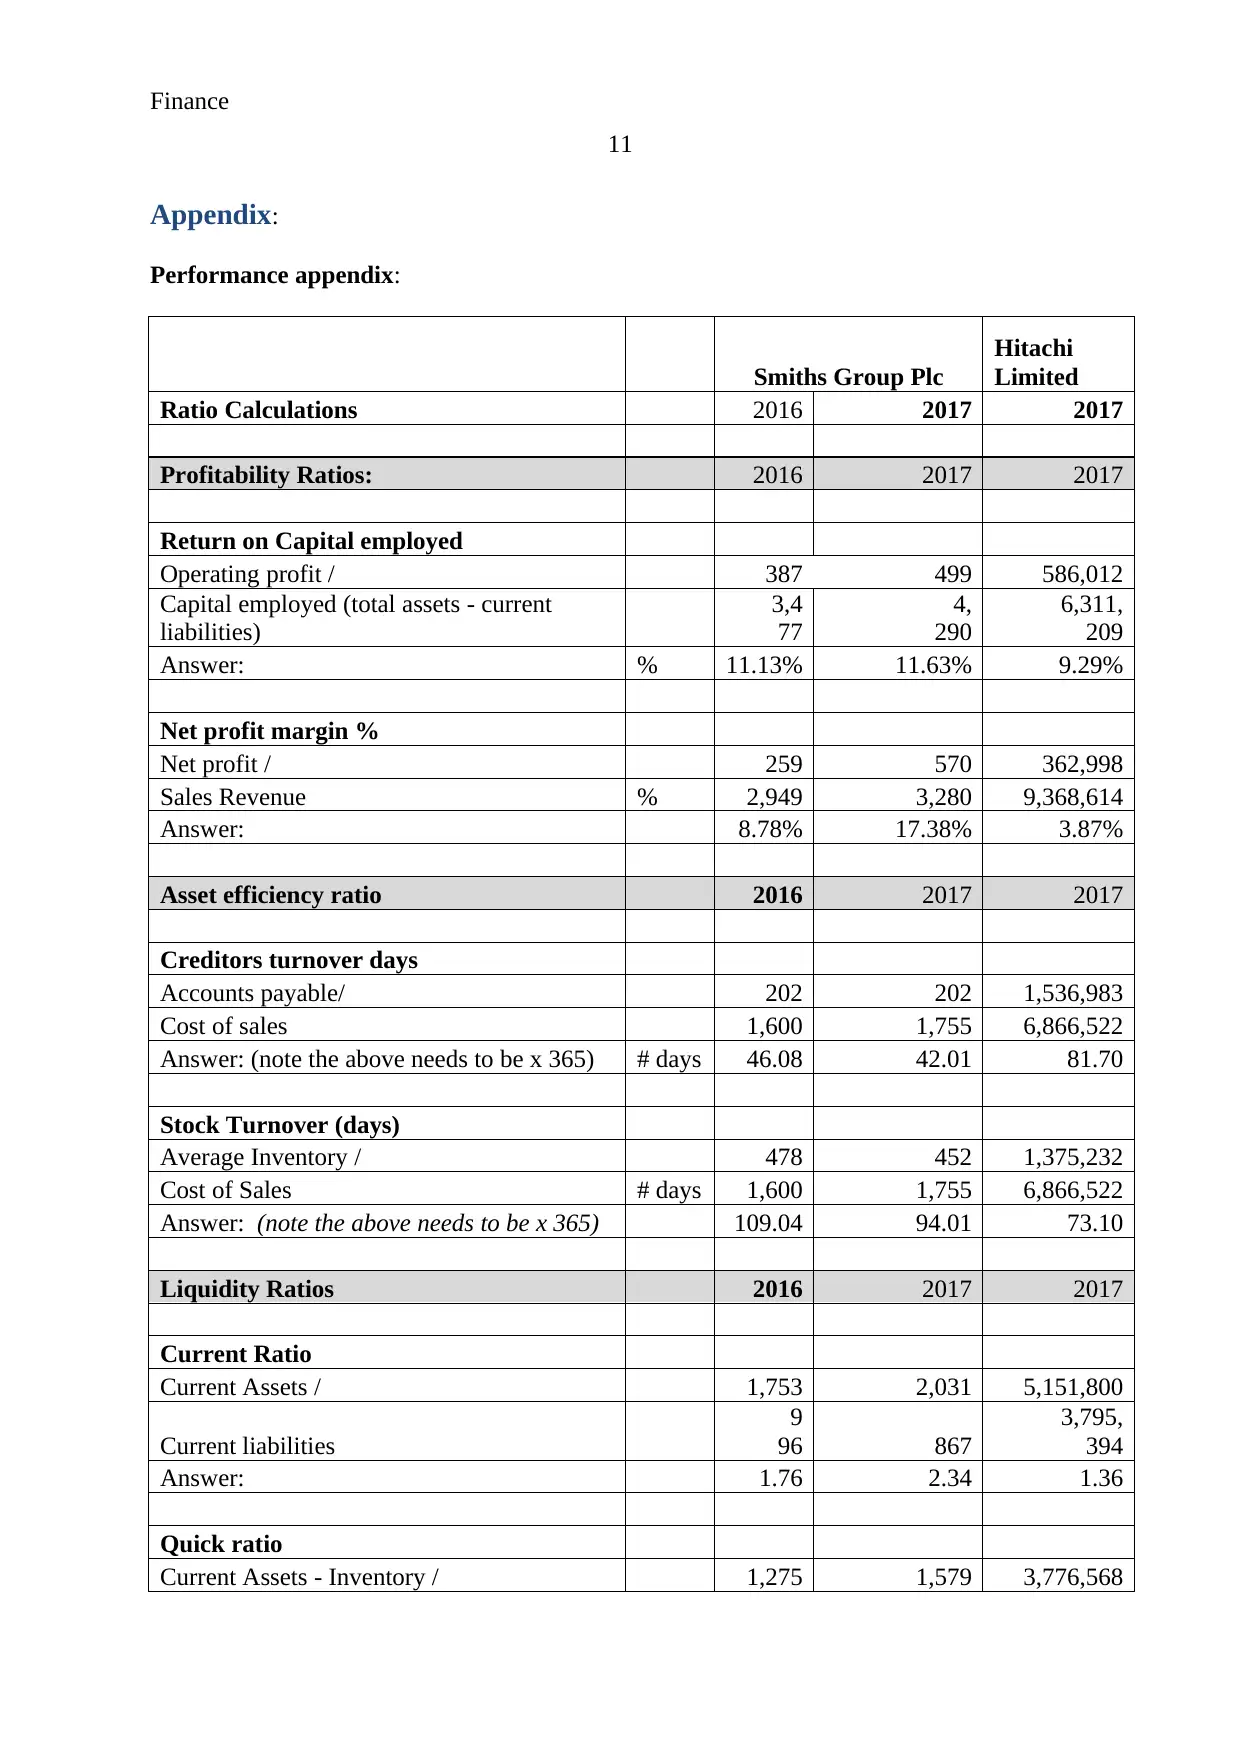
11.63% ROCE of the company which is quite higher than the ROCE of Hitachi limited i.e.
9.29%. On the other hand, net profit ratio brief the total profit earned by the company against
the sales revenue of the business. It briefs the 17.38% net profit level of the business which is
higher than 3.87% net profitability ratio of Hitachi limited (Performance appendix).
The profitability analysis expresses that Smiths group plc’s performance is quite
better and thus it is a good option in order to make an investment as higher earnings per share
could be achieved by each of the shareholders of the company.
Liquidity analysis:
Liquidity ratio analysis is an indicator to recognize whether the company has enough
current and quick assets in order to meet the short term obligation of the company. It
evaluates whether the entire short term debt obligation could be met by the company through
the available current assets or not (Higgins, 2012). It is mainly calculated to identify the
liquidity risk and working capital efficiency level of the business.
In case of Smith group plc, the current ratio and quick ratio has been calculated by the
company. Current ratio of the business indicates whether the business is capable to meet the
short term obligations. 2:1 and 1.3:1 current ratio and quick ratio are normal for the industry
(Madura, 2014). On the basis of study over Smith group plc, it has been found that the current
assets of the company are 2.34 times of current liabilities of the business which is quite
higher than the Hitachi current assets level i.e. 3.87% (Annual report, 2017). Further, the
quick assets define about the total quick assets (those assets which could be easily converted
into cash) against the current liabilities of the business. The calculations explain that the
quick ratio of the business is also higher than Hitachi limited. Quick assets of the company
are higher than 1.82 times of current liabilities of the business (Performance appendix).
Through the calculations, the liquidity risk of the business is least as the level of
current assets and quick assets of the business are higher. However, it has also been found
that in order to maintain the higher current assets, business has to bear higher expenses which
could be reduced through reducing the level of current assets a bit.
Capital structure analysis:
Capital structure ratio analysis is an indicator to recognize that how much funds have
been generated by the business and what is the proportion of different funds in the total
capital of the business. It evaluates that whether the leverage risk and capital risk of the
3
11.63% ROCE of the company which is quite higher than the ROCE of Hitachi limited i.e.
9.29%. On the other hand, net profit ratio brief the total profit earned by the company against
the sales revenue of the business. It briefs the 17.38% net profit level of the business which is
higher than 3.87% net profitability ratio of Hitachi limited (Performance appendix).
The profitability analysis expresses that Smiths group plc’s performance is quite
better and thus it is a good option in order to make an investment as higher earnings per share
could be achieved by each of the shareholders of the company.
Liquidity analysis:
Liquidity ratio analysis is an indicator to recognize whether the company has enough
current and quick assets in order to meet the short term obligation of the company. It
evaluates whether the entire short term debt obligation could be met by the company through
the available current assets or not (Higgins, 2012). It is mainly calculated to identify the
liquidity risk and working capital efficiency level of the business.
In case of Smith group plc, the current ratio and quick ratio has been calculated by the
company. Current ratio of the business indicates whether the business is capable to meet the
short term obligations. 2:1 and 1.3:1 current ratio and quick ratio are normal for the industry
(Madura, 2014). On the basis of study over Smith group plc, it has been found that the current
assets of the company are 2.34 times of current liabilities of the business which is quite
higher than the Hitachi current assets level i.e. 3.87% (Annual report, 2017). Further, the
quick assets define about the total quick assets (those assets which could be easily converted
into cash) against the current liabilities of the business. The calculations explain that the
quick ratio of the business is also higher than Hitachi limited. Quick assets of the company
are higher than 1.82 times of current liabilities of the business (Performance appendix).
Through the calculations, the liquidity risk of the business is least as the level of
current assets and quick assets of the business are higher. However, it has also been found
that in order to maintain the higher current assets, business has to bear higher expenses which
could be reduced through reducing the level of current assets a bit.
Capital structure analysis:
Capital structure ratio analysis is an indicator to recognize that how much funds have
been generated by the business and what is the proportion of different funds in the total
capital of the business. It evaluates that whether the leverage risk and capital risk of the
⊘ This is a preview!⊘
Do you want full access?
Subscribe today to unlock all pages.
Trusted by 1+ million students worldwide
Finance
4
business is moderate or higher (Hillier, Grinblatt and Titman, 2011). It is mainly calculated to
identify the efficiency level and capital management level of the business.
In case of Smith group plc, the gearing ratio and interest coverage ratio have been
calculated by the company. The gearing ratio of the business indicates that how much funds
have been generated by the debt and what is the proportion of total debt against the total
resources of the business (Weaver, Weston and Weaver, 2012). In case of Smith group plc, it
has been found that the gearing ratio of the company is 42.7% of total assets of the business
which is quite higher than the Hitachi gearing level i.e. 30%. The gearing ratio of the industry
is around 40% in the industry. Further, the interest coverage ratio defines about the total
earnings before interest and tax against the total interest expenses of the business
(Performance appendix). The calculations explain that the interest coverage ratio of the
business is lower than the Hitachi limited i.e. 29.25. Interest coverage ratio of the company is
7.56 times higher than the interest expenses (Annual report, 2017). Interest coverage ratio
must be positively higher than 1.
On the basis of the calculations, capital structure level of Smith is quite better as the
financial leverage position of the company is good. The company could easily manage the
leverage and financial risk in the market and all the other factors have also been managed by
the company at better level.
Asset efficiency ratio:
Asset efficiency ratio analysis is an indicator to recognize about the total assets and
working capital management of the business. It evaluates that whether the business is able to
manage the operations and daily activities in minimum capital requirement (Ward, 2012).
In case of Smith group plc, the creditor’s turnover ratio and stock turnover ratios have
been calculated. Both the ratios define that creditor’s turnover ratio of the company is quite
lower than the Hitachi limited and stock turnover ratio of the company is quite higher than
Hitachi limited i.e. 81.70 and 73.10 (Annual report, 2017). It expresses that the working
capital requirement of the company is quite average.
On the basis of the calculations, it has been determined that the company could
improve the working capital requirement through improving the creditor’s turnover days and
reducing the stock turnover days (Performance appendix).
Shareholder ratio:
Paraphrase This Document
Need a fresh take? Get an instant paraphrase of this document with our AI Paraphraser
Finance
5
Shareholder ratio analysis is an indicator to recognize the market worth of the
business. It evaluates how well the market worth has been managed by the business.
In case of Smith group plc, the dividend payout ratio and dividend yield ratio have
been calculated. Both the ratios define that 0.62 and 0.83 & 0.43 and 0.54 are the dividend
payout ratio and dividend yield ratio of Smith plc and Hitachi limited. It explains that the
position of Smith plc is better in terms of paying the dividend and market position.
On the basis of the calculations, it has been determined that the company’s market
position is strong and the investment into the company would offer huge return to
stakeholders (Performance appendix).
Limitations:
The main limitations of the ratio analysis and the above comparison are as follows:
Some year-end changes might be done in the financial statement of the company in
order to improve the ratios so a stakeholder cannot totally rely on the financial
statement and ratio analysis.
Ratio analysis does not take focus on inflation. Many ratios of the business are
calculated on the basis of the historical cost which does not reflect over the actual
financial situation of the business (Lord, 2006).
Accounting ratios does not help the business to resolve the issues and the main issues
of the business can’t be resolve on the basis of the ratio analysis.
Qualitative aspect is ignored by the firm while calculating the accounting ratios so it
could not be a good reliable source to make few decisions (Krantz, 2016).
Company valuation:
Identifying the true and intrinsic worth of stock of an organization is also a good way
to recognize the investment position of the business and make decision about buy or hold the
stock of the company. Stock price of Smith plc in the market is quite different than the actual
worth of the business. In order to determine the actual worth of stock, asset based valuation,
dividend valuation model and P/E ratios have been calculated (Kaplan and Atkinson, 2015).
The calculation of each of the method has been given in the appendix and the analysis of each
of the method is as follows:
Finance
6
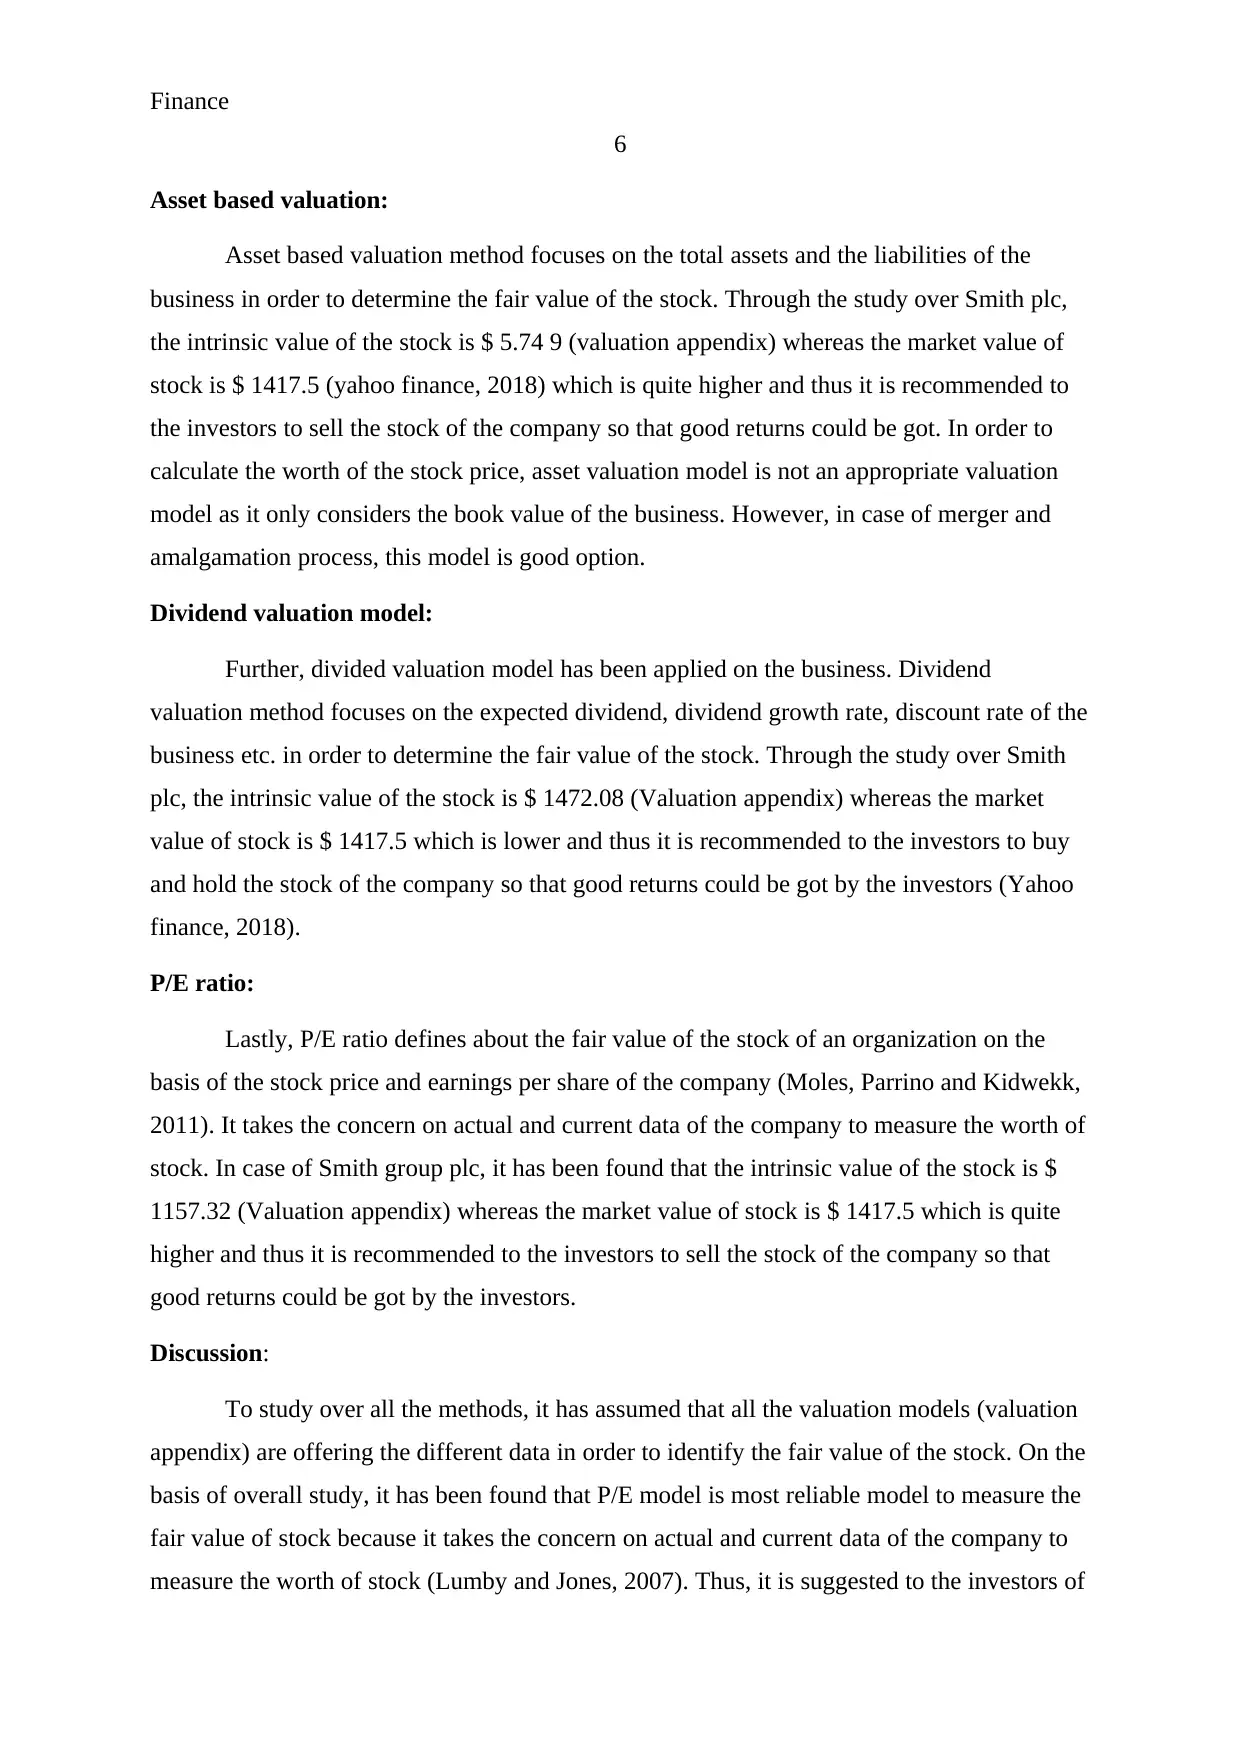
Asset based valuation:
Asset based valuation method focuses on the total assets and the liabilities of the
business in order to determine the fair value of the stock. Through the study over Smith plc,
the intrinsic value of the stock is $ 5.74 9 (valuation appendix) whereas the market value of
stock is $ 1417.5 (yahoo finance, 2018) which is quite higher and thus it is recommended to
the investors to sell the stock of the company so that good returns could be got. In order to
calculate the worth of the stock price, asset valuation model is not an appropriate valuation
model as it only considers the book value of the business. However, in case of merger and
amalgamation process, this model is good option.
Dividend valuation model:
Further, divided valuation model has been applied on the business. Dividend
valuation method focuses on the expected dividend, dividend growth rate, discount rate of the
business etc. in order to determine the fair value of the stock. Through the study over Smith
plc, the intrinsic value of the stock is $ 1472.08 (Valuation appendix) whereas the market
value of stock is $ 1417.5 which is lower and thus it is recommended to the investors to buy
and hold the stock of the company so that good returns could be got by the investors (Yahoo
finance, 2018).
P/E ratio:
Lastly, P/E ratio defines about the fair value of the stock of an organization on the
basis of the stock price and earnings per share of the company (Moles, Parrino and Kidwekk,
2011). It takes the concern on actual and current data of the company to measure the worth of
stock. In case of Smith group plc, it has been found that the intrinsic value of the stock is $
1157.32 (Valuation appendix) whereas the market value of stock is $ 1417.5 which is quite
higher and thus it is recommended to the investors to sell the stock of the company so that
good returns could be got by the investors.
Discussion:
To study over all the methods, it has assumed that all the valuation models (valuation
appendix) are offering the different data in order to identify the fair value of the stock. On the
basis of overall study, it has been found that P/E model is most reliable model to measure the
fair value of stock because it takes the concern on actual and current data of the company to
measure the worth of stock (Lumby and Jones, 2007). Thus, it is suggested to the investors of
6
Asset based valuation:
Asset based valuation method focuses on the total assets and the liabilities of the
business in order to determine the fair value of the stock. Through the study over Smith plc,
the intrinsic value of the stock is $ 5.74 9 (valuation appendix) whereas the market value of
stock is $ 1417.5 (yahoo finance, 2018) which is quite higher and thus it is recommended to
the investors to sell the stock of the company so that good returns could be got. In order to
calculate the worth of the stock price, asset valuation model is not an appropriate valuation
model as it only considers the book value of the business. However, in case of merger and
amalgamation process, this model is good option.
Dividend valuation model:
Further, divided valuation model has been applied on the business. Dividend
valuation method focuses on the expected dividend, dividend growth rate, discount rate of the
business etc. in order to determine the fair value of the stock. Through the study over Smith
plc, the intrinsic value of the stock is $ 1472.08 (Valuation appendix) whereas the market
value of stock is $ 1417.5 which is lower and thus it is recommended to the investors to buy
and hold the stock of the company so that good returns could be got by the investors (Yahoo
finance, 2018).
P/E ratio:
Lastly, P/E ratio defines about the fair value of the stock of an organization on the
basis of the stock price and earnings per share of the company (Moles, Parrino and Kidwekk,
2011). It takes the concern on actual and current data of the company to measure the worth of
stock. In case of Smith group plc, it has been found that the intrinsic value of the stock is $
1157.32 (Valuation appendix) whereas the market value of stock is $ 1417.5 which is quite
higher and thus it is recommended to the investors to sell the stock of the company so that
good returns could be got by the investors.
Discussion:
To study over all the methods, it has assumed that all the valuation models (valuation
appendix) are offering the different data in order to identify the fair value of the stock. On the
basis of overall study, it has been found that P/E model is most reliable model to measure the
fair value of stock because it takes the concern on actual and current data of the company to
measure the worth of stock (Lumby and Jones, 2007). Thus, it is suggested to the investors of
⊘ This is a preview!⊘
Do you want full access?
Subscribe today to unlock all pages.
Trusted by 1+ million students worldwide
Finance
7
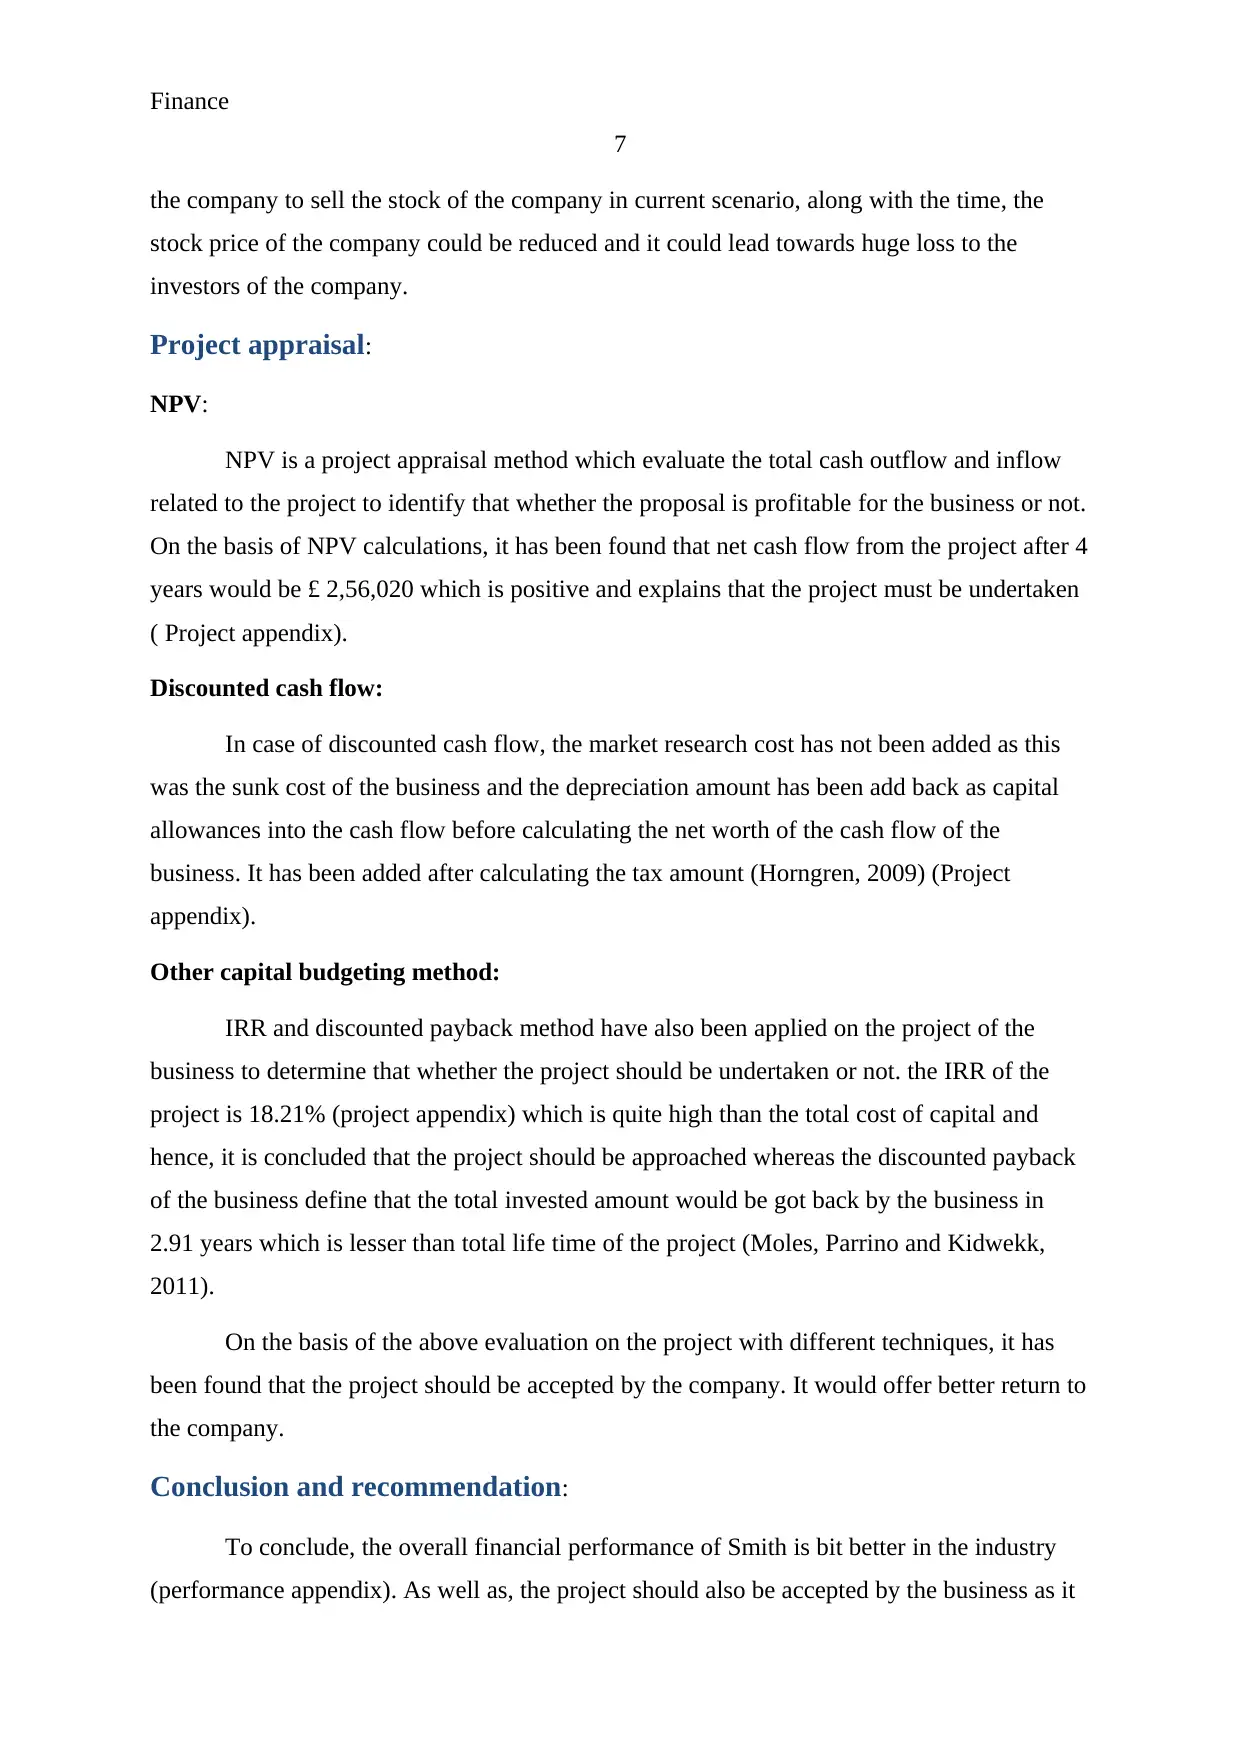
the company to sell the stock of the company in current scenario, along with the time, the
stock price of the company could be reduced and it could lead towards huge loss to the
investors of the company.
Project appraisal:
NPV:
NPV is a project appraisal method which evaluate the total cash outflow and inflow
related to the project to identify that whether the proposal is profitable for the business or not.
On the basis of NPV calculations, it has been found that net cash flow from the project after 4
years would be £ 2,56,020 which is positive and explains that the project must be undertaken
( Project appendix).
Discounted cash flow:
In case of discounted cash flow, the market research cost has not been added as this
was the sunk cost of the business and the depreciation amount has been add back as capital
allowances into the cash flow before calculating the net worth of the cash flow of the
business. It has been added after calculating the tax amount (Horngren, 2009) (Project
appendix).
Other capital budgeting method:
IRR and discounted payback method have also been applied on the project of the
business to determine that whether the project should be undertaken or not. the IRR of the
project is 18.21% (project appendix) which is quite high than the total cost of capital and
hence, it is concluded that the project should be approached whereas the discounted payback
of the business define that the total invested amount would be got back by the business in
2.91 years which is lesser than total life time of the project (Moles, Parrino and Kidwekk,
2011).
On the basis of the above evaluation on the project with different techniques, it has
been found that the project should be accepted by the company. It would offer better return to
the company.
Conclusion and recommendation:
To conclude, the overall financial performance of Smith is bit better in the industry
(performance appendix). As well as, the project should also be accepted by the business as it
7
the company to sell the stock of the company in current scenario, along with the time, the
stock price of the company could be reduced and it could lead towards huge loss to the
investors of the company.
Project appraisal:
NPV:
NPV is a project appraisal method which evaluate the total cash outflow and inflow
related to the project to identify that whether the proposal is profitable for the business or not.
On the basis of NPV calculations, it has been found that net cash flow from the project after 4
years would be £ 2,56,020 which is positive and explains that the project must be undertaken
( Project appendix).
Discounted cash flow:
In case of discounted cash flow, the market research cost has not been added as this
was the sunk cost of the business and the depreciation amount has been add back as capital
allowances into the cash flow before calculating the net worth of the cash flow of the
business. It has been added after calculating the tax amount (Horngren, 2009) (Project
appendix).
Other capital budgeting method:
IRR and discounted payback method have also been applied on the project of the
business to determine that whether the project should be undertaken or not. the IRR of the
project is 18.21% (project appendix) which is quite high than the total cost of capital and
hence, it is concluded that the project should be approached whereas the discounted payback
of the business define that the total invested amount would be got back by the business in
2.91 years which is lesser than total life time of the project (Moles, Parrino and Kidwekk,
2011).
On the basis of the above evaluation on the project with different techniques, it has
been found that the project should be accepted by the company. It would offer better return to
the company.
Conclusion and recommendation:
To conclude, the overall financial performance of Smith is bit better in the industry
(performance appendix). As well as, the project should also be accepted by the business as it
Paraphrase This Document
Need a fresh take? Get an instant paraphrase of this document with our AI Paraphraser

Finance
8
would offer great return to the business (Project appendix). However, on the basis of
valuation approaches, it is recommended to the business to make few changes in internal
activities so that the fair value of the stock could be improved (Valuation appendix).
8
would offer great return to the business (Project appendix). However, on the basis of
valuation approaches, it is recommended to the business to make few changes in internal
activities so that the fair value of the stock could be improved (Valuation appendix).
Finance
9
References:
Annual report. 2017. Hitachi limited. (online). available at:
http://www.hitachi.com/IR-e/library/integrated/ (Accessed 5/12/2018).
Annual report. 2017. Smith group plc. (online). available at:
https://www.smiths.com/-/media/files/annual-report-2017.ashx (Accessed 5/12/2018).
Barlow.J.F.,2006. Excel models for business and operations management, 2nd edition, John
Wiley and sons ltd, England
Gapenski, L.C., 2008. Healthcare finance: an introduction to accounting and financial
management. Health Administration Press.
Higgins, R. C., 2012. Analysis for financial management. McGraw-Hill/Irwin.
Hillier, D., Grinblatt, M. and Titman, S., 2011. Financial markets and corporate strategy.
McGraw Hill.
Home. 2018. Smith group plc. (online). available at: https://www.smiths.com/ (Accessed
5/12/2018).
Horngren, C.T., 2009. Cost accounting: A managerial emphasis, 13/e. Pearson Education
India.
Kaplan, R.S. and Atkinson, A.A., 2015. Advanced management accounting. PHI Learning.
Krantz, M. 2016. Fundamental Analysis for Dummies. London: John Wiley and Sons.
Lord, B.R., 2007. Strategic management accounting. Issues in Management Accounting, 3.
Lumby,S and Jones,C,.2007. Corporate finance theory and practice, 7th edition, Thomson,
London
Madura, J. 2014. Financial Markets and Institutions. Cengage Learning.
Moles, P. Parrino, R and Kidwekk, D,.2011. Corporate finance. European edition, John
Wiley andsons, United Kingdom
Ward, K., 2012. Strategic management accounting. Australia: Routledge.
Weaver, S.C., Weston, J.F. and Weaver, S., 2011. Finance and accounting for nonfinancial
managers. New York: McGraw-Hill.
⊘ This is a preview!⊘
Do you want full access?
Subscribe today to unlock all pages.
Trusted by 1+ million students worldwide

Finance
10
Yahoo Finance. 2018. Smith group plc. (online). available at:
https://finance.yahoo.com/quote/SMIN.L/history?
period1=1385749800&period2=1543516200&interval=div
%7Csplit&filter=div&frequency=1d (Accessed 5/12/2018).
10
Yahoo Finance. 2018. Smith group plc. (online). available at:
https://finance.yahoo.com/quote/SMIN.L/history?
period1=1385749800&period2=1543516200&interval=div
%7Csplit&filter=div&frequency=1d (Accessed 5/12/2018).
Paraphrase This Document
Need a fresh take? Get an instant paraphrase of this document with our AI Paraphraser
Finance
11
Appendix:
Performance appendix:
Smiths Group Plc
Hitachi
Limited
Ratio Calculations 2016 2017 2017
Profitability Ratios: 2016 2017 2017
Return on Capital employed
Operating profit / 387 499 586,012
Capital employed (total assets - current
liabilities)
3,4
77
4,
290
6,311,
209
Answer: % 11.13% 11.63% 9.29%
Net profit margin %
Net profit / 259 570 362,998
Sales Revenue % 2,949 3,280 9,368,614
Answer: 8.78% 17.38% 3.87%
Asset efficiency ratio 2016 2017 2017
Creditors turnover days
Accounts payable/ 202 202 1,536,983
Cost of sales 1,600 1,755 6,866,522
Answer: (note the above needs to be x 365) # days 46.08 42.01 81.70
Stock Turnover (days)
Average Inventory / 478 452 1,375,232
Cost of Sales # days 1,600 1,755 6,866,522
Answer: (note the above needs to be x 365) 109.04 94.01 73.10
Liquidity Ratios 2016 2017 2017
Current Ratio
Current Assets / 1,753 2,031 5,151,800
Current liabilities
9
96 867
3,795,
394
Answer: 1.76 2.34 1.36
Quick ratio
Current Assets - Inventory / 1,275 1,579 3,776,568
Finance
12
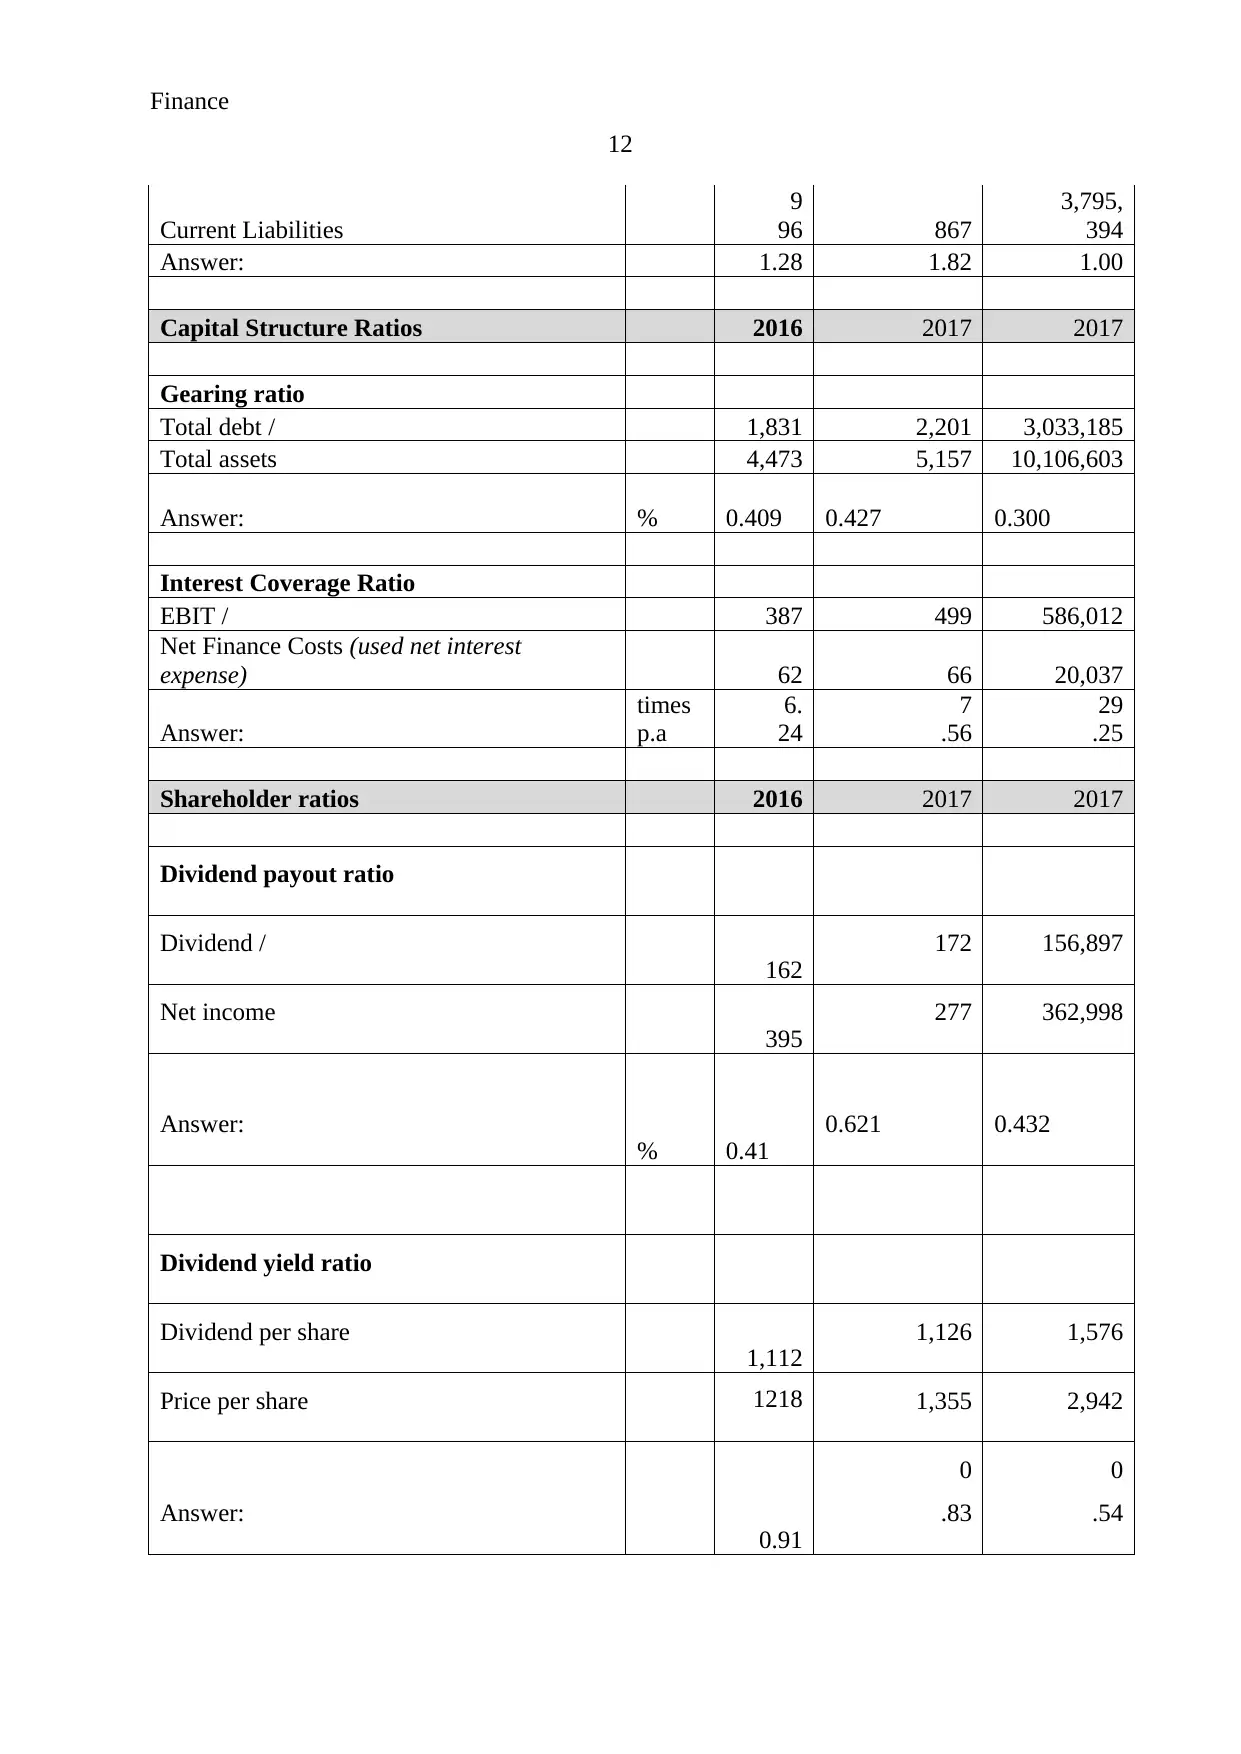
Current Liabilities
9
96 867
3,795,
394
Answer: 1.28 1.82 1.00
Capital Structure Ratios 2016 2017 2017
Gearing ratio
Total debt / 1,831 2,201 3,033,185
Total assets 4,473 5,157 10,106,603
Answer: % 0.409 0.427 0.300
Interest Coverage Ratio
EBIT / 387 499 586,012
Net Finance Costs (used net interest
expense) 62 66 20,037
Answer:
times
p.a
6.
24
7
.56
29
.25
Shareholder ratios 2016 2017 2017
Dividend payout ratio
Dividend /
162
172 156,897
Net income
395
277 362,998
Answer:
% 0.41
0.621 0.432
Dividend yield ratio
Dividend per share
1,112
1,126 1,576
Price per share 1218 1,355 2,942
Answer:
0.91
0
.83
0
.54
12
Current Liabilities
9
96 867
3,795,
394
Answer: 1.28 1.82 1.00
Capital Structure Ratios 2016 2017 2017
Gearing ratio
Total debt / 1,831 2,201 3,033,185
Total assets 4,473 5,157 10,106,603
Answer: % 0.409 0.427 0.300
Interest Coverage Ratio
EBIT / 387 499 586,012
Net Finance Costs (used net interest
expense) 62 66 20,037
Answer:
times
p.a
6.
24
7
.56
29
.25
Shareholder ratios 2016 2017 2017
Dividend payout ratio
Dividend /
162
172 156,897
Net income
395
277 362,998
Answer:
% 0.41
0.621 0.432
Dividend yield ratio
Dividend per share
1,112
1,126 1,576
Price per share 1218 1,355 2,942
Answer:
0.91
0
.83
0
.54
⊘ This is a preview!⊘
Do you want full access?
Subscribe today to unlock all pages.
Trusted by 1+ million students worldwide
1 out of 15
Related Documents


Your All-in-One AI-Powered Toolkit for Academic Success.
+13062052269
info@desklib.com
Available 24*7 on WhatsApp / Email
![[object Object]](/_next/static/media/star-bottom.7253800d.svg)
Unlock your academic potential
Copyright © 2020–2026 A2Z Services. All Rights Reserved. Developed and managed by ZUCOL.