University Solar Collector Lab Report: ENG790s2 Energy Systems
VerifiedAdded on 2022/08/28
|21
|3935
|15
Report
AI Summary
This lab report details an experiment using a Cussons P1740 solar heating apparatus to demonstrate the principles of solar energy collection and determine its efficiency. The experiment involves a shallow heat collection tray, a glass cover, and a water circulation system. The methodology includes developing a theoretical model based on existing literature, setting up the experimental apparatus, taking measurements of various parameters like water temperature, flow rate, and tilt angle, and analyzing the results. The theoretical model provides equations for heat transfer within the solar collector, considering factors like radiation, convection, and conduction. The experimental setup involves a solar panel, glass cover, pump, cooling coil, flow meter, absorptive material, heating tray, insulation layer, reservoir, and flow control valve. The procedure includes setting the flow rate, monitoring airlocks, and taking readings with and without insulation. The results are analyzed by comparing theoretical and experimental data, with a sensitivity analysis to determine the impact of various parameters on the efficiency of the solar collector. The report also includes discussions on the effects of operational parameters and the implications of assumptions made during the experiment, providing a comprehensive understanding of solar energy collection.
ENERGY SYSTEMS LAB
Name of student
Institution
Date
Name of student
Institution
Date
Paraphrase This Document
Need a fresh take? Get an instant paraphrase of this document with our AI Paraphraser
Table of Contents
Introduction......................................................................................................................................3
Methodology....................................................................................................................................4
Development of the theoretical model.............................................................................................5
Experimental setup and measurements model.................................................................................5
Results analysis................................................................................................................................6
Sensitivity analysis..........................................................................................................................6
Theoretical model............................................................................................................................6
Theory and equations.......................................................................................................................6
Experimental set-up.......................................................................................................................10
Equipment’s...................................................................................................................................10
Procedure:......................................................................................................................................11
Assumptions..................................................................................................................................13
Result and discussion:....................................................................................................................13
Experimental data..........................................................................................................................13
Graphical data................................................................................................................................15
Discussion......................................................................................................................................20
Conclusions....................................................................................................................................21
References......................................................................................................................................22
Introduction
As stated in the above laboratory experiment objective, a Cussons P1740 solar heating apparatus is to be used to
show how heat from solar energy is obtained as well as its efficiency in capturing heat. The diagram shown below
indicates the Cussons P1740 solar heating apparatus. It includes a shallow heat collection tray including a base that is
attached to a removable heat capture material that is significant during the heat transfer process (Costa et al., 2016). A flat
plate glass material is then utilized to cover the transfer plate, which also performs the duty of capturing the radiated heat
present on top of the heating lamps and then reflect it back.
The heat transfer plate as well acts as passage surface for the water which is pumped to the tray and then taken
back via the base of the unit to the insulated reservoir. This water gets circulated in a repeated manner inside the transfer
plate, in order to intensify the temperature in the reservoir. The aluminium fins are significant in offering water to the
wall to ensure extreme transfer of heat (Ohta, 2013). The speed at which water flows from the feed can not only be
regulated but also determined. when this occurs, various amounts of water exposure are allowed to the heated tray. The
mounting of the unit allows for tilting of the base between +10o horizontally, hence enabling an adjustment of the tray.
There is a total of eight thermocouples, which are utilized for determining the water temperature, and the
thermocouples are attached to a selector switch. The selector switch output, in turn, is attached to the data capture pc. The
labelling of the thermocouples is done statistically and they determine he temperatures at the below points air space in the
tray, upper panel surface, water outside the solar panel, water reservoir temperature, water inside the solar panel, the
ambient air, lower lass surface as well as the upper glass surface.
Objective
Majorly, this laboratory experiment aim at demonstrating the principle of solar energy collection through the
utilization of Cussons P1740 solar heating apparatus. The apparatus is designated to show how heat is captured from a
solar energy unit and then the illustration of the relative efficiency with respect to the theoretical one provided.
Methodology
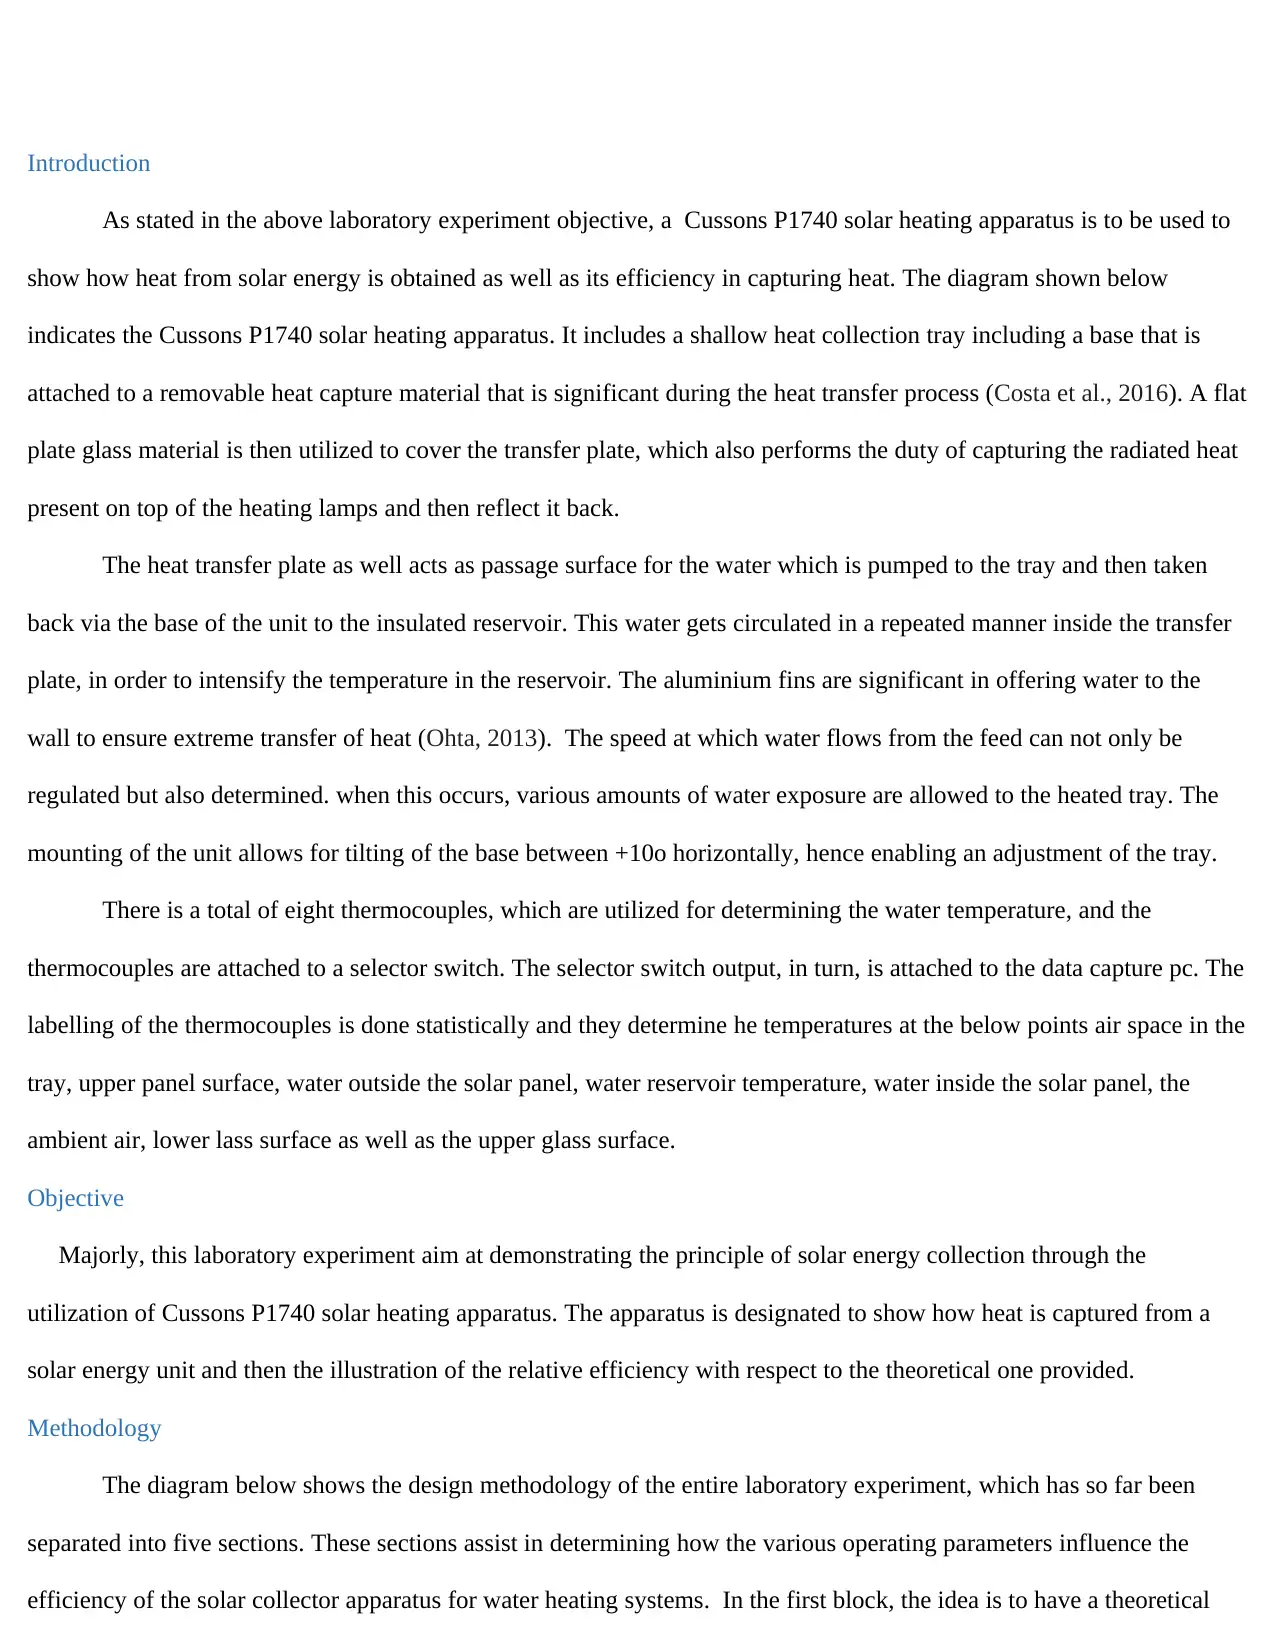
The diagram below shows the design methodology of the entire laboratory experiment, which has so far been
separated into five sections. These sections assist in determining how the various operating parameters influence the
efficiency of the solar collector apparatus for water heating systems. In the first block, the idea is to have a theoretical
As stated in the above laboratory experiment objective, a Cussons P1740 solar heating apparatus is to be used to
show how heat from solar energy is obtained as well as its efficiency in capturing heat. The diagram shown below
indicates the Cussons P1740 solar heating apparatus. It includes a shallow heat collection tray including a base that is
attached to a removable heat capture material that is significant during the heat transfer process (Costa et al., 2016). A flat
plate glass material is then utilized to cover the transfer plate, which also performs the duty of capturing the radiated heat
present on top of the heating lamps and then reflect it back.
The heat transfer plate as well acts as passage surface for the water which is pumped to the tray and then taken
back via the base of the unit to the insulated reservoir. This water gets circulated in a repeated manner inside the transfer
plate, in order to intensify the temperature in the reservoir. The aluminium fins are significant in offering water to the
wall to ensure extreme transfer of heat (Ohta, 2013). The speed at which water flows from the feed can not only be
regulated but also determined. when this occurs, various amounts of water exposure are allowed to the heated tray. The
mounting of the unit allows for tilting of the base between +10o horizontally, hence enabling an adjustment of the tray.
There is a total of eight thermocouples, which are utilized for determining the water temperature, and the
thermocouples are attached to a selector switch. The selector switch output, in turn, is attached to the data capture pc. The
labelling of the thermocouples is done statistically and they determine he temperatures at the below points air space in the
tray, upper panel surface, water outside the solar panel, water reservoir temperature, water inside the solar panel, the
ambient air, lower lass surface as well as the upper glass surface.
Objective
Majorly, this laboratory experiment aim at demonstrating the principle of solar energy collection through the
utilization of Cussons P1740 solar heating apparatus. The apparatus is designated to show how heat is captured from a
solar energy unit and then the illustration of the relative efficiency with respect to the theoretical one provided.
Methodology
The diagram below shows the design methodology of the entire laboratory experiment, which has so far been
separated into five sections. These sections assist in determining how the various operating parameters influence the
efficiency of the solar collector apparatus for water heating systems. In the first block, the idea is to have a theoretical
⊘ This is a preview!⊘
Do you want full access?
Subscribe today to unlock all pages.
Trusted by 1+ million students worldwide
model, which is with regards to the existing literary knowledge. In the second block, a description of the experimental
activity which was conducted has been detailed. This is then proceeded by analysis of data which has been extracted from
the above three blocks. Further analysis is done in the fourth block and then followed by a block detailing the effects of
the operational parameters on the efficiency of the solar collector apparatus
Development of the theoretical model
The theoretical model basically aims at creating a better comprehension of the general solar collector as well as
how it is affected by various operational parameters. The model gives a detailed explanation of how the transfer of heat
takes place in solar collectors, by proving additional equations to supplement the knowledge. The equations were with
regards to the information already existing in research articles related to solar energy. This theoretical model was
significant as it was used in analysing the experimental measurements which have been obtained.
Experimental setup and measurements model
In this stage, the base structure of the solar collector was being modelled. At this stage, certain measurements
were recorded to assess the performance of the solar collector apparatus. In order to understand the effect of flow rate on
the efficiency, the readings were taken every two minutes for ten rounds. These readings included the inlet temperatures,
outlet temperatures, sun peak hours as well as the temperature of the tank.
To determine the implication of the tilt angle on the efficiency, the rate of flow was kept at a constant value, and
thus only the angle being varied and readings taken. . These readings included the inlet temperatures, outlet temperatures,
sun peak hours as well as the temperature of the tank.
Paraphrase This Document
Need a fresh take? Get an instant paraphrase of this document with our AI Paraphraser
Results analysis
The analysis of the data was with respect to the two above blocks. A comparison of the theoretical and
experimental results was made and then the discussion formulated. The conclusion was then done with regards to the
effects of various parameters on the performance of the solar apparatus.
Sensitivity analysis
This analysis was done based on the various computations and assumptions, which have affected the overall
outcome of the experiment. To fully realise the difference, the data obtained was altered a bit, but one at a time. This
allowed for analysis of deviations in the final outcome.
Theoretical model
Theory and equations
From the source of solar radiation and light comes in the form of optical wavelengths, and as they pass through
the crystal clear cover, they get reflected back at infrared wavelengths from the opaque cover, hence trapped light energy.
In order to conduct the analysis, the heater is segregated into two thermal divisions, the first being the cover section while
the second one the solar panel. Applying the nomenclature illustrated in the second figure, the energy balances can be
depicted as shown below
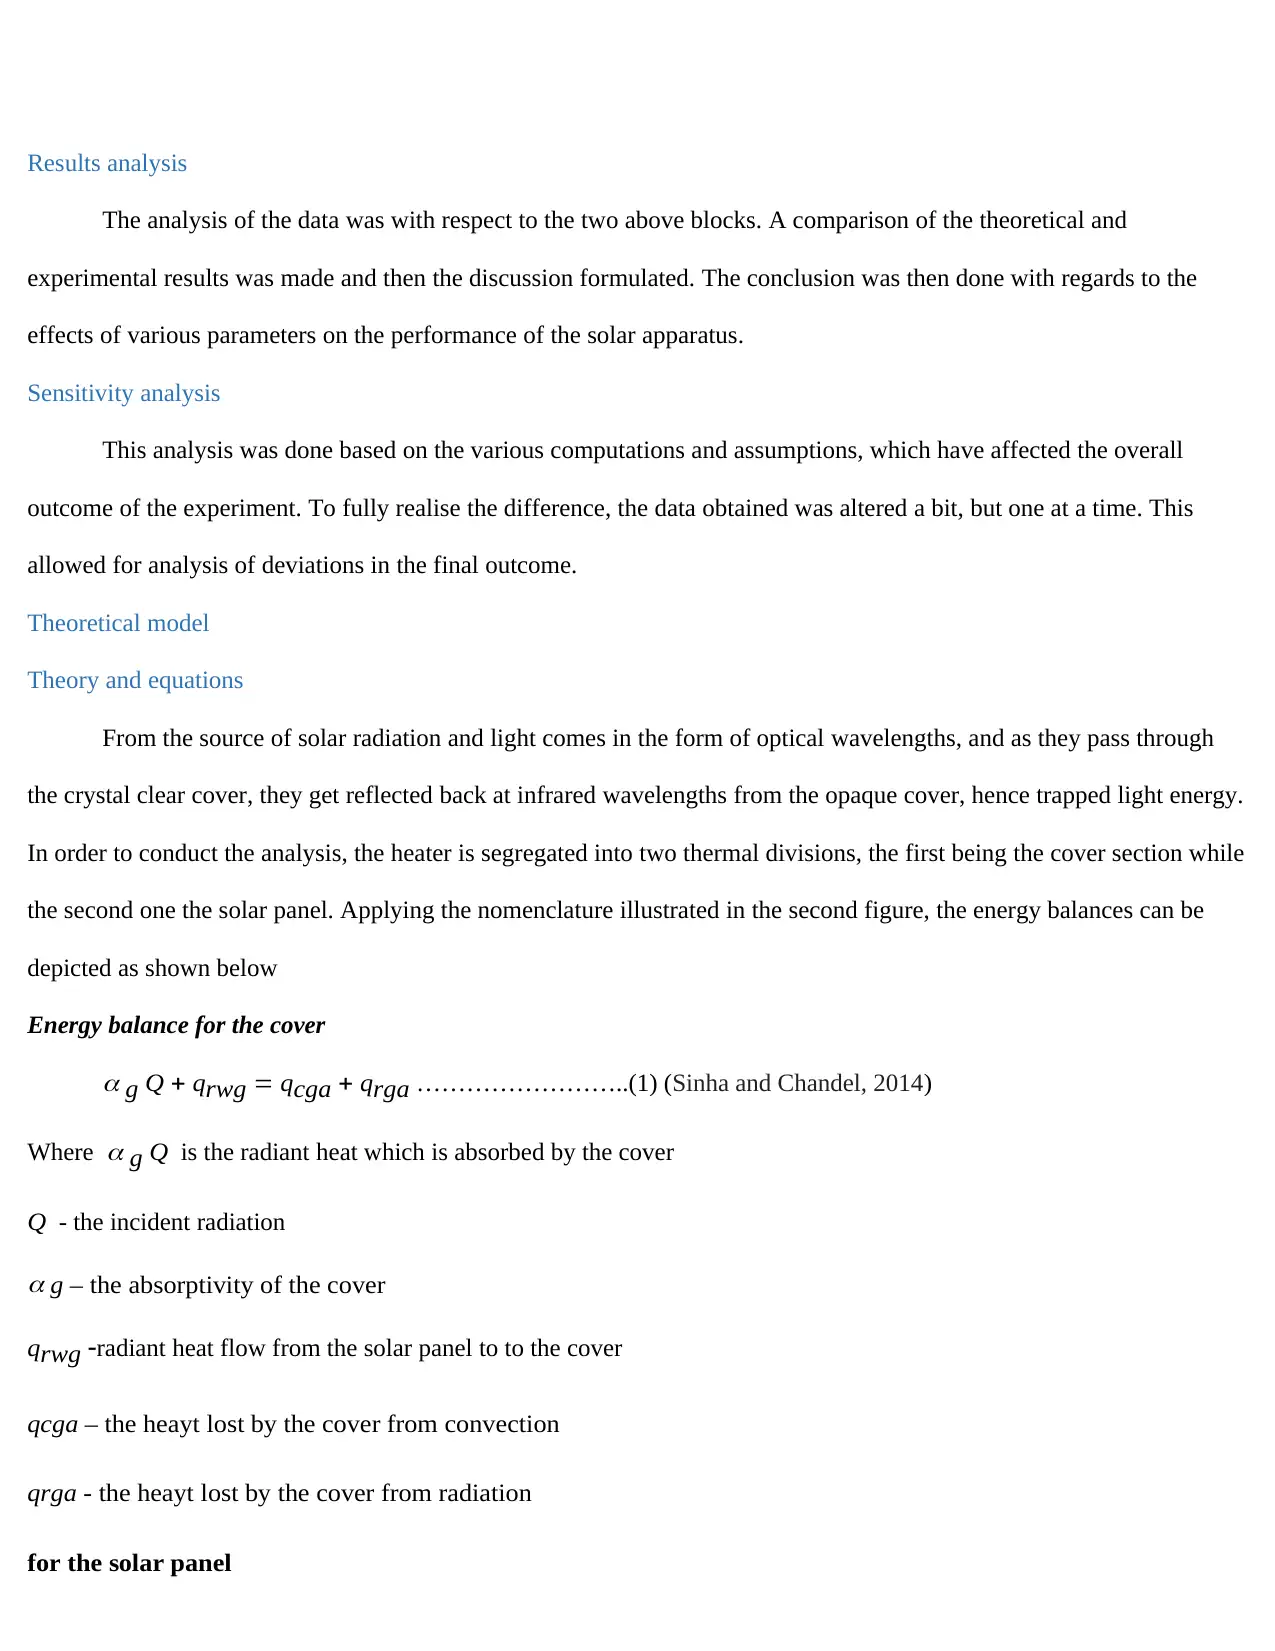
Energy balance for the cover
g Q qrwg qcga qrga ……………………..(1) (Sinha and Chandel, 2014)
Where g Q is the radiant heat which is absorbed by the cover
Q - the incident radiation
g – the absorptivity of the cover
qrwg radiant heat flow from the solar panel to to the cover
qcga – the heayt lost by the cover from convection
qrga - the heayt lost by the cover from radiation
for the solar panel
The analysis of the data was with respect to the two above blocks. A comparison of the theoretical and
experimental results was made and then the discussion formulated. The conclusion was then done with regards to the
effects of various parameters on the performance of the solar apparatus.
Sensitivity analysis
This analysis was done based on the various computations and assumptions, which have affected the overall
outcome of the experiment. To fully realise the difference, the data obtained was altered a bit, but one at a time. This
allowed for analysis of deviations in the final outcome.
Theoretical model
Theory and equations
From the source of solar radiation and light comes in the form of optical wavelengths, and as they pass through
the crystal clear cover, they get reflected back at infrared wavelengths from the opaque cover, hence trapped light energy.
In order to conduct the analysis, the heater is segregated into two thermal divisions, the first being the cover section while
the second one the solar panel. Applying the nomenclature illustrated in the second figure, the energy balances can be
depicted as shown below
Energy balance for the cover
g Q qrwg qcga qrga ……………………..(1) (Sinha and Chandel, 2014)
Where g Q is the radiant heat which is absorbed by the cover
Q - the incident radiation
g – the absorptivity of the cover
qrwg radiant heat flow from the solar panel to to the cover
qcga – the heayt lost by the cover from convection
qrga - the heayt lost by the cover from radiation
for the solar panel
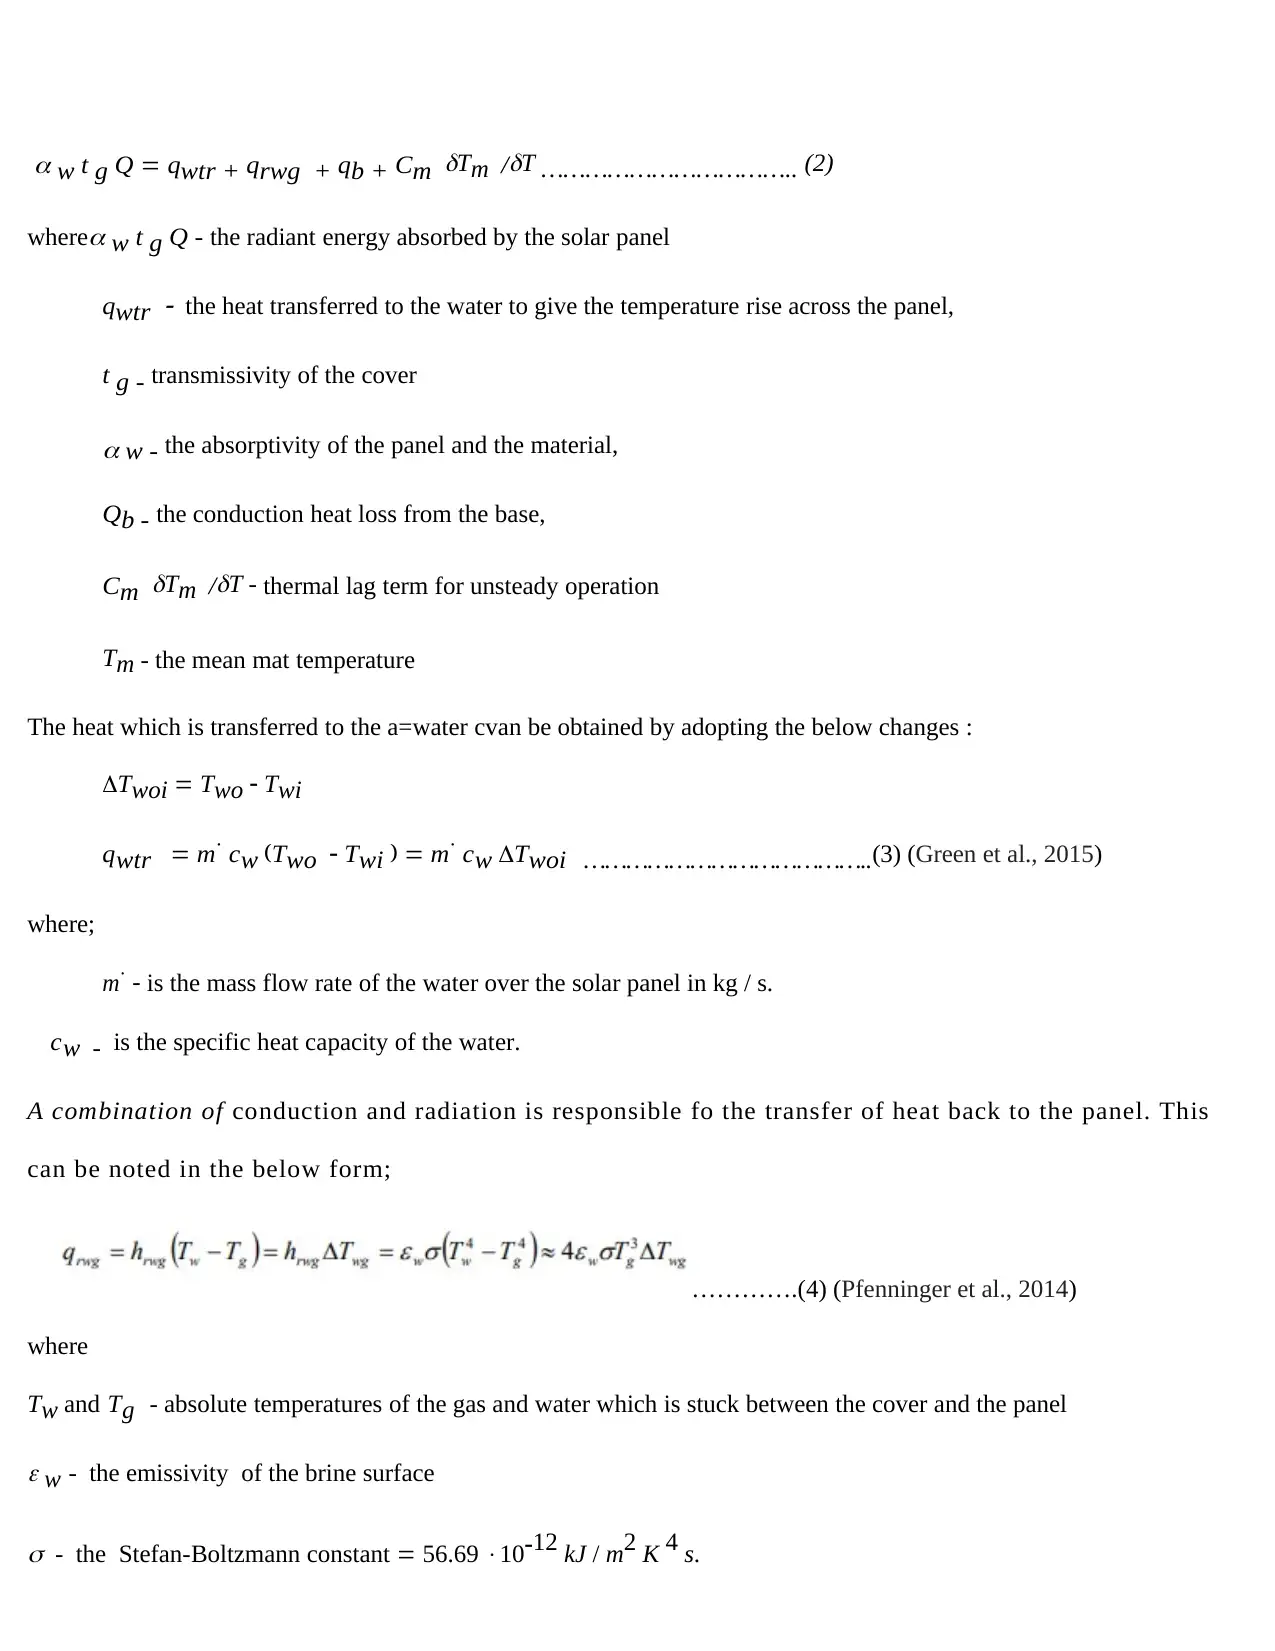
w t g Q qwtr + qrwg + qb + Cm
Tm /
T …………………………….. (2)
where
w t g Q - the radiant energy absorbed by the solar panel
qwtr
the heat transferred to the water to give the temperature rise across the panel,
t g - transmissivity of the cover
w - the absorptivity of the panel and the material,
Qb - the conduction heat loss from the base,
Cm
Tm /
T - thermal lag term for unsteady operation
Tm - the mean mat temperature
The heat which is transferred to the a=water cvan be obtained by adopting the below changes :
Twoi Two Twi
qwtr m cw Two Twi m cw Twoi …………………………………..(3) (Green et al., 2015)
where;
m - is the mass flow rate of the water over the solar panel in kg / s.
cw - is the specific heat capacity of the water.
A combination of conduction and radiation is responsible fo the transfer of heat back to the panel. This
can be noted in the below form;
………….(4) (Pfenninger et al., 2014)
where
Tw and Tg - absolute temperatures of the gas and water which is stuck between the cover and the panel
w - the emissivity of the brine surface
- the Stefan-Boltzmann constant 56.69 1012 kJ / m2 K 4 s.
Tm /
T …………………………….. (2)
where
w t g Q - the radiant energy absorbed by the solar panel
qwtr
the heat transferred to the water to give the temperature rise across the panel,
t g - transmissivity of the cover
w - the absorptivity of the panel and the material,
Qb - the conduction heat loss from the base,
Cm
Tm /
T - thermal lag term for unsteady operation
Tm - the mean mat temperature
The heat which is transferred to the a=water cvan be obtained by adopting the below changes :
Twoi Two Twi
qwtr m cw Two Twi m cw Twoi …………………………………..(3) (Green et al., 2015)
where;
m - is the mass flow rate of the water over the solar panel in kg / s.
cw - is the specific heat capacity of the water.
A combination of conduction and radiation is responsible fo the transfer of heat back to the panel. This
can be noted in the below form;
………….(4) (Pfenninger et al., 2014)
where
Tw and Tg - absolute temperatures of the gas and water which is stuck between the cover and the panel
w - the emissivity of the brine surface
- the Stefan-Boltzmann constant 56.69 1012 kJ / m2 K 4 s.
⊘ This is a preview!⊘
Do you want full access?
Subscribe today to unlock all pages.
Trusted by 1+ million students worldwide
rg
a
g
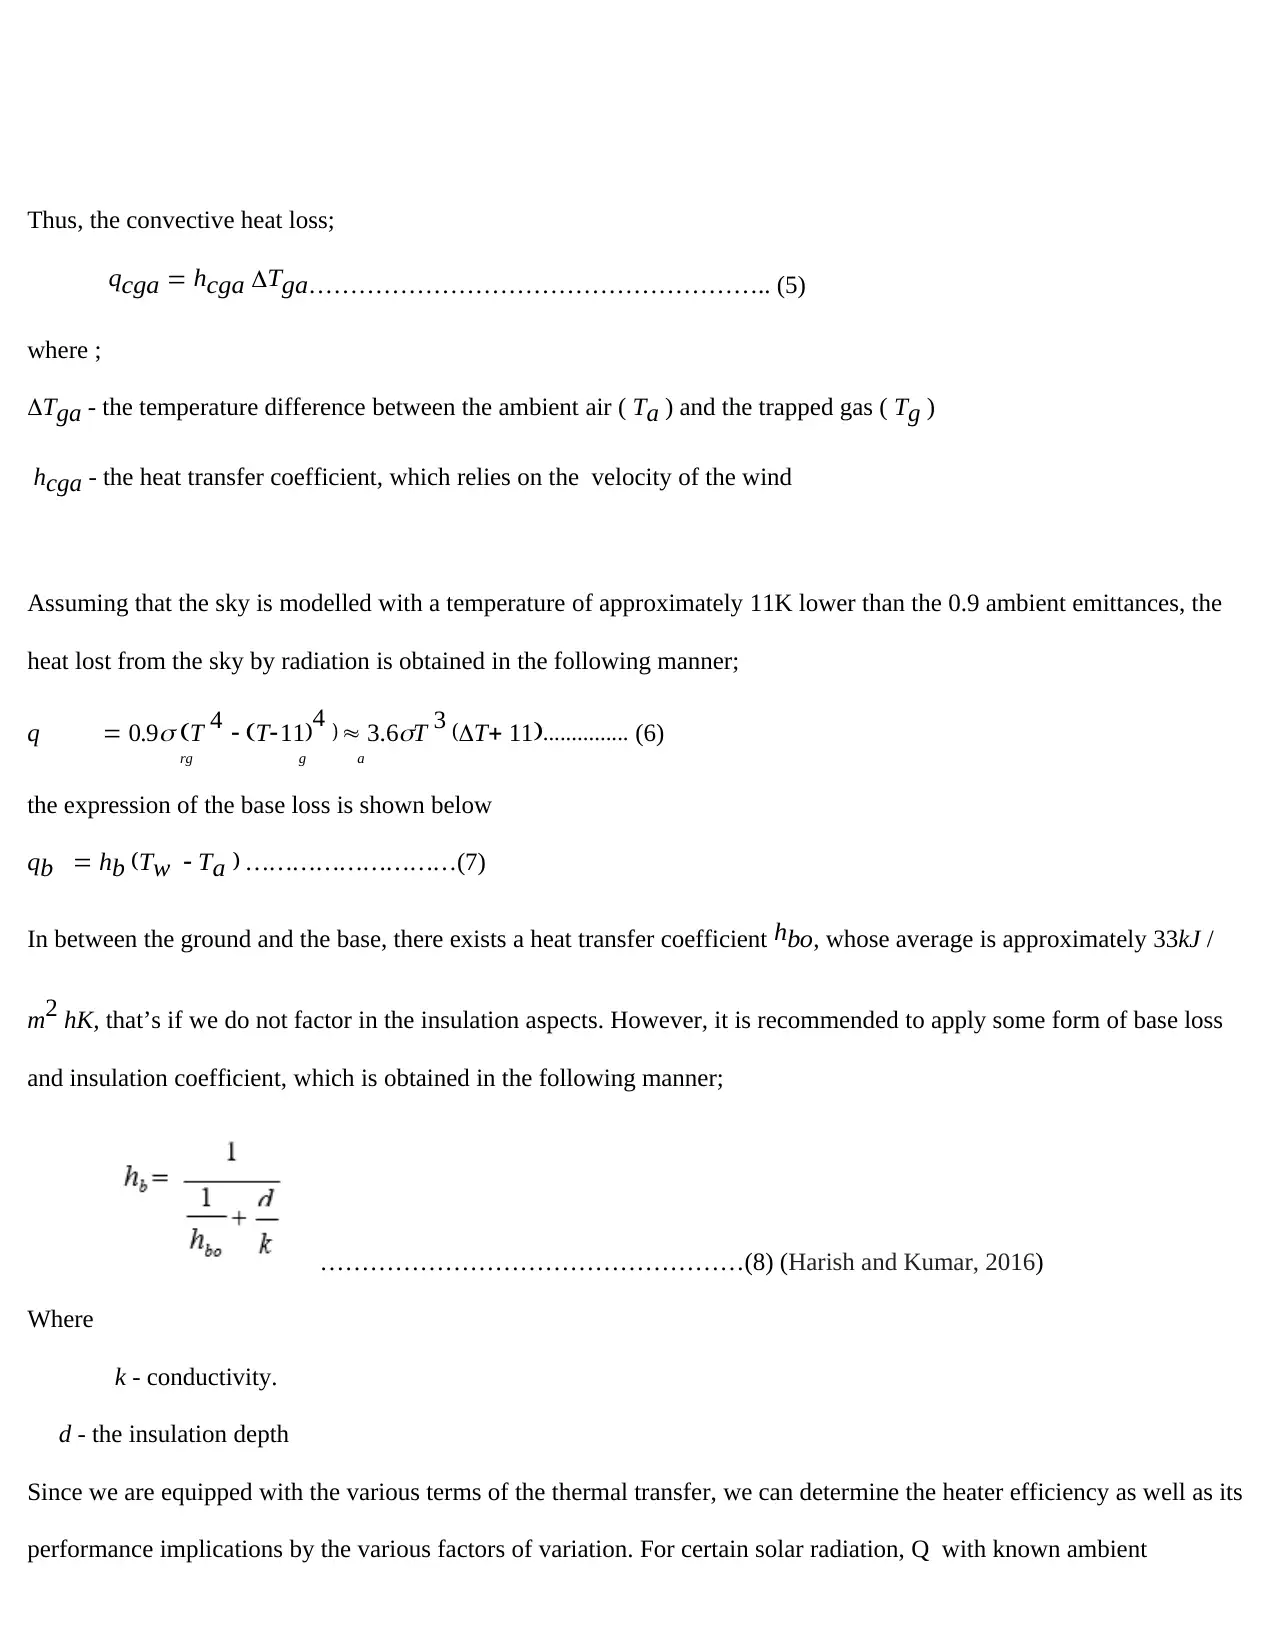
Thus, the convective heat loss;
qcga hcga Tga……………………………………………….. (5)
where ;
Tga - the temperature difference between the ambient air ( Ta ) and the trapped gas ( Tg )
hcga - the heat transfer coefficient, which relies on the velocity of the wind
Assuming that the sky is modelled with a temperature of approximately 11K lower than the 0.9 ambient emittances, the
heat lost from the sky by radiation is obtained in the following manner;
q 0.9
T 4 T 11 4 3.6
T 3 T 11 (6)
the expression of the base loss is shown below
qb hb T w T a ………………………(7)
In between the ground and the base, there exists a heat transfer coefficient hbo, whose average is approximately 33kJ /
m2 hK, that’s if we do not factor in the insulation aspects. However, it is recommended to apply some form of base loss
and insulation coefficient, which is obtained in the following manner;
……………………………………………(8) (Harish and Kumar, 2016)
Where
k - conductivity.
d - the insulation depth
Since we are equipped with the various terms of the thermal transfer, we can determine the heater efficiency as well as its
performance implications by the various factors of variation. For certain solar radiation, Q with known ambient
a
a
g
Thus, the convective heat loss;
qcga hcga Tga……………………………………………….. (5)
where ;
Tga - the temperature difference between the ambient air ( Ta ) and the trapped gas ( Tg )
hcga - the heat transfer coefficient, which relies on the velocity of the wind
Assuming that the sky is modelled with a temperature of approximately 11K lower than the 0.9 ambient emittances, the
heat lost from the sky by radiation is obtained in the following manner;
q 0.9
T 4 T 11 4 3.6
T 3 T 11 (6)
the expression of the base loss is shown below
qb hb T w T a ………………………(7)
In between the ground and the base, there exists a heat transfer coefficient hbo, whose average is approximately 33kJ /
m2 hK, that’s if we do not factor in the insulation aspects. However, it is recommended to apply some form of base loss
and insulation coefficient, which is obtained in the following manner;
……………………………………………(8) (Harish and Kumar, 2016)
Where
k - conductivity.
d - the insulation depth
Since we are equipped with the various terms of the thermal transfer, we can determine the heater efficiency as well as its
performance implications by the various factors of variation. For certain solar radiation, Q with known ambient
a
Paraphrase This Document
Need a fresh take? Get an instant paraphrase of this document with our AI Paraphraser
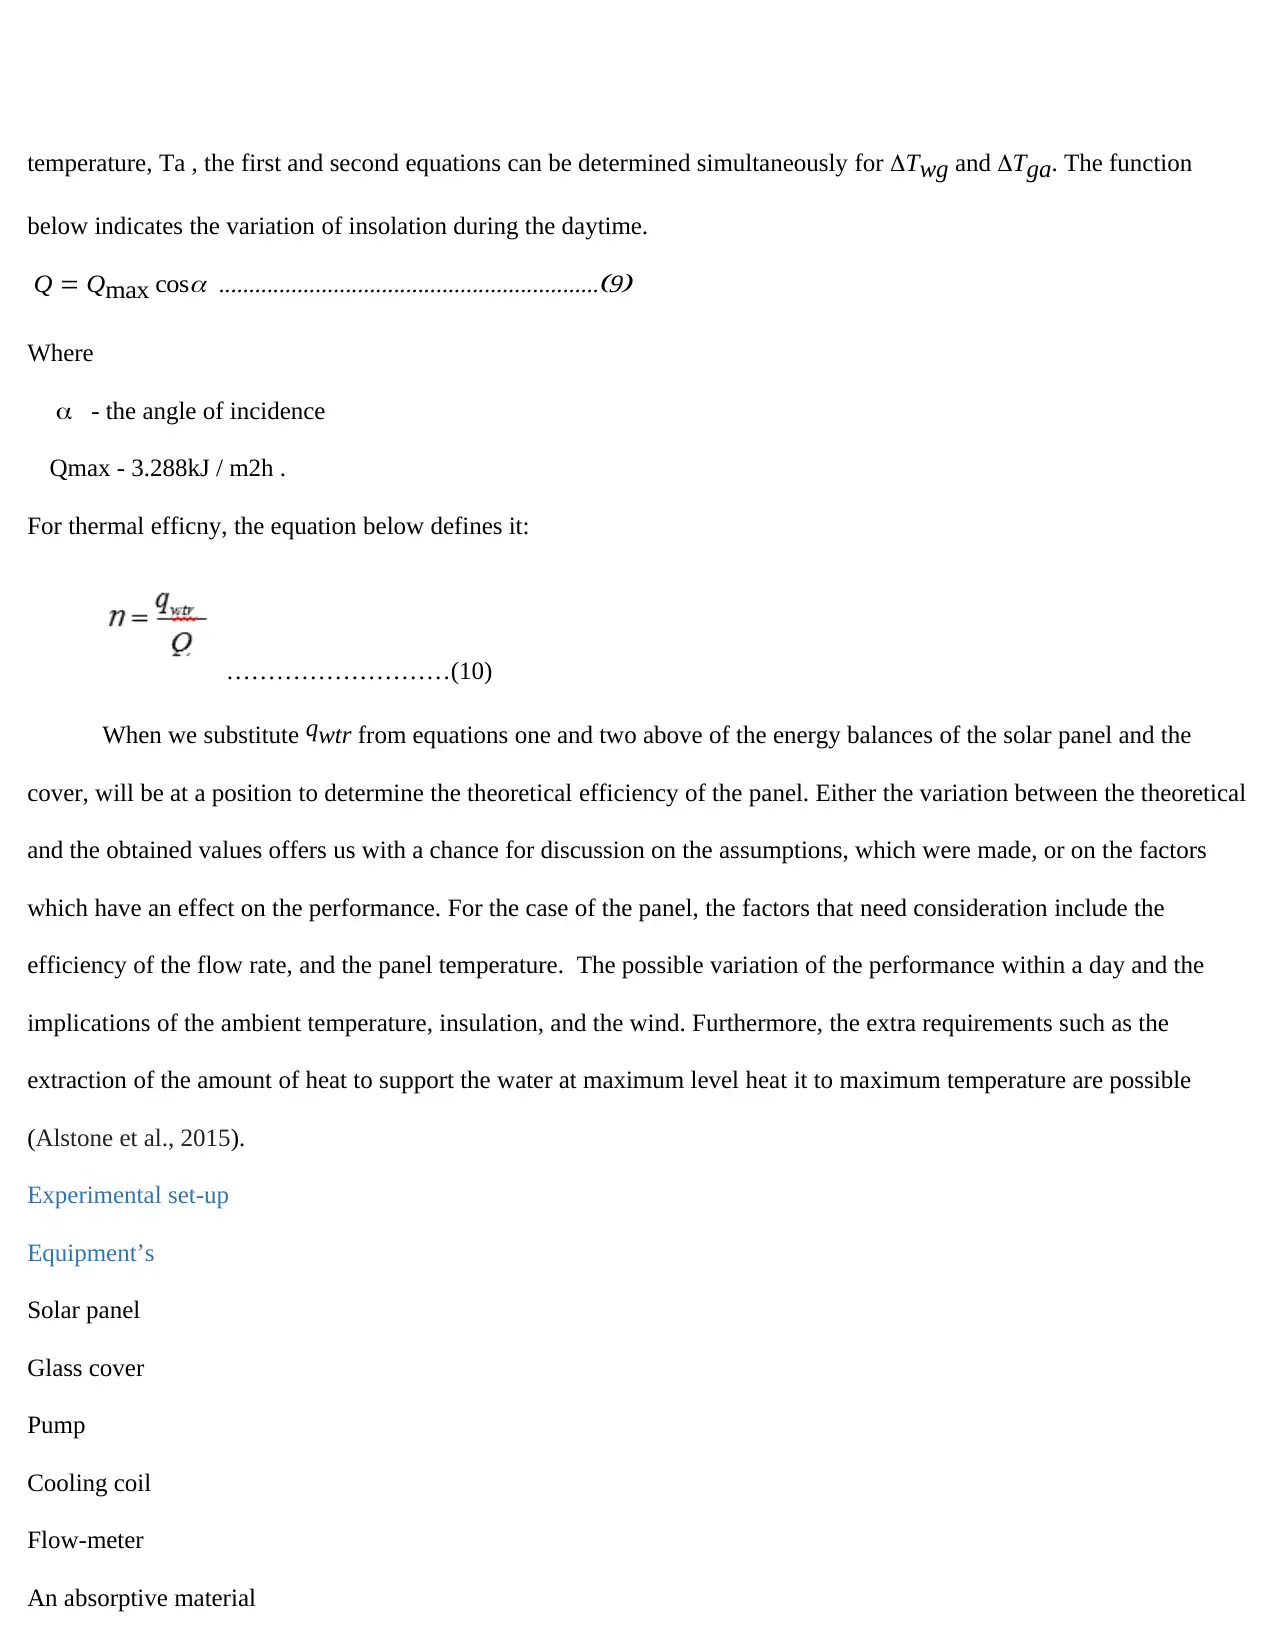
temperature, Ta , the first and second equations can be determined simultaneously for Twg and Tga. The function
below indicates the variation of insolation during the daytime.
Q Qmax cos
Where
- the angle of incidence
Qmax - 3.288kJ / m2h .
For thermal efficny, the equation below defines it:
………………………(10)
When we substitute qwtr from equations one and two above of the energy balances of the solar panel and the
cover, will be at a position to determine the theoretical efficiency of the panel. Either the variation between the theoretical
and the obtained values offers us with a chance for discussion on the assumptions, which were made, or on the factors
which have an effect on the performance. For the case of the panel, the factors that need consideration include the
efficiency of the flow rate, and the panel temperature. The possible variation of the performance within a day and the
implications of the ambient temperature, insulation, and the wind. Furthermore, the extra requirements such as the
extraction of the amount of heat to support the water at maximum level heat it to maximum temperature are possible
(Alstone et al., 2015).
Experimental set-up
Equipment’s
Solar panel
Glass cover
Pump
Cooling coil
Flow-meter
An absorptive material
Heating tray
An insulation layer
Reservoir
Flow control valve
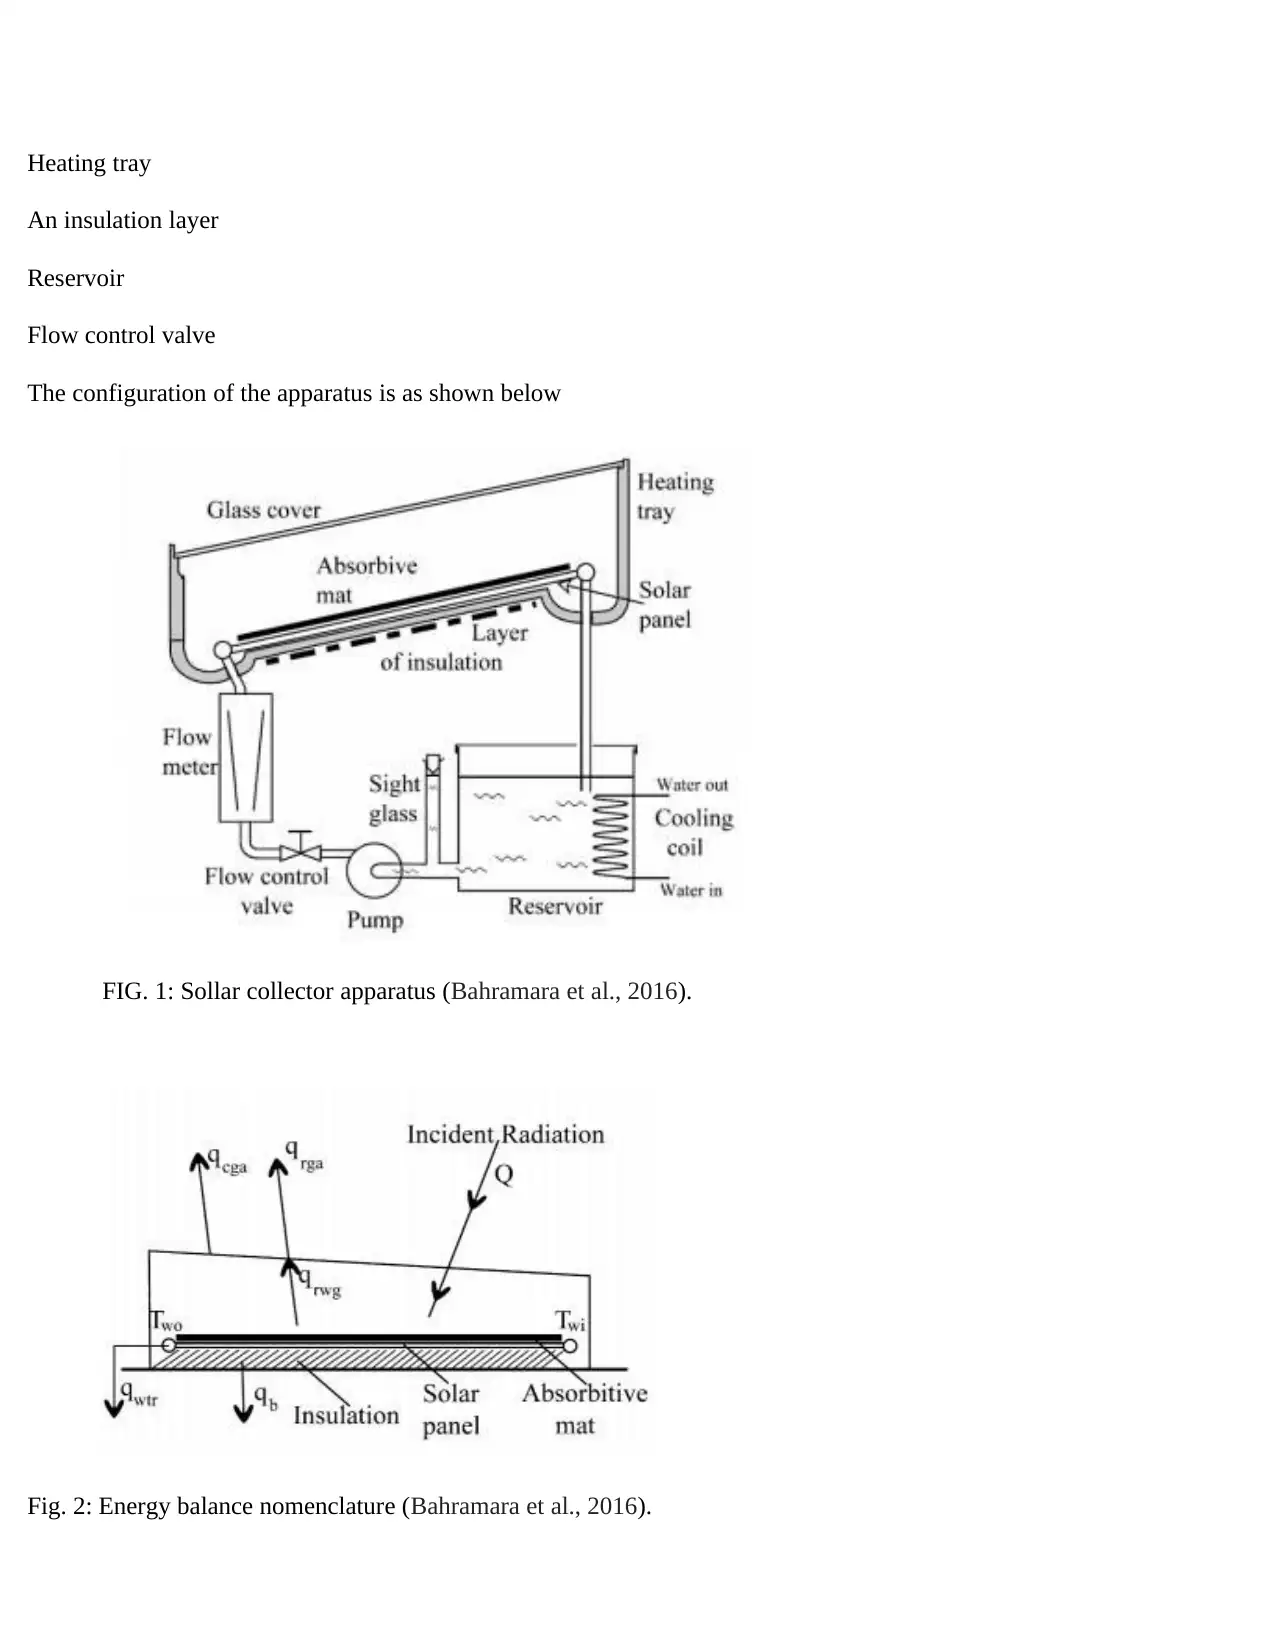
The configuration of the apparatus is as shown below
FIG. 1: Sollar collector apparatus (Bahramara et al., 2016).
Fig. 2: Energy balance nomenclature (Bahramara et al., 2016).
An insulation layer
Reservoir
Flow control valve
The configuration of the apparatus is as shown below
FIG. 1: Sollar collector apparatus (Bahramara et al., 2016).
Fig. 2: Energy balance nomenclature (Bahramara et al., 2016).
⊘ This is a preview!⊘
Do you want full access?
Subscribe today to unlock all pages.
Trusted by 1+ million students worldwide
Procedure:
The cushions P1740 solar heating apparatus was first turned on and the adjusted from the flow control valve until
the rate of flow of water was recorded as 4 litres per minute. It was let at that point until an equilibrium of the water flow
was attained, after which, all the airlocks within the system was monitored. It was advised at this juncture that the base of
the solar panel be eliminated, which was done consequently.
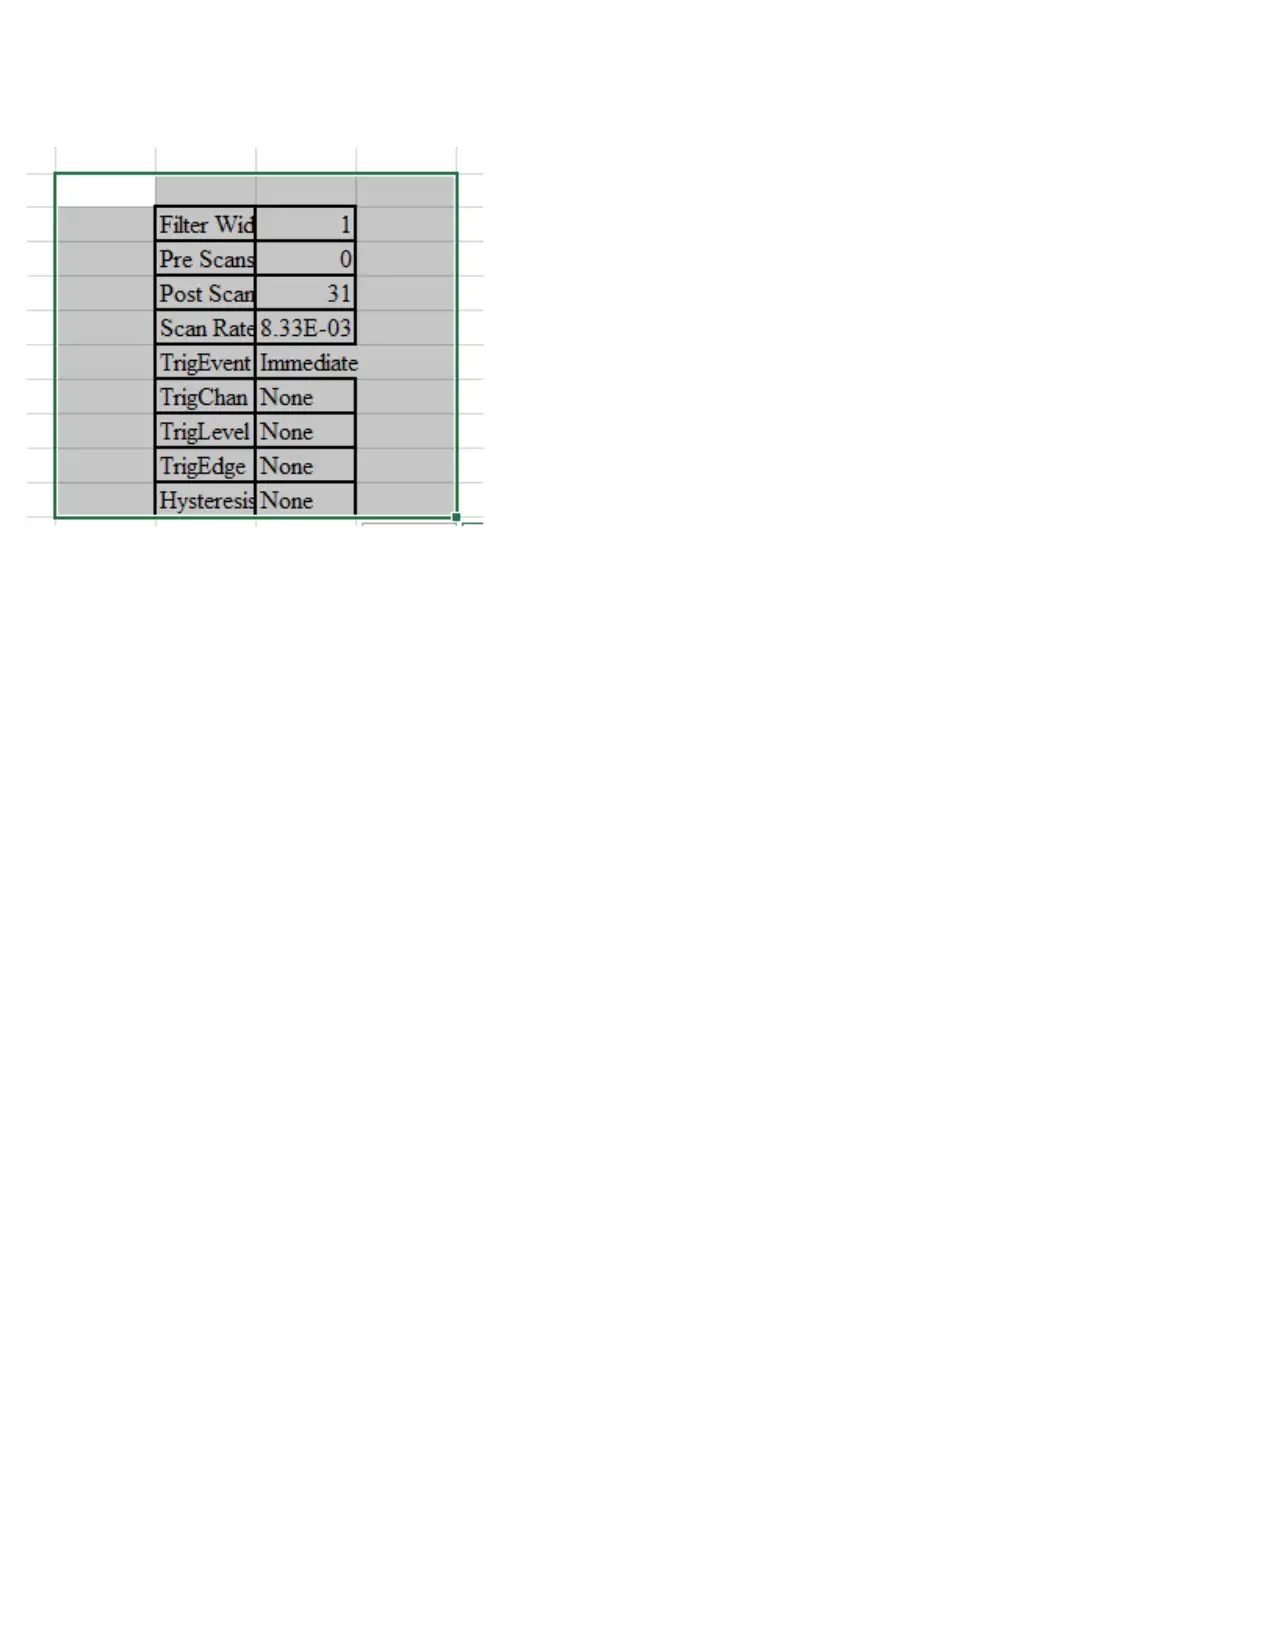
After the above steps, the personal daqview computer software was begun, setting the recommended values for
the experiment. The parameters included an interval of two minutes for 11 data capture points, for a total duration of
twenty minutes. Thereafter, the heating lamps were turned on and a minute allowed to elapse, then proceeded by starting
of the logging of data in the personaldaqview. This data was then saved upon the completion of the time step.
After the above step, the insulation to the base of the solar panel, which had been initially eliminated, was
replaced back, and data logging of a new set began within the computer software. The above step was repeated, i.e. the
recommended parameters for the experiment was set for twenty minutes, followed by turning on of the heating lamps for
a minute and finally,-logging of data in the personaldaqview. This second data as well was then saved upon the
completion of the time step. Of worth noting is that the rate of flow for the two procedures was maintained at four
minutes for every minute.
Subsequently, the rate of flow was changed from four litres for every minute, to two litres for every minute and
then the water flow allowed until equilibrium was attained. This was then proceeded by logging of data. The base of the
solar panel is eliminated, which was done consequently. the recommended parameters for the experiment was set for
twenty minutes, followed by turning on of the heating lamps for a minute and finally,-logging of data in the
personaldaqview. This third set of data as well was saved upon the completion of the time step.
The cushions P1740 solar heating apparatus was first turned on and the adjusted from the flow control valve until
the rate of flow of water was recorded as 4 litres per minute. It was let at that point until an equilibrium of the water flow
was attained, after which, all the airlocks within the system was monitored. It was advised at this juncture that the base of
the solar panel be eliminated, which was done consequently.
After the above steps, the personal daqview computer software was begun, setting the recommended values for
the experiment. The parameters included an interval of two minutes for 11 data capture points, for a total duration of
twenty minutes. Thereafter, the heating lamps were turned on and a minute allowed to elapse, then proceeded by starting
of the logging of data in the personaldaqview. This data was then saved upon the completion of the time step.
After the above step, the insulation to the base of the solar panel, which had been initially eliminated, was
replaced back, and data logging of a new set began within the computer software. The above step was repeated, i.e. the
recommended parameters for the experiment was set for twenty minutes, followed by turning on of the heating lamps for
a minute and finally,-logging of data in the personaldaqview. This second data as well was then saved upon the
completion of the time step. Of worth noting is that the rate of flow for the two procedures was maintained at four
minutes for every minute.
Subsequently, the rate of flow was changed from four litres for every minute, to two litres for every minute and
then the water flow allowed until equilibrium was attained. This was then proceeded by logging of data. The base of the
solar panel is eliminated, which was done consequently. the recommended parameters for the experiment was set for
twenty minutes, followed by turning on of the heating lamps for a minute and finally,-logging of data in the
personaldaqview. This third set of data as well was saved upon the completion of the time step.
Paraphrase This Document
Need a fresh take? Get an instant paraphrase of this document with our AI Paraphraser
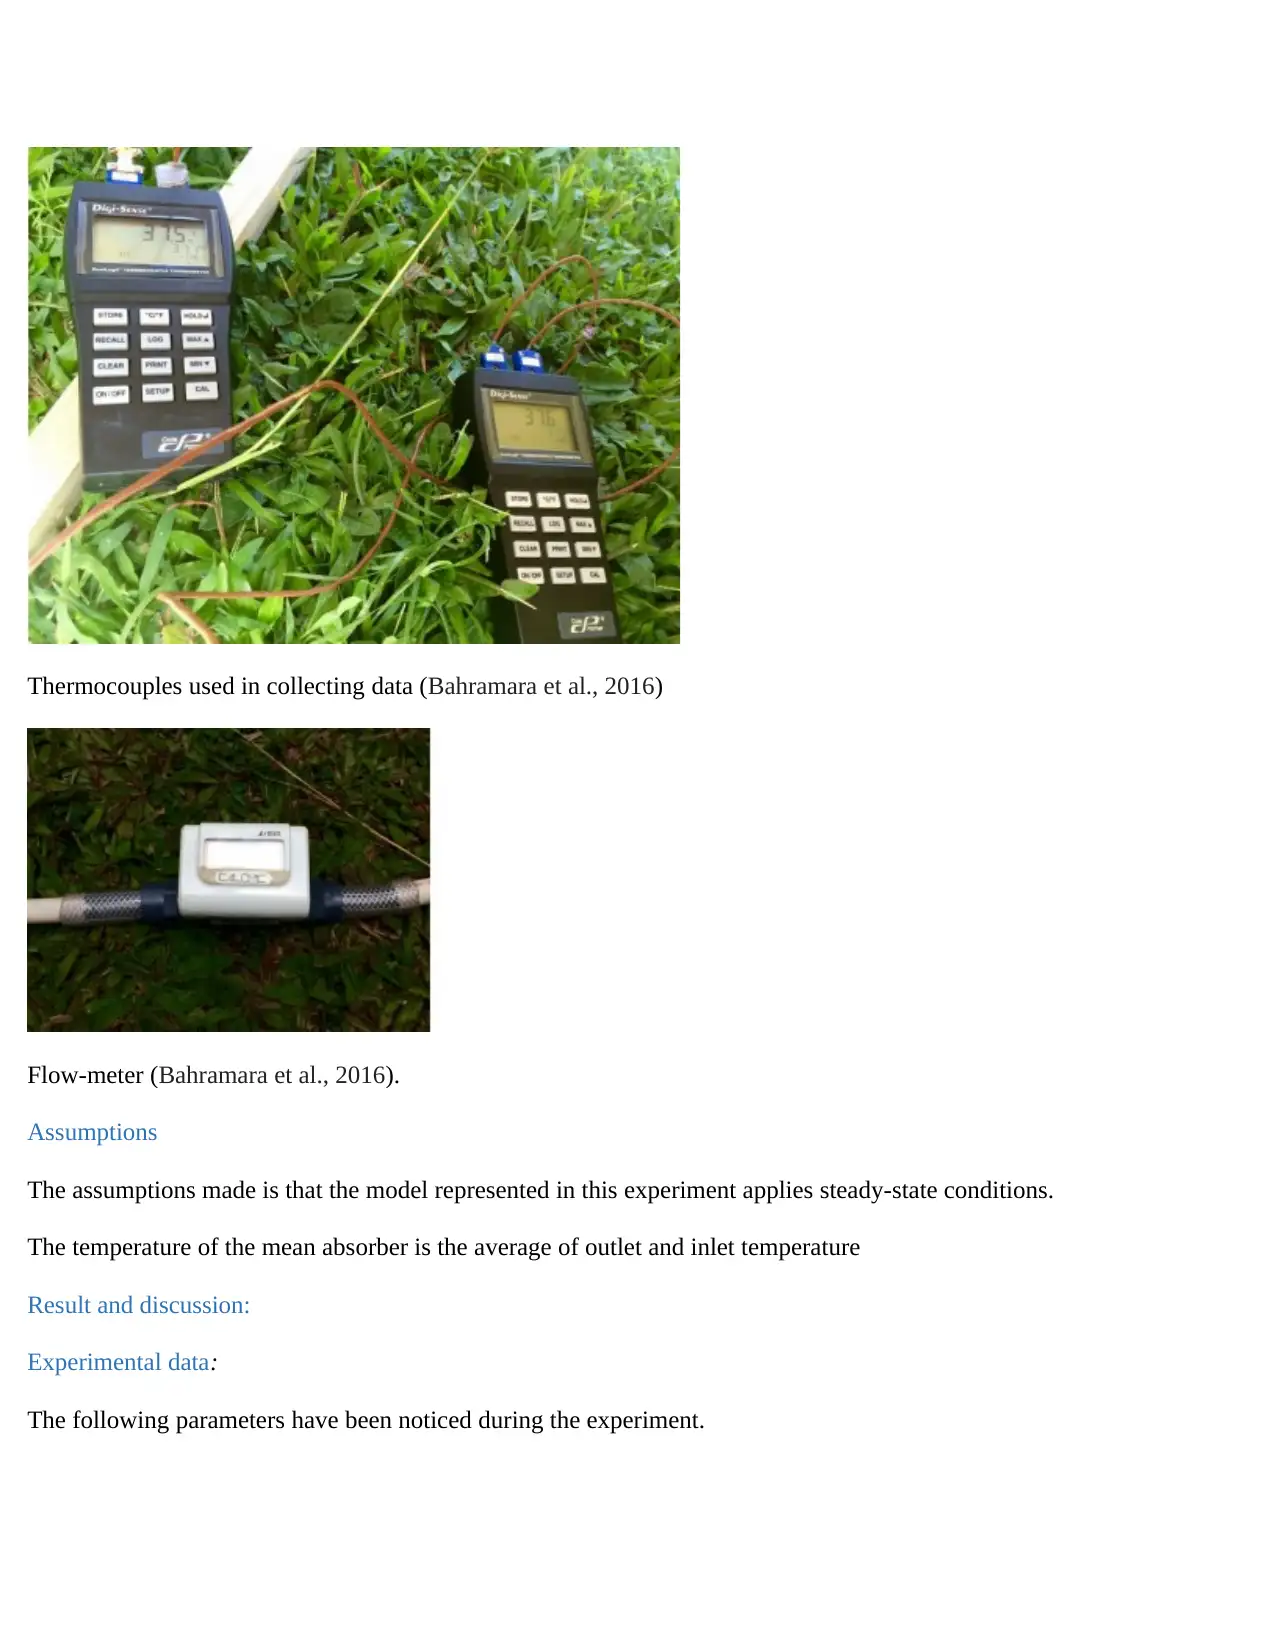
Thermocouples used in collecting data (Bahramara et al., 2016)
Flow-meter (Bahramara et al., 2016).
Assumptions
The assumptions made is that the model represented in this experiment applies steady-state conditions.
The temperature of the mean absorber is the average of outlet and inlet temperature
Result and discussion:
Experimental data:
The following parameters have been noticed during the experiment.
⊘ This is a preview!⊘
Do you want full access?
Subscribe today to unlock all pages.
Trusted by 1+ million students worldwide
1 out of 21

Your All-in-One AI-Powered Toolkit for Academic Success.
+13062052269
info@desklib.com
Available 24*7 on WhatsApp / Email
![[object Object]](/_next/static/media/star-bottom.7253800d.svg)
Unlock your academic potential
Copyright © 2020–2026 A2Z Services. All Rights Reserved. Developed and managed by ZUCOL.