SPSS Data Analysis Report
VerifiedAdded on 2020/02/05
|12
|1993
|234
Report
AI Summary
This SPSS report presents the analysis of three datasets. Question 1 investigates the impact of neuroticism, depression, and social support on anxiety levels in hospital patients using regression analysis. The results show a significant relationship between these variables and anxiety, with a higher R-squared value in the model including the independent variables. Question 2 examines the effects of alcohol consumption and sleep deprivation on cognitive performance using an independent samples t-test. The analysis reveals a significant difference in cognitive performance between alcohol consumers and non-consumers after 12 hours of sleep deprivation, but not after 4 hours. Question 3 compares relaxation levels achieved through breathing exercises, yoga, and lavender using a Tukey HSD post-hoc test. The results indicate no significant difference between breathing and yoga, but a significant difference between lavender and yoga.
SPSS
Paraphrase This Document
Need a fresh take? Get an instant paraphrase of this document with our AI Paraphraser
TABLE OF CONTENTS
Question 1........................................................................................................................................3
Description of data.......................................................................................................................3
Assumption of data......................................................................................................................3
Inferential statistical tests............................................................................................................3
Question 2........................................................................................................................................5
Description of data.......................................................................................................................5
Assumptions................................................................................................................................5
Inferential statistical tests............................................................................................................5
Question 3........................................................................................................................................6
Description of data.......................................................................................................................6
Assumptions................................................................................................................................6
Inferential statistical tests............................................................................................................6
APPENDIX......................................................................................................................................7
Question 1
Description of data
In the current data set some of the variables are studied namely neuroticism, depression,
transpose data of SSS, family and friends. There are no omitted values in the data set. Outliers
are not identified as there are not unusual trends in the data set. Initially, it is find out that mean
score of the transpose of family is (Mean=0.9094) with standard deviation of (STDEV=. 20943).
Big proportion of sample unit give same response on the asked question. However, mean value
in case of transpose data of friends is low and is equal to (Mean= 0.8809) whose standard
deviation is (STDEV= 0.22). Comparison of both indicate that there are some people who are or
not receiving proper support from their friends when they are in depression. In case of other
social support scales mean and standard deviation value is (Mean= 9.13) and 9 (STDEV= 4.72).
It is ensued that considerable difference exist in case of respondents response in case of other
social setting and friends in respect impact of same on depression.
Assumption of data
It is assumed that data is not normally distributed and in order to make it normal Log
function of SPSS is applied on the relevant set of figures.
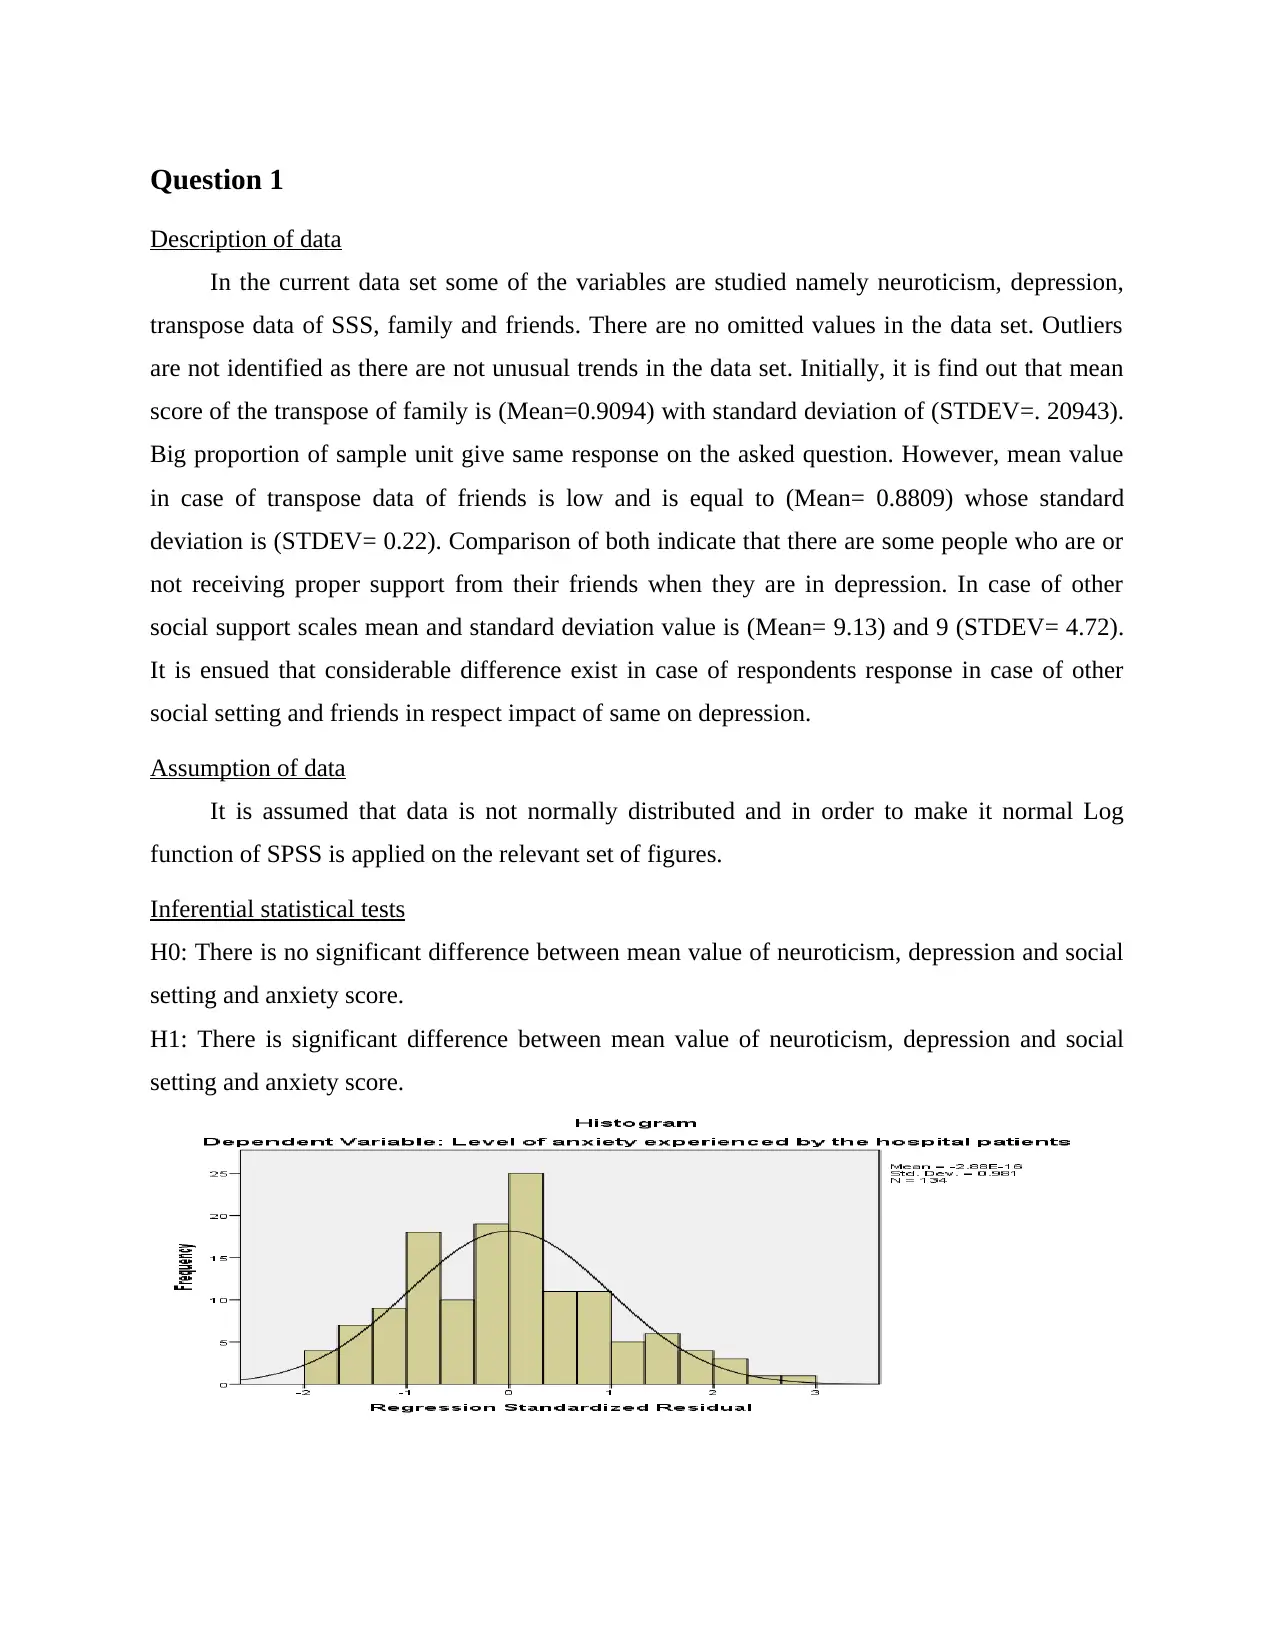
Inferential statistical tests
H0: There is no significant difference between mean value of neuroticism, depression and social
setting and anxiety score.
H1: There is significant difference between mean value of neuroticism, depression and social
setting and anxiety score.
Description of data
In the current data set some of the variables are studied namely neuroticism, depression,
transpose data of SSS, family and friends. There are no omitted values in the data set. Outliers
are not identified as there are not unusual trends in the data set. Initially, it is find out that mean
score of the transpose of family is (Mean=0.9094) with standard deviation of (STDEV=. 20943).
Big proportion of sample unit give same response on the asked question. However, mean value
in case of transpose data of friends is low and is equal to (Mean= 0.8809) whose standard
deviation is (STDEV= 0.22). Comparison of both indicate that there are some people who are or
not receiving proper support from their friends when they are in depression. In case of other
social support scales mean and standard deviation value is (Mean= 9.13) and 9 (STDEV= 4.72).
It is ensued that considerable difference exist in case of respondents response in case of other
social setting and friends in respect impact of same on depression.
Assumption of data
It is assumed that data is not normally distributed and in order to make it normal Log
function of SPSS is applied on the relevant set of figures.
Inferential statistical tests
H0: There is no significant difference between mean value of neuroticism, depression and social
setting and anxiety score.
H1: There is significant difference between mean value of neuroticism, depression and social
setting and anxiety score.
⊘ This is a preview!⊘
Do you want full access?
Subscribe today to unlock all pages.
Trusted by 1+ million students worldwide
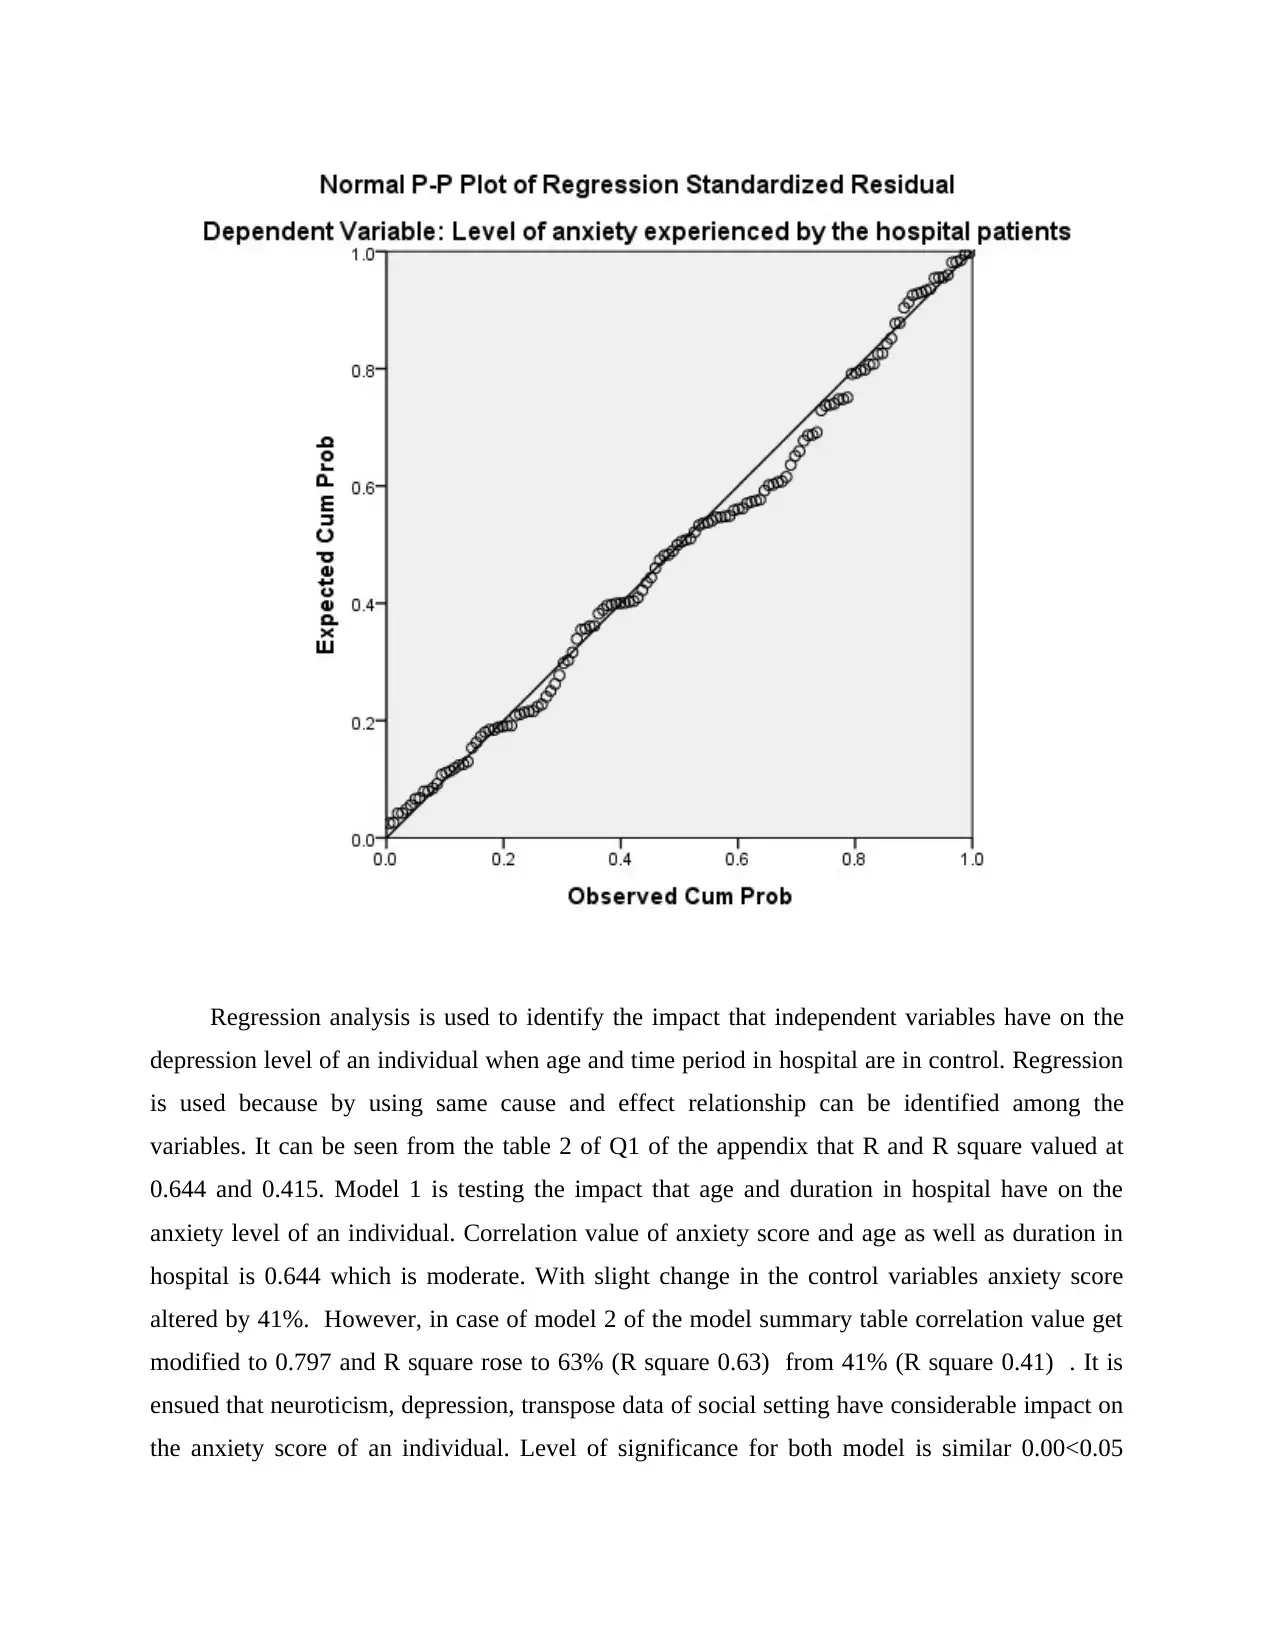
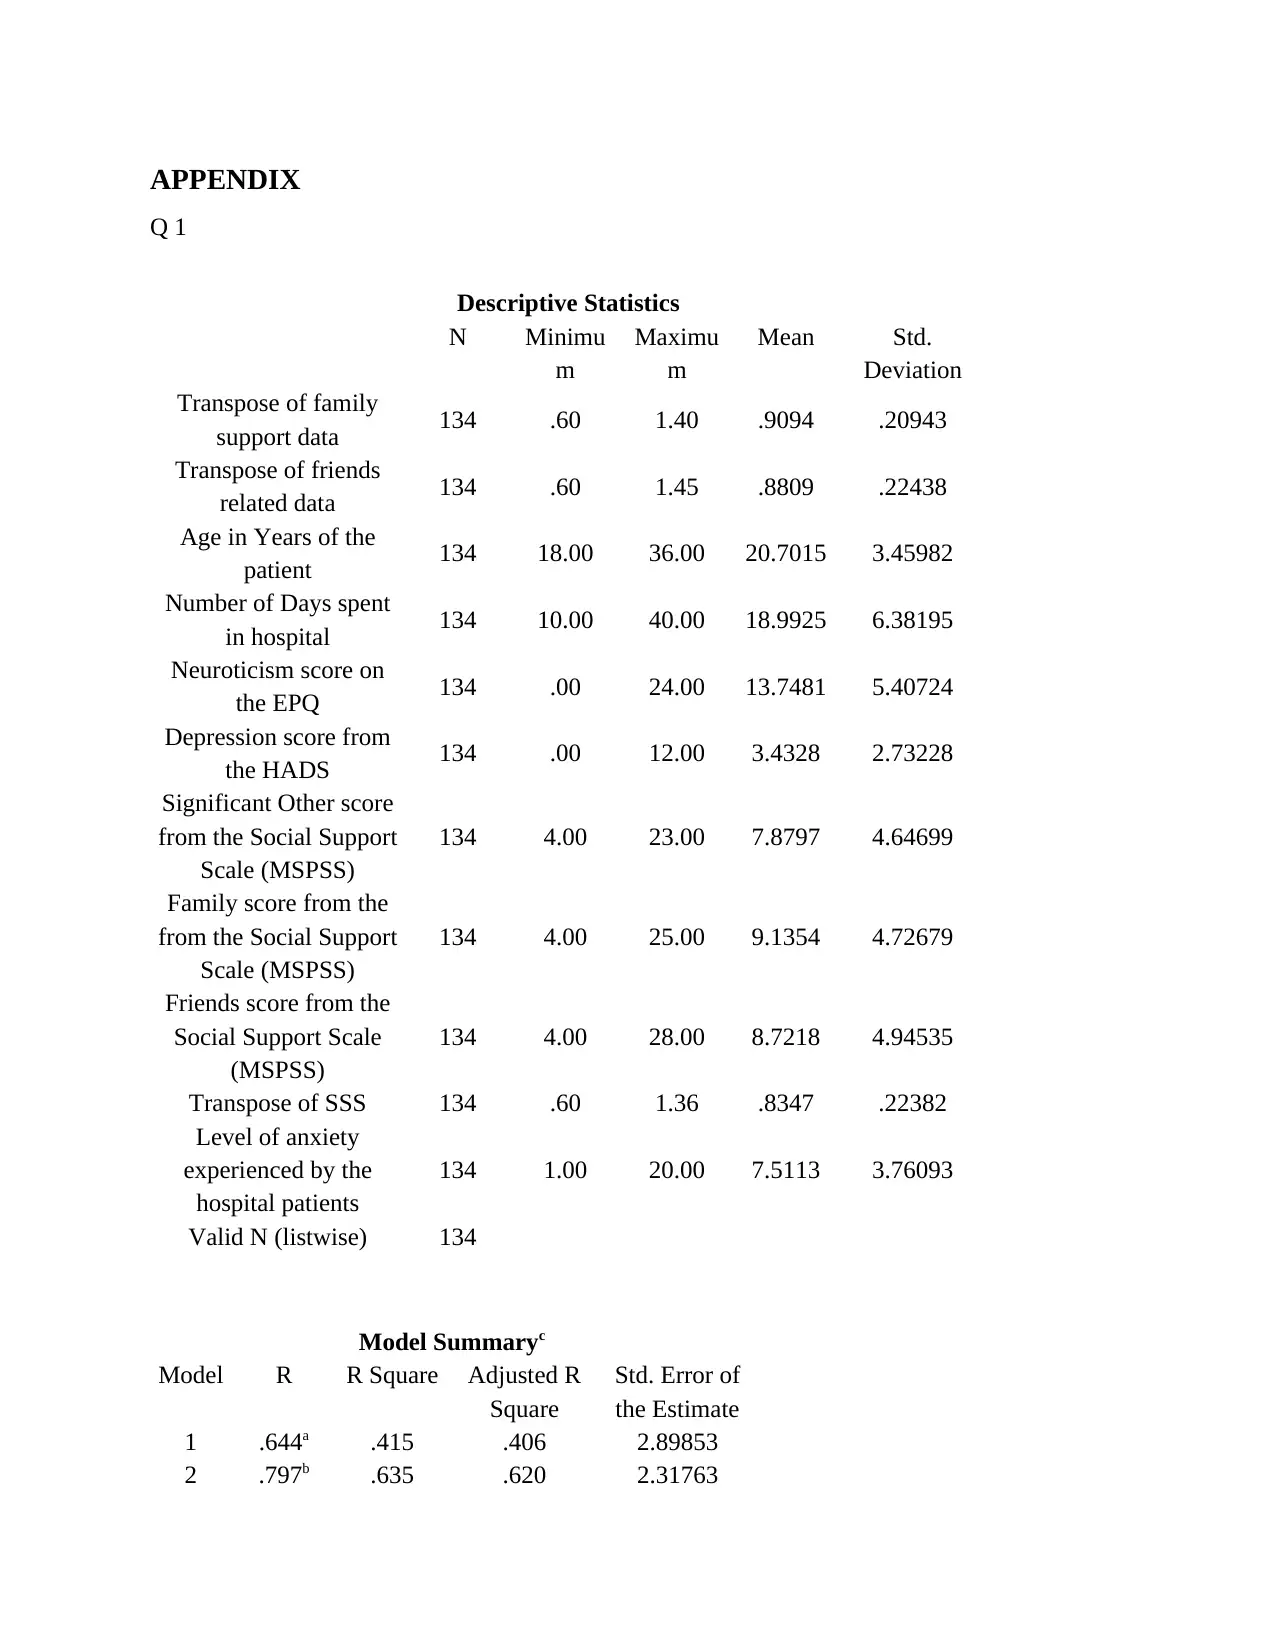
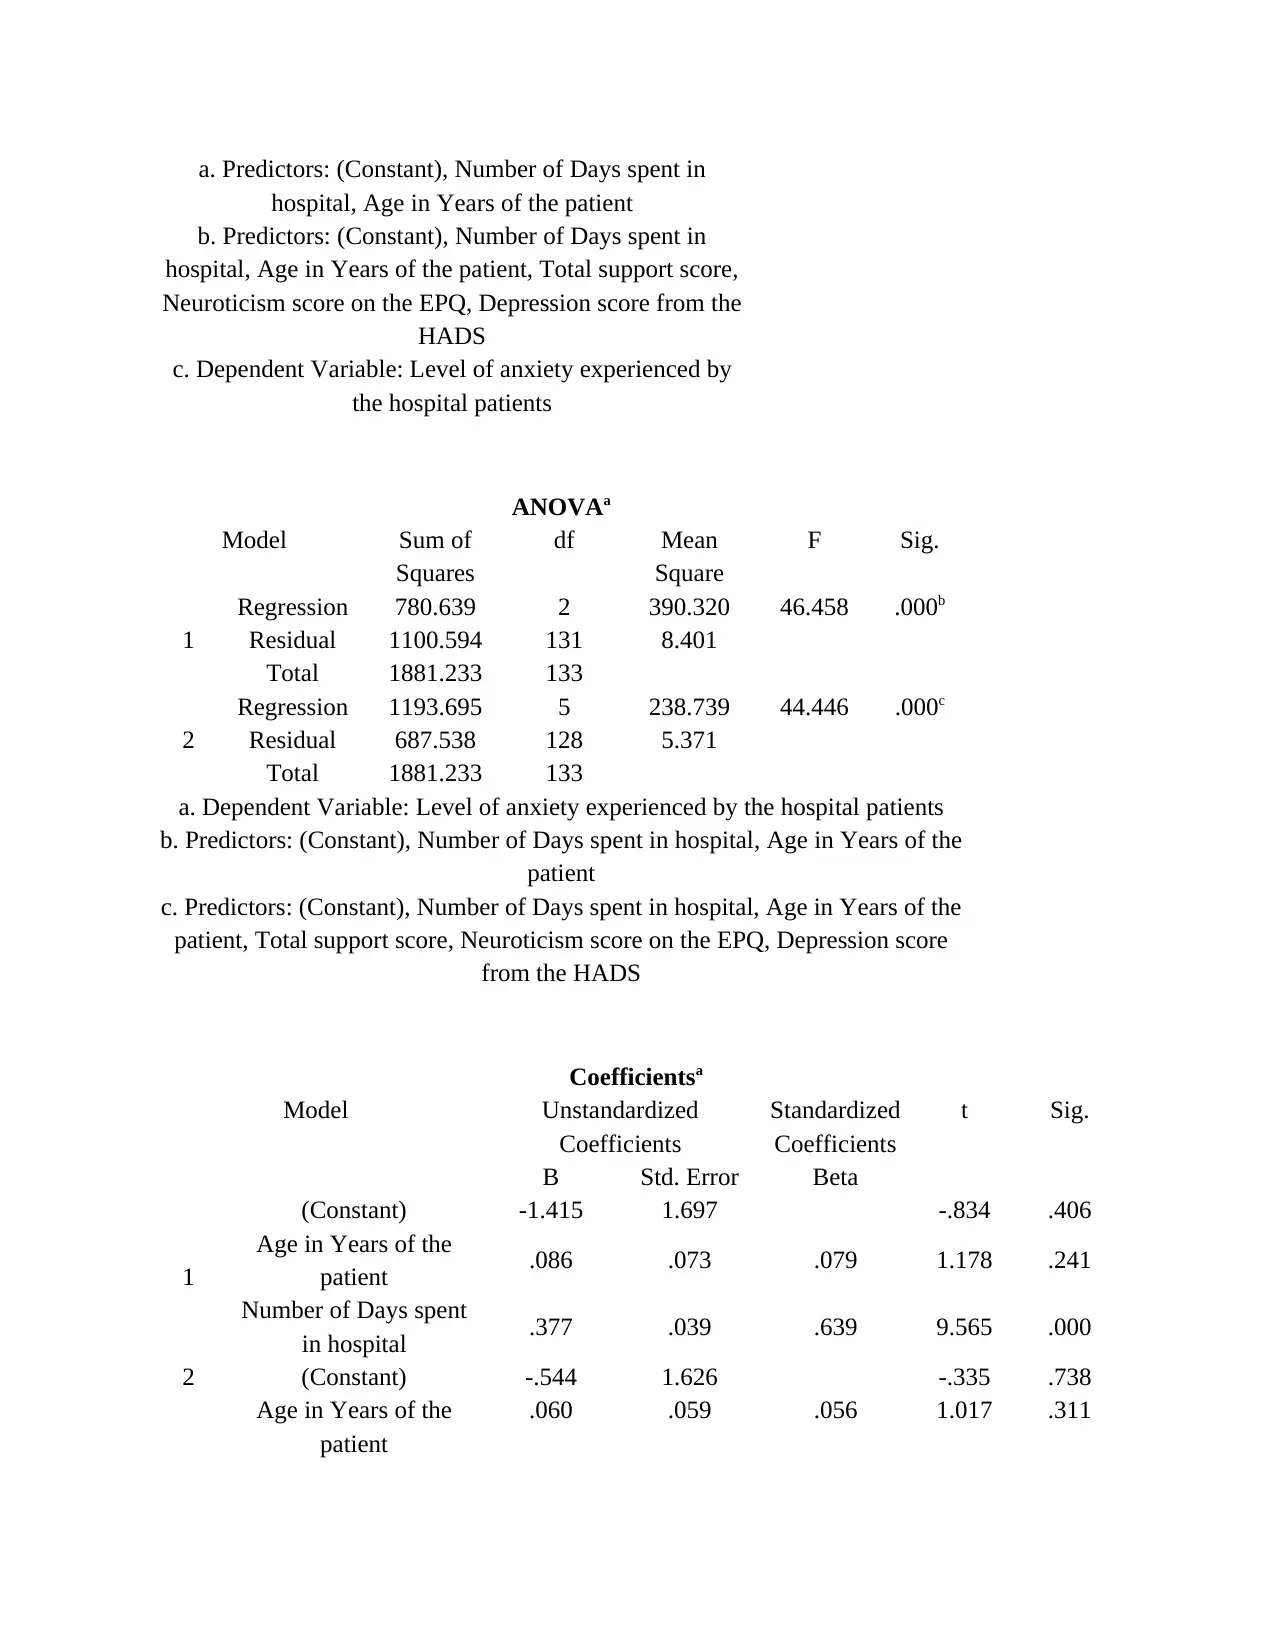
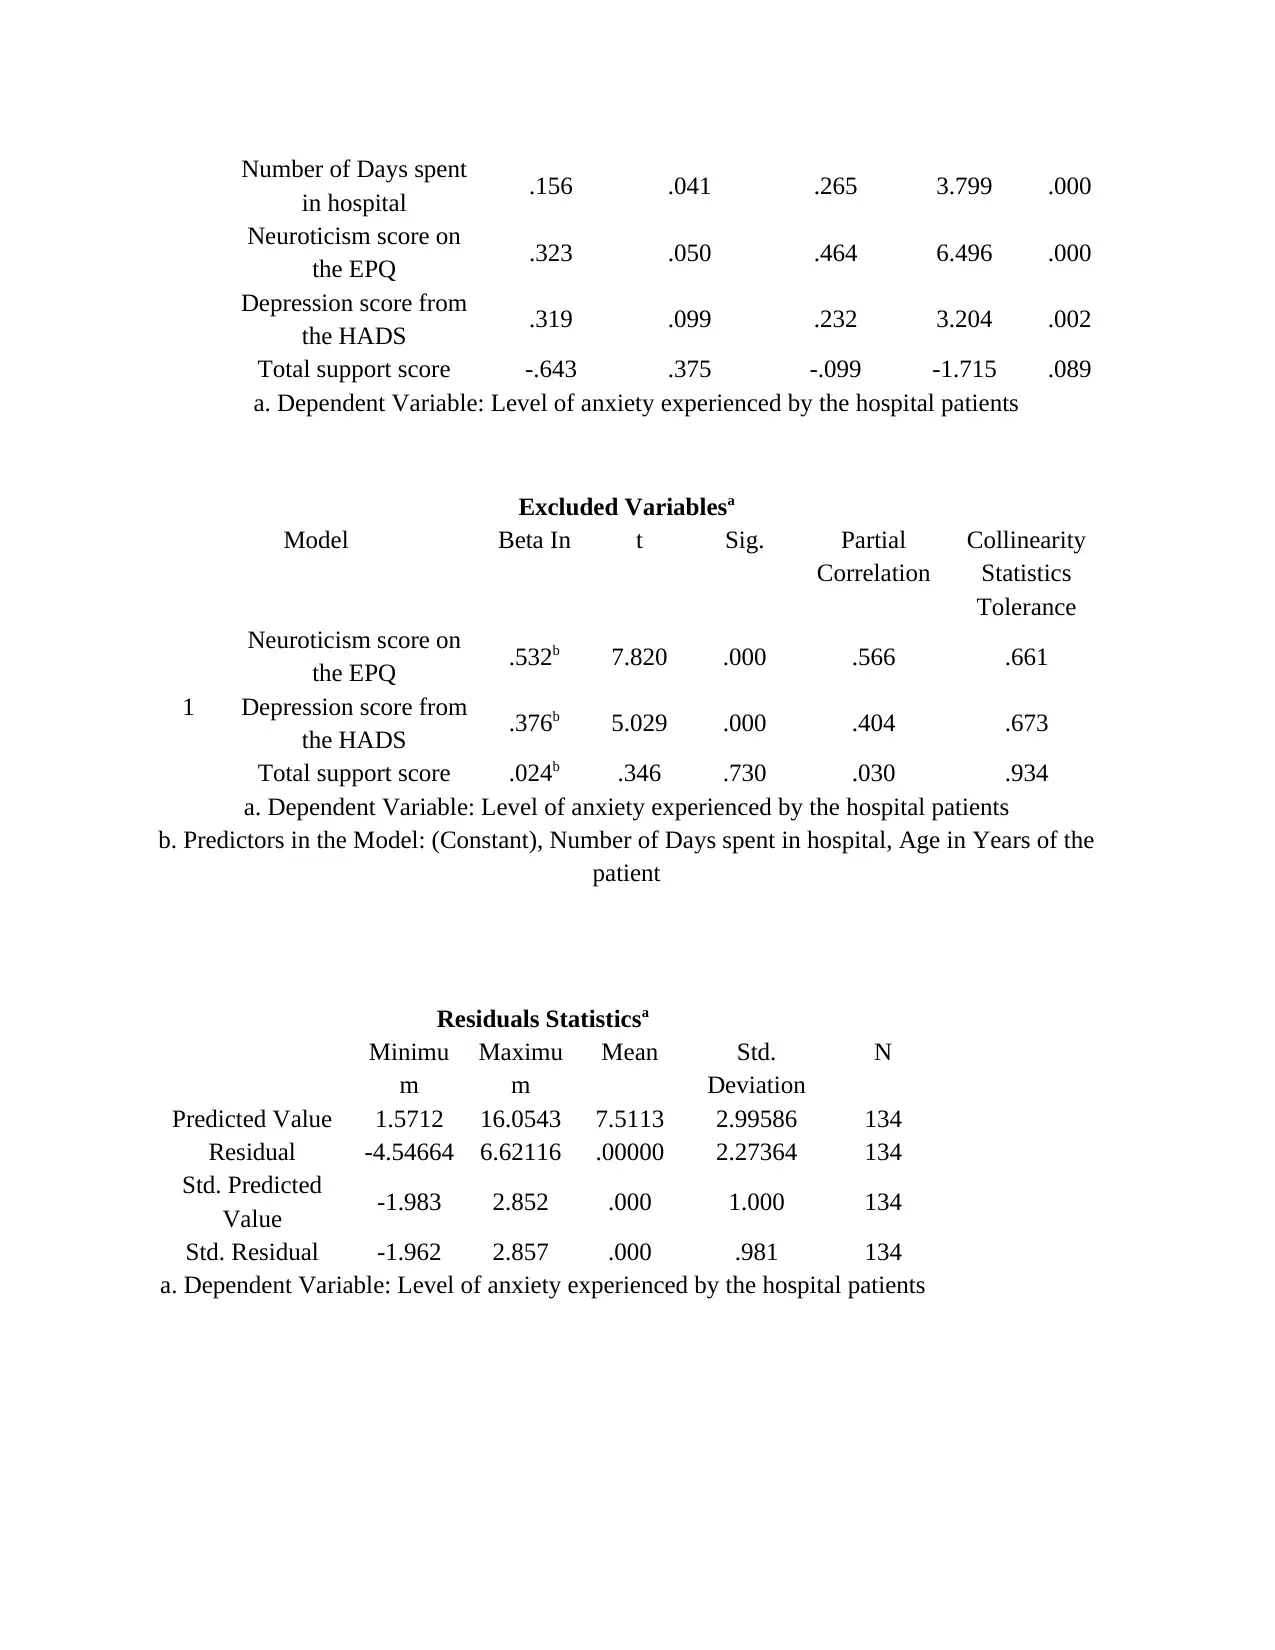
Regression analysis is used to identify the impact that independent variables have on the
depression level of an individual when age and time period in hospital are in control. Regression
is used because by using same cause and effect relationship can be identified among the
variables. It can be seen from the table 2 of Q1 of the appendix that R and R square valued at
0.644 and 0.415. Model 1 is testing the impact that age and duration in hospital have on the
anxiety level of an individual. Correlation value of anxiety score and age as well as duration in
hospital is 0.644 which is moderate. With slight change in the control variables anxiety score
altered by 41%. However, in case of model 2 of the model summary table correlation value get
modified to 0.797 and R square rose to 63% (R square 0.63) from 41% (R square 0.41) . It is
ensued that neuroticism, depression, transpose data of social setting have considerable impact on
the anxiety score of an individual. Level of significance for both model is similar 0.00<0.05
Paraphrase This Document
Need a fresh take? Get an instant paraphrase of this document with our AI Paraphraser
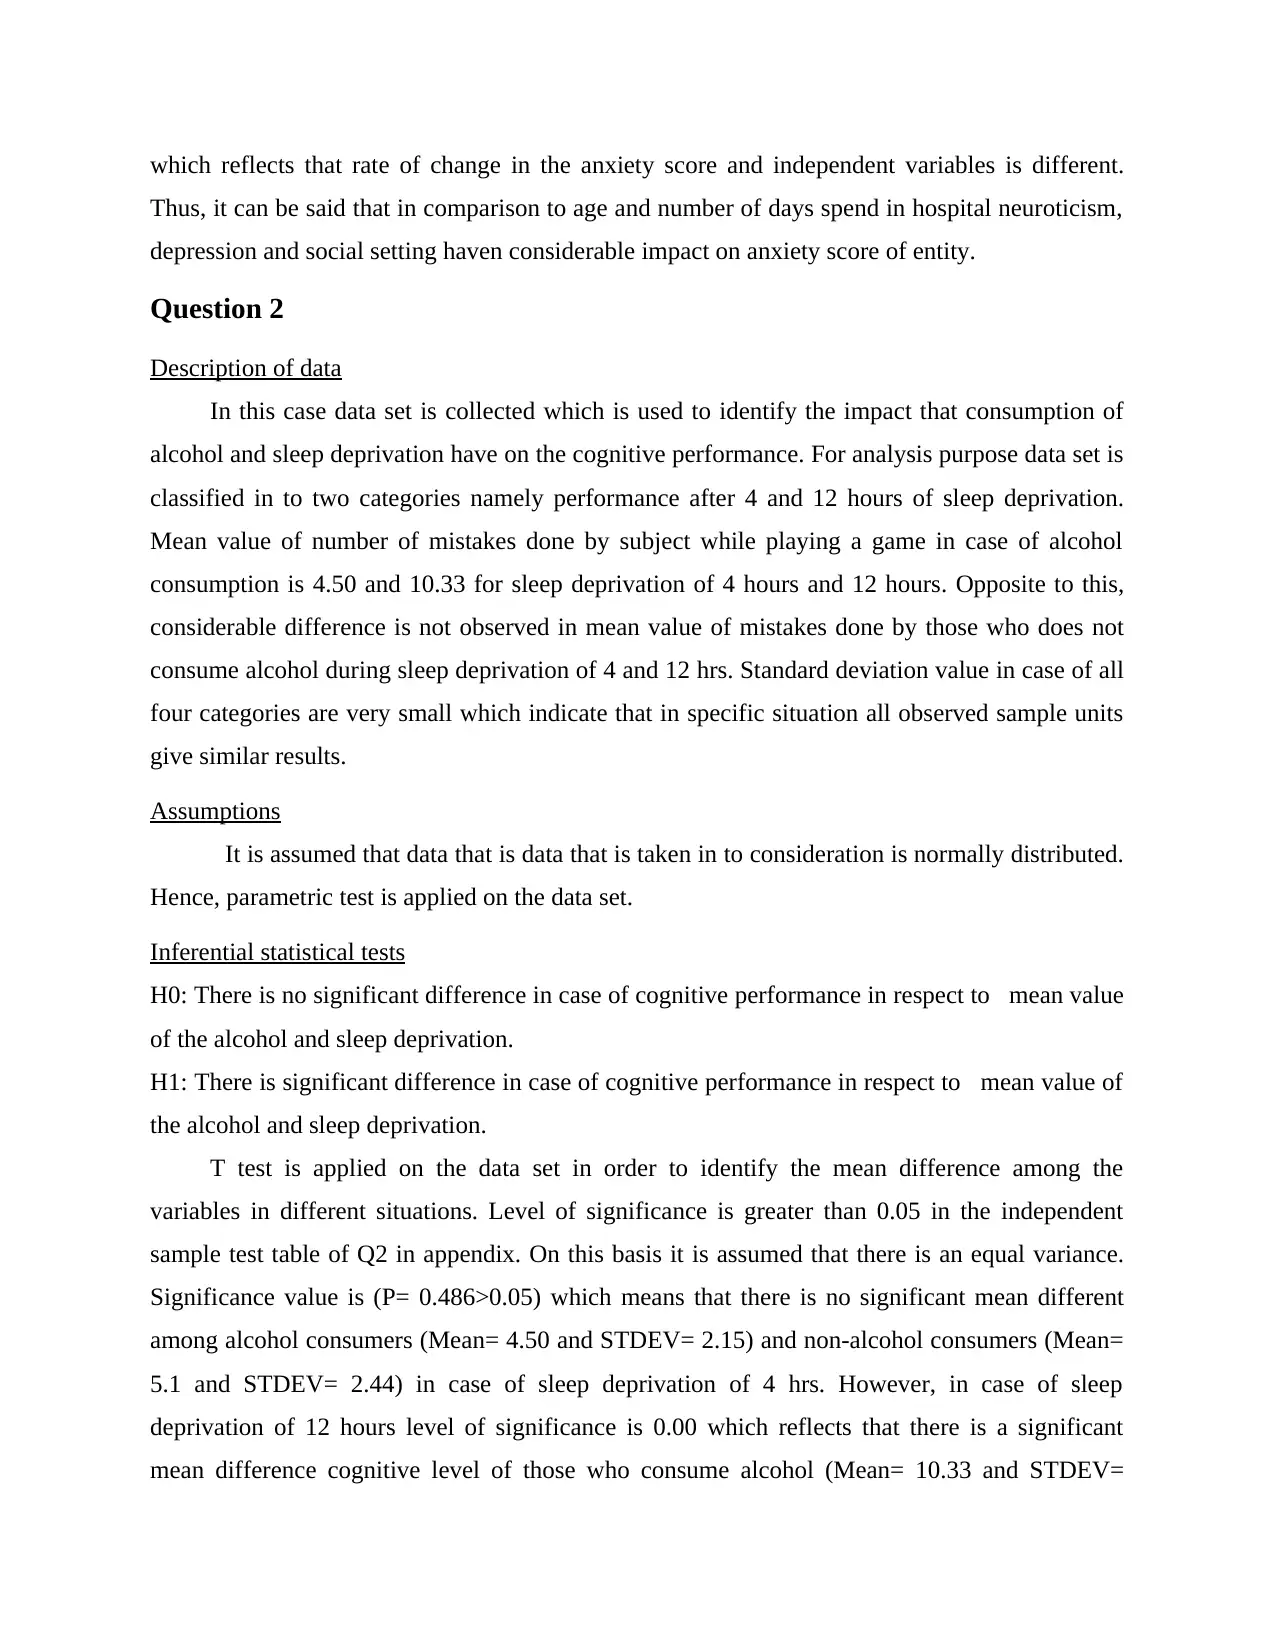
which reflects that rate of change in the anxiety score and independent variables is different.
Thus, it can be said that in comparison to age and number of days spend in hospital neuroticism,
depression and social setting haven considerable impact on anxiety score of entity.
Question 2
Description of data
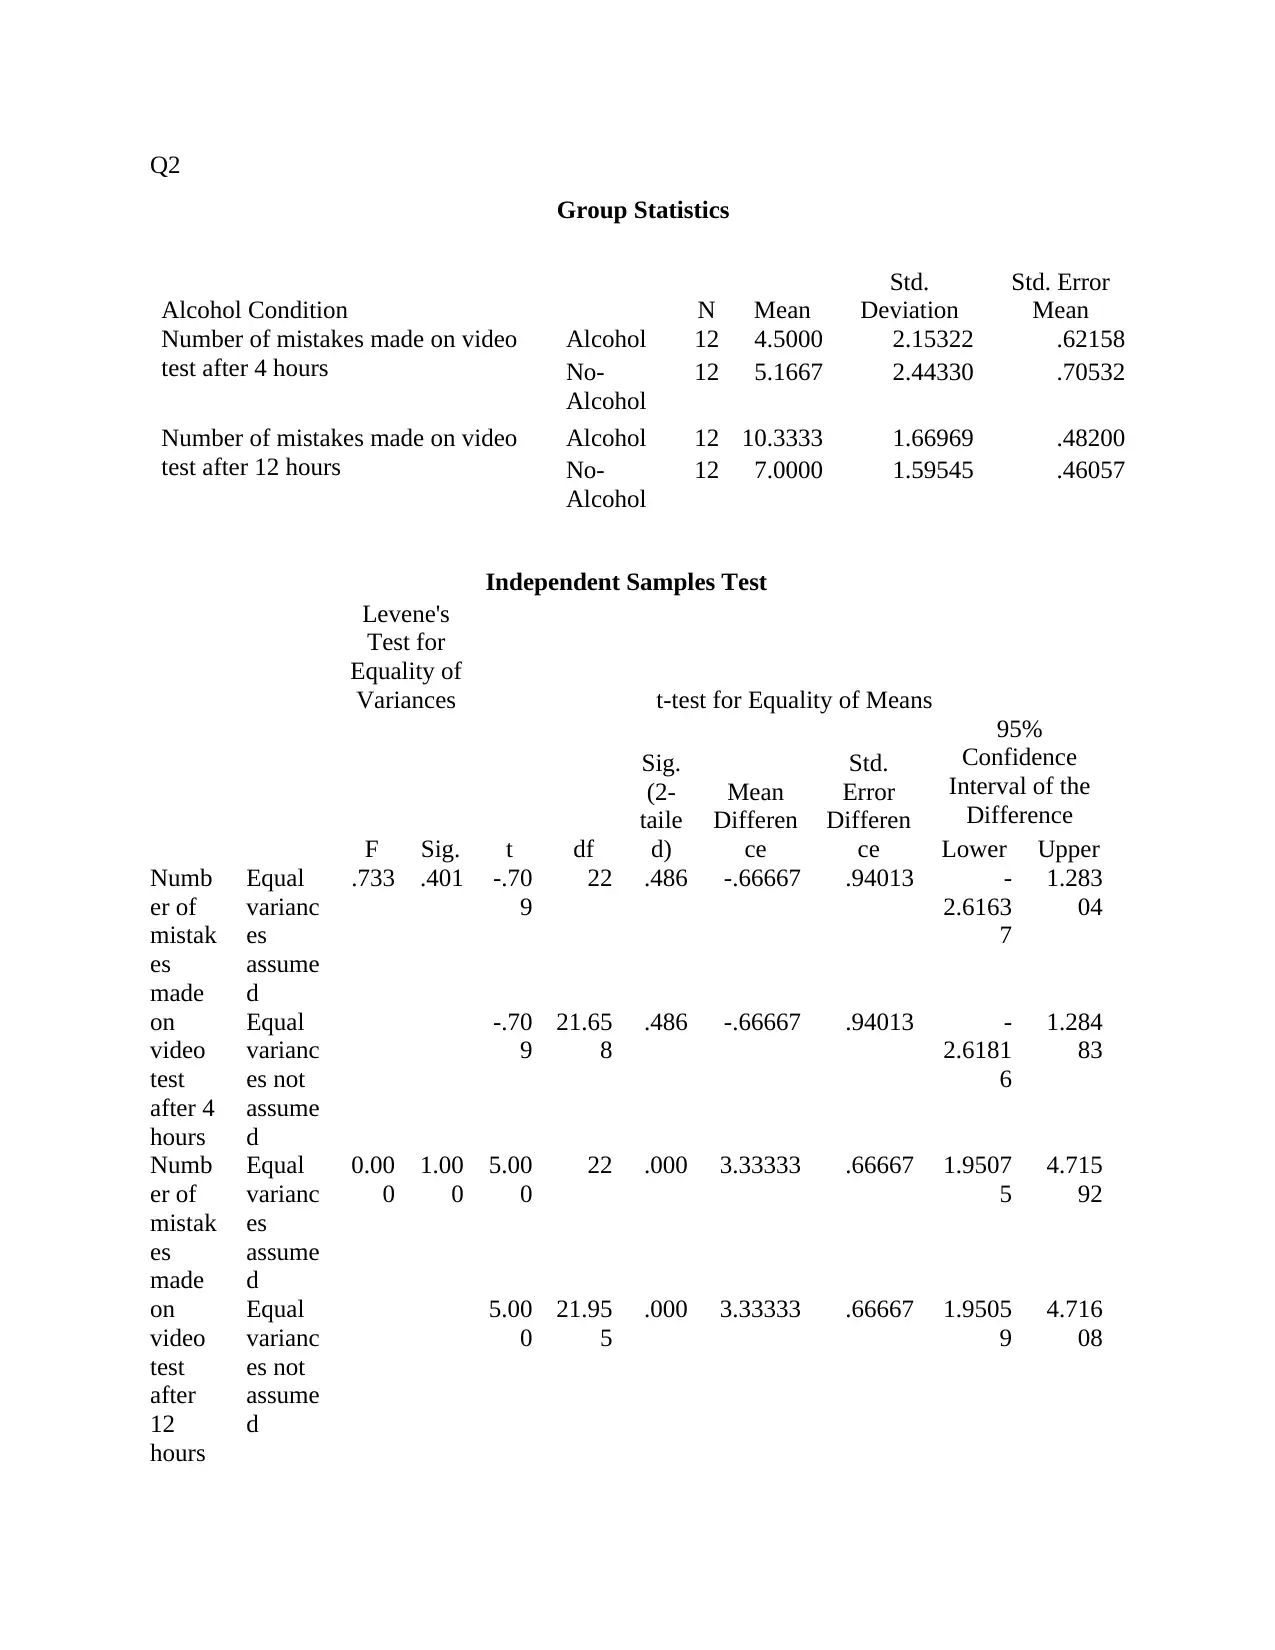
In this case data set is collected which is used to identify the impact that consumption of
alcohol and sleep deprivation have on the cognitive performance. For analysis purpose data set is
classified in to two categories namely performance after 4 and 12 hours of sleep deprivation.
Mean value of number of mistakes done by subject while playing a game in case of alcohol
consumption is 4.50 and 10.33 for sleep deprivation of 4 hours and 12 hours. Opposite to this,
considerable difference is not observed in mean value of mistakes done by those who does not
consume alcohol during sleep deprivation of 4 and 12 hrs. Standard deviation value in case of all
four categories are very small which indicate that in specific situation all observed sample units
give similar results.
Assumptions
It is assumed that data that is data that is taken in to consideration is normally distributed.
Hence, parametric test is applied on the data set.
Inferential statistical tests
H0: There is no significant difference in case of cognitive performance in respect to mean value
of the alcohol and sleep deprivation.
H1: There is significant difference in case of cognitive performance in respect to mean value of
the alcohol and sleep deprivation.
T test is applied on the data set in order to identify the mean difference among the
variables in different situations. Level of significance is greater than 0.05 in the independent
sample test table of Q2 in appendix. On this basis it is assumed that there is an equal variance.
Significance value is (P= 0.486>0.05) which means that there is no significant mean different
among alcohol consumers (Mean= 4.50 and STDEV= 2.15) and non-alcohol consumers (Mean=
5.1 and STDEV= 2.44) in case of sleep deprivation of 4 hrs. However, in case of sleep
deprivation of 12 hours level of significance is 0.00 which reflects that there is a significant
mean difference cognitive level of those who consume alcohol (Mean= 10.33 and STDEV=
Thus, it can be said that in comparison to age and number of days spend in hospital neuroticism,
depression and social setting haven considerable impact on anxiety score of entity.
Question 2
Description of data
In this case data set is collected which is used to identify the impact that consumption of
alcohol and sleep deprivation have on the cognitive performance. For analysis purpose data set is
classified in to two categories namely performance after 4 and 12 hours of sleep deprivation.
Mean value of number of mistakes done by subject while playing a game in case of alcohol
consumption is 4.50 and 10.33 for sleep deprivation of 4 hours and 12 hours. Opposite to this,
considerable difference is not observed in mean value of mistakes done by those who does not
consume alcohol during sleep deprivation of 4 and 12 hrs. Standard deviation value in case of all
four categories are very small which indicate that in specific situation all observed sample units
give similar results.
Assumptions
It is assumed that data that is data that is taken in to consideration is normally distributed.
Hence, parametric test is applied on the data set.
Inferential statistical tests
H0: There is no significant difference in case of cognitive performance in respect to mean value
of the alcohol and sleep deprivation.
H1: There is significant difference in case of cognitive performance in respect to mean value of
the alcohol and sleep deprivation.
T test is applied on the data set in order to identify the mean difference among the
variables in different situations. Level of significance is greater than 0.05 in the independent
sample test table of Q2 in appendix. On this basis it is assumed that there is an equal variance.
Significance value is (P= 0.486>0.05) which means that there is no significant mean different
among alcohol consumers (Mean= 4.50 and STDEV= 2.15) and non-alcohol consumers (Mean=
5.1 and STDEV= 2.44) in case of sleep deprivation of 4 hrs. However, in case of sleep
deprivation of 12 hours level of significance is 0.00 which reflects that there is a significant
mean difference cognitive level of those who consume alcohol (Mean= 10.33 and STDEV=
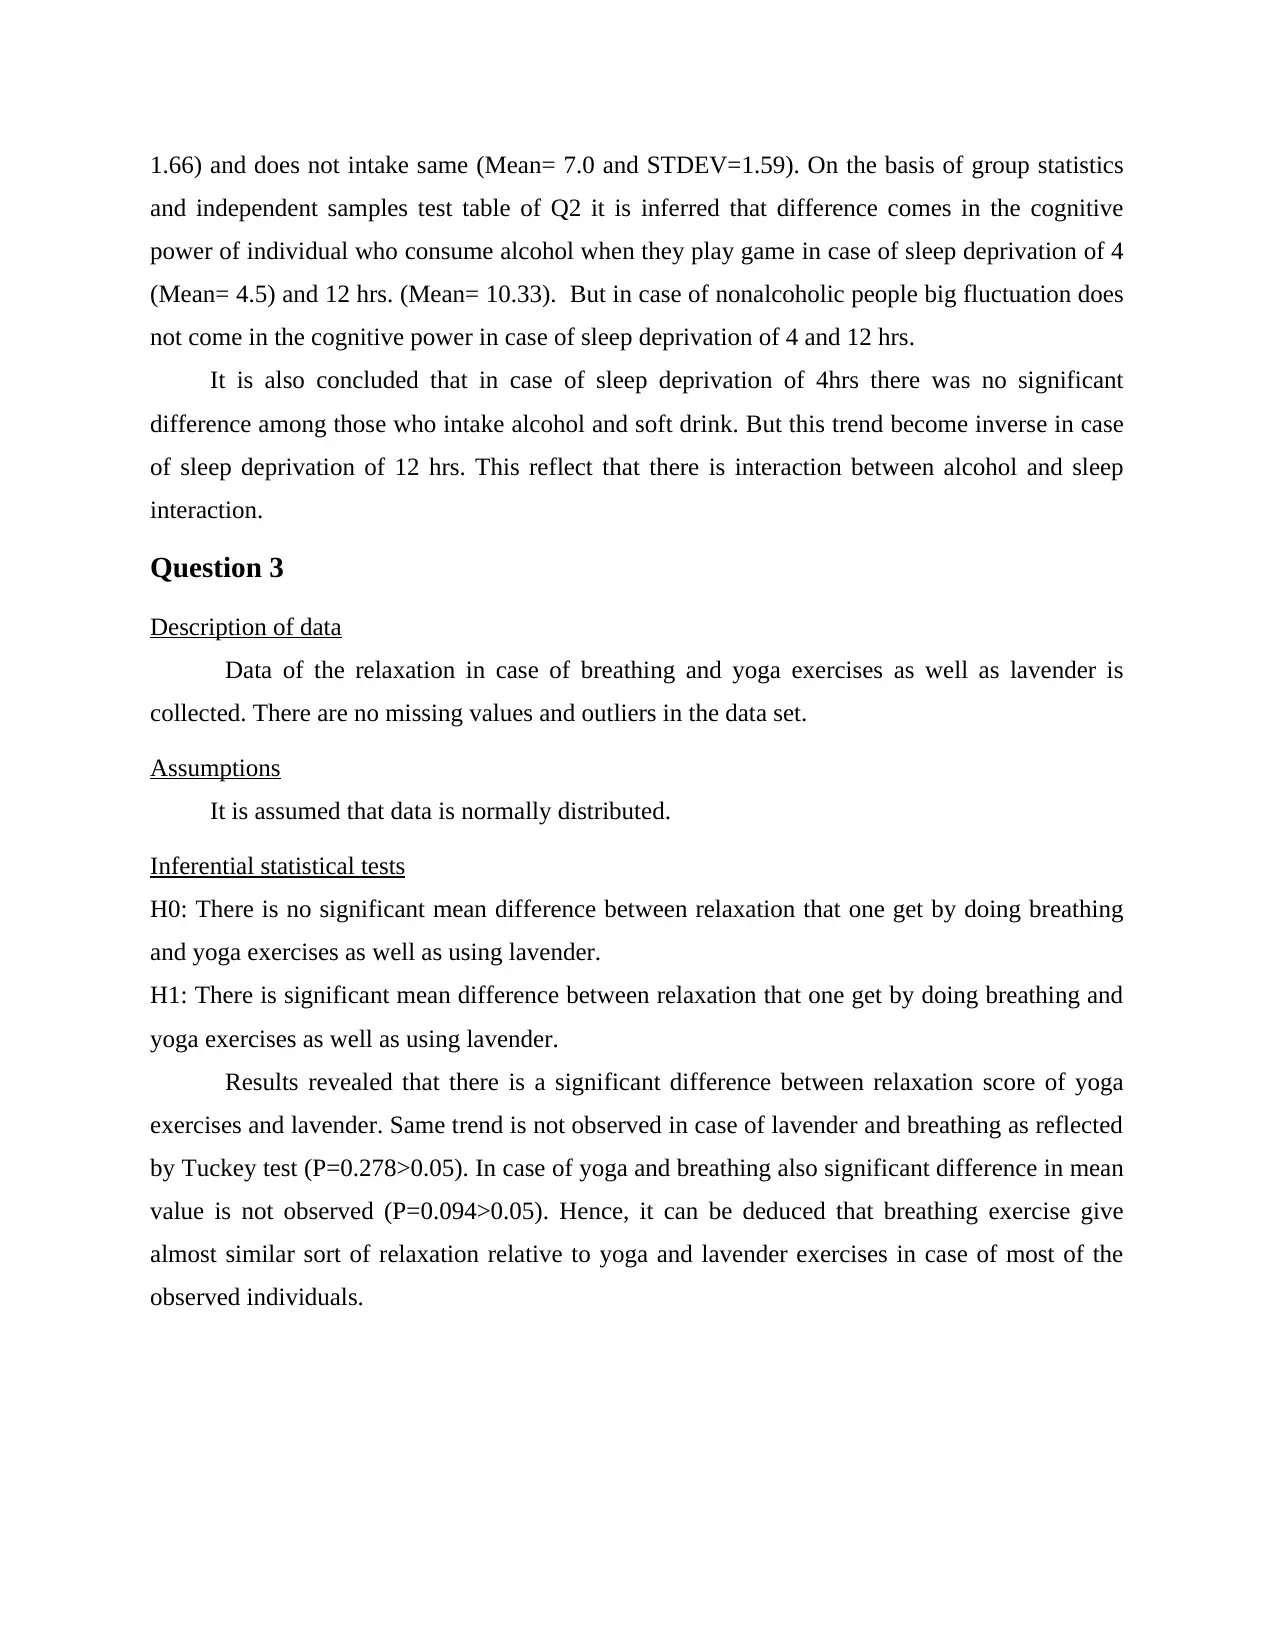
1.66) and does not intake same (Mean= 7.0 and STDEV=1.59). On the basis of group statistics
and independent samples test table of Q2 it is inferred that difference comes in the cognitive
power of individual who consume alcohol when they play game in case of sleep deprivation of 4
(Mean= 4.5) and 12 hrs. (Mean= 10.33). But in case of nonalcoholic people big fluctuation does
not come in the cognitive power in case of sleep deprivation of 4 and 12 hrs.
It is also concluded that in case of sleep deprivation of 4hrs there was no significant
difference among those who intake alcohol and soft drink. But this trend become inverse in case
of sleep deprivation of 12 hrs. This reflect that there is interaction between alcohol and sleep
interaction.
Question 3
Description of data
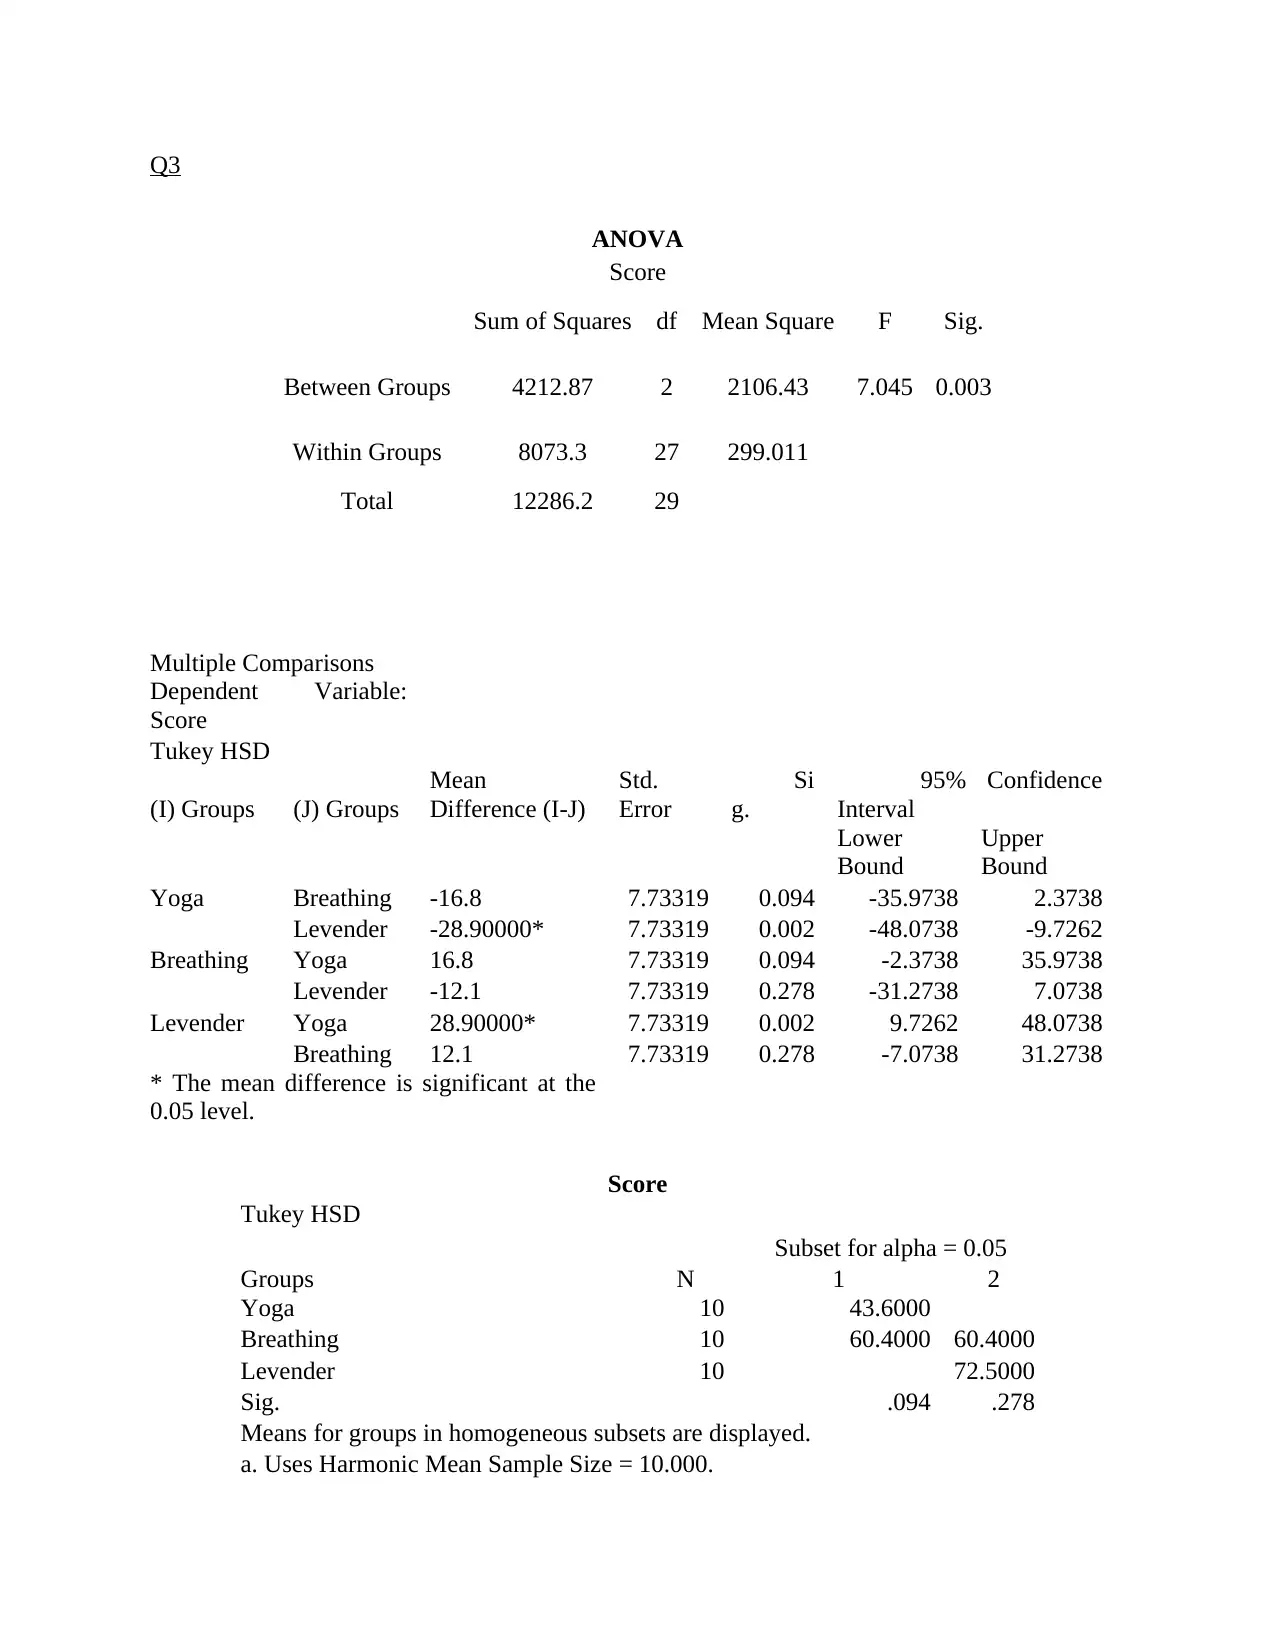
Data of the relaxation in case of breathing and yoga exercises as well as lavender is
collected. There are no missing values and outliers in the data set.
Assumptions
It is assumed that data is normally distributed.
Inferential statistical tests
H0: There is no significant mean difference between relaxation that one get by doing breathing
and yoga exercises as well as using lavender.
H1: There is significant mean difference between relaxation that one get by doing breathing and
yoga exercises as well as using lavender.
Results revealed that there is a significant difference between relaxation score of yoga
exercises and lavender. Same trend is not observed in case of lavender and breathing as reflected
by Tuckey test (P=0.278>0.05). In case of yoga and breathing also significant difference in mean
value is not observed (P=0.094>0.05). Hence, it can be deduced that breathing exercise give
almost similar sort of relaxation relative to yoga and lavender exercises in case of most of the
observed individuals.
and independent samples test table of Q2 it is inferred that difference comes in the cognitive
power of individual who consume alcohol when they play game in case of sleep deprivation of 4
(Mean= 4.5) and 12 hrs. (Mean= 10.33). But in case of nonalcoholic people big fluctuation does
not come in the cognitive power in case of sleep deprivation of 4 and 12 hrs.
It is also concluded that in case of sleep deprivation of 4hrs there was no significant
difference among those who intake alcohol and soft drink. But this trend become inverse in case
of sleep deprivation of 12 hrs. This reflect that there is interaction between alcohol and sleep
interaction.
Question 3
Description of data
Data of the relaxation in case of breathing and yoga exercises as well as lavender is
collected. There are no missing values and outliers in the data set.
Assumptions
It is assumed that data is normally distributed.
Inferential statistical tests
H0: There is no significant mean difference between relaxation that one get by doing breathing
and yoga exercises as well as using lavender.
H1: There is significant mean difference between relaxation that one get by doing breathing and
yoga exercises as well as using lavender.
Results revealed that there is a significant difference between relaxation score of yoga
exercises and lavender. Same trend is not observed in case of lavender and breathing as reflected
by Tuckey test (P=0.278>0.05). In case of yoga and breathing also significant difference in mean
value is not observed (P=0.094>0.05). Hence, it can be deduced that breathing exercise give
almost similar sort of relaxation relative to yoga and lavender exercises in case of most of the
observed individuals.
⊘ This is a preview!⊘
Do you want full access?
Subscribe today to unlock all pages.
Trusted by 1+ million students worldwide
APPENDIX
Q 1
Descriptive Statistics
N Minimu
m
Maximu
m
Mean Std.
Deviation
Transpose of family
support data 134 .60 1.40 .9094 .20943
Transpose of friends
related data 134 .60 1.45 .8809 .22438
Age in Years of the
patient 134 18.00 36.00 20.7015 3.45982
Number of Days spent
in hospital 134 10.00 40.00 18.9925 6.38195
Neuroticism score on
the EPQ 134 .00 24.00 13.7481 5.40724
Depression score from
the HADS 134 .00 12.00 3.4328 2.73228
Significant Other score
from the Social Support
Scale (MSPSS)
134 4.00 23.00 7.8797 4.64699
Family score from the
from the Social Support
Scale (MSPSS)
134 4.00 25.00 9.1354 4.72679
Friends score from the
Social Support Scale
(MSPSS)
134 4.00 28.00 8.7218 4.94535
Transpose of SSS 134 .60 1.36 .8347 .22382
Level of anxiety
experienced by the
hospital patients
134 1.00 20.00 7.5113 3.76093
Valid N (listwise) 134
Model Summaryc
Model R R Square Adjusted R
Square
Std. Error of
the Estimate
1 .644a .415 .406 2.89853
2 .797b .635 .620 2.31763
Paraphrase This Document
Need a fresh take? Get an instant paraphrase of this document with our AI Paraphraser
a. Predictors: (Constant), Number of Days spent in
hospital, Age in Years of the patient
b. Predictors: (Constant), Number of Days spent in
hospital, Age in Years of the patient, Total support score,
Neuroticism score on the EPQ, Depression score from the
HADS
c. Dependent Variable: Level of anxiety experienced by
the hospital patients
ANOVAa
Model Sum of
Squares
df Mean
Square
F Sig.
1
Regression 780.639 2 390.320 46.458 .000b
Residual 1100.594 131 8.401
Total 1881.233 133
2
Regression 1193.695 5 238.739 44.446 .000c
Residual 687.538 128 5.371
Total 1881.233 133
a. Dependent Variable: Level of anxiety experienced by the hospital patients
b. Predictors: (Constant), Number of Days spent in hospital, Age in Years of the
patient
c. Predictors: (Constant), Number of Days spent in hospital, Age in Years of the
patient, Total support score, Neuroticism score on the EPQ, Depression score
from the HADS
Coefficientsa
Model Unstandardized
Coefficients
Standardized
Coefficients
t Sig.
B Std. Error Beta
1
(Constant) -1.415 1.697 -.834 .406
Age in Years of the
patient .086 .073 .079 1.178 .241
Number of Days spent
in hospital .377 .039 .639 9.565 .000
2 (Constant) -.544 1.626 -.335 .738
Age in Years of the
patient
.060 .059 .056 1.017 .311
Number of Days spent
in hospital .156 .041 .265 3.799 .000
Neuroticism score on
the EPQ .323 .050 .464 6.496 .000
Depression score from
the HADS .319 .099 .232 3.204 .002
Total support score -.643 .375 -.099 -1.715 .089
a. Dependent Variable: Level of anxiety experienced by the hospital patients
Excluded Variablesa
Model Beta In t Sig. Partial
Correlation
Collinearity
Statistics
Tolerance
1
Neuroticism score on
the EPQ .532b 7.820 .000 .566 .661
Depression score from
the HADS .376b 5.029 .000 .404 .673
Total support score .024b .346 .730 .030 .934
a. Dependent Variable: Level of anxiety experienced by the hospital patients
b. Predictors in the Model: (Constant), Number of Days spent in hospital, Age in Years of the
patient
Residuals Statisticsa
Minimu
m
Maximu
m
Mean Std.
Deviation
N
Predicted Value 1.5712 16.0543 7.5113 2.99586 134
Residual -4.54664 6.62116 .00000 2.27364 134
Std. Predicted
Value -1.983 2.852 .000 1.000 134
Std. Residual -1.962 2.857 .000 .981 134
a. Dependent Variable: Level of anxiety experienced by the hospital patients
⊘ This is a preview!⊘
Do you want full access?
Subscribe today to unlock all pages.
Trusted by 1+ million students worldwide
Q2
Group Statistics
Alcohol Condition N Mean
Std.
Deviation
Std. Error
Mean
Number of mistakes made on video
test after 4 hours
Alcohol 12 4.5000 2.15322 .62158
No-
Alcohol
12 5.1667 2.44330 .70532
Number of mistakes made on video
test after 12 hours
Alcohol 12 10.3333 1.66969 .48200
No-
Alcohol
12 7.0000 1.59545 .46057
Independent Samples Test
Levene's
Test for
Equality of
Variances t-test for Equality of Means
F Sig. t df
Sig.
(2-
taile
d)
Mean
Differen
ce
Std.
Error
Differen
ce
95%
Confidence
Interval of the
Difference
Lower Upper
Numb
er of
mistak
es
made
on
video
test
after 4
hours
Equal
varianc
es
assume
d
.733 .401 -.70
9
22 .486 -.66667 .94013 -
2.6163
7
1.283
04
Equal
varianc
es not
assume
d
-.70
9
21.65
8
.486 -.66667 .94013 -
2.6181
6
1.284
83
Numb
er of
mistak
es
made
on
video
test
after
12
hours
Equal
varianc
es
assume
d
0.00
0
1.00
0
5.00
0
22 .000 3.33333 .66667 1.9507
5
4.715
92
Equal
varianc
es not
assume
d
5.00
0
21.95
5
.000 3.33333 .66667 1.9505
9
4.716
08
Paraphrase This Document
Need a fresh take? Get an instant paraphrase of this document with our AI Paraphraser
Q3
ANOVA
Score
Sum of Squares df Mean Square F Sig.
Between Groups 4212.87 2 2106.43 7.045 0.003
Within Groups 8073.3 27 299.011
Total 12286.2 29
Multiple Comparisons
Dependent Variable:
Score
Tukey HSD
(I) Groups (J) Groups
Mean
Difference (I-J)
Std.
Error
Si
g.
95% Confidence
Interval
Lower
Bound
Upper
Bound
Yoga Breathing -16.8 7.73319 0.094 -35.9738 2.3738
Levender -28.90000* 7.73319 0.002 -48.0738 -9.7262
Breathing Yoga 16.8 7.73319 0.094 -2.3738 35.9738
Levender -12.1 7.73319 0.278 -31.2738 7.0738
Levender Yoga 28.90000* 7.73319 0.002 9.7262 48.0738
Breathing 12.1 7.73319 0.278 -7.0738 31.2738
* The mean difference is significant at the
0.05 level.
Score
Tukey HSD
Groups N
Subset for alpha = 0.05
1 2
Yoga 10 43.6000
Breathing 10 60.4000 60.4000
Levender 10 72.5000
Sig. .094 .278
Means for groups in homogeneous subsets are displayed.
a. Uses Harmonic Mean Sample Size = 10.000.

⊘ This is a preview!⊘
Do you want full access?
Subscribe today to unlock all pages.
Trusted by 1+ million students worldwide
1 out of 12
Related Documents


Your All-in-One AI-Powered Toolkit for Academic Success.
+13062052269
info@desklib.com
Available 24*7 on WhatsApp / Email
![[object Object]](/_next/static/media/star-bottom.7253800d.svg)
Unlock your academic potential
Copyright © 2020–2026 A2Z Services. All Rights Reserved. Developed and managed by ZUCOL.