MGT723 Research Project Semester 1: Carbon Emission Comparison Study
VerifiedAdded on 2023/06/07
|19
|3251
|289
Report
AI Summary
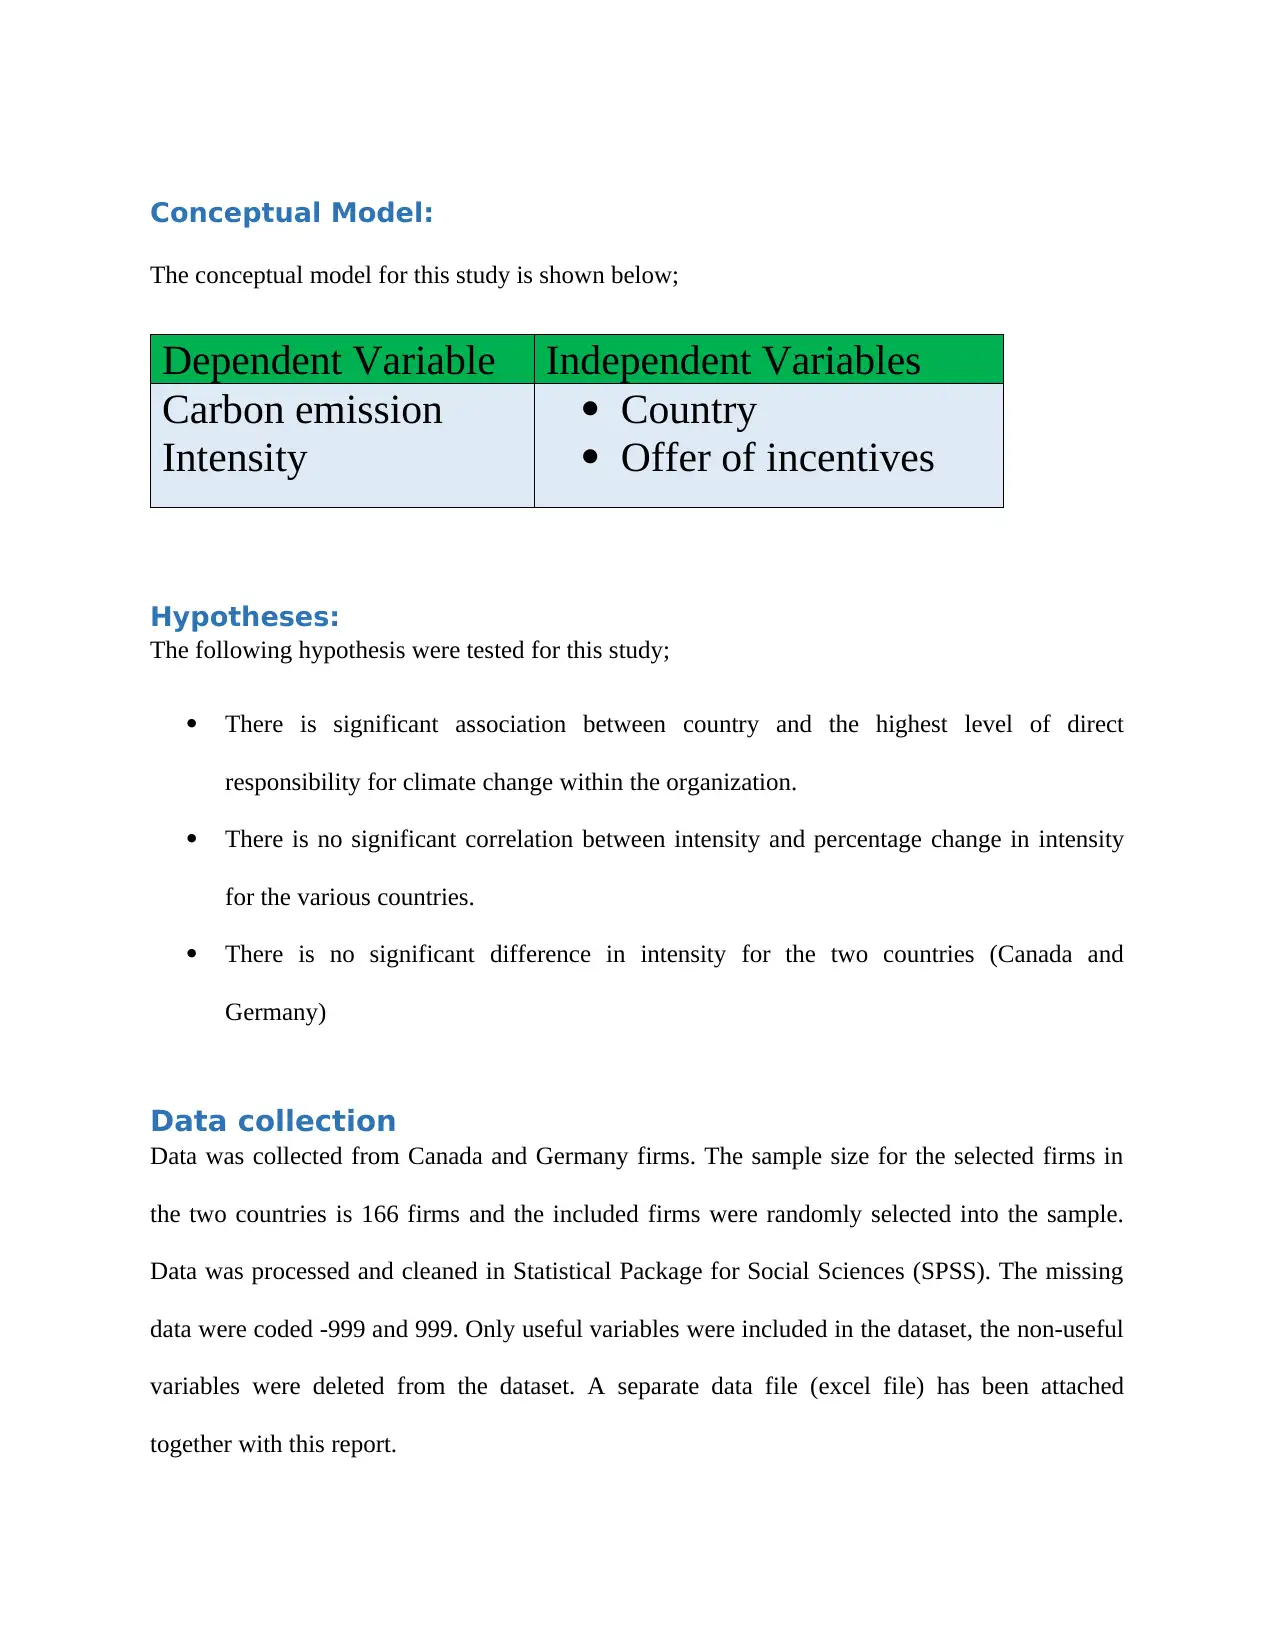
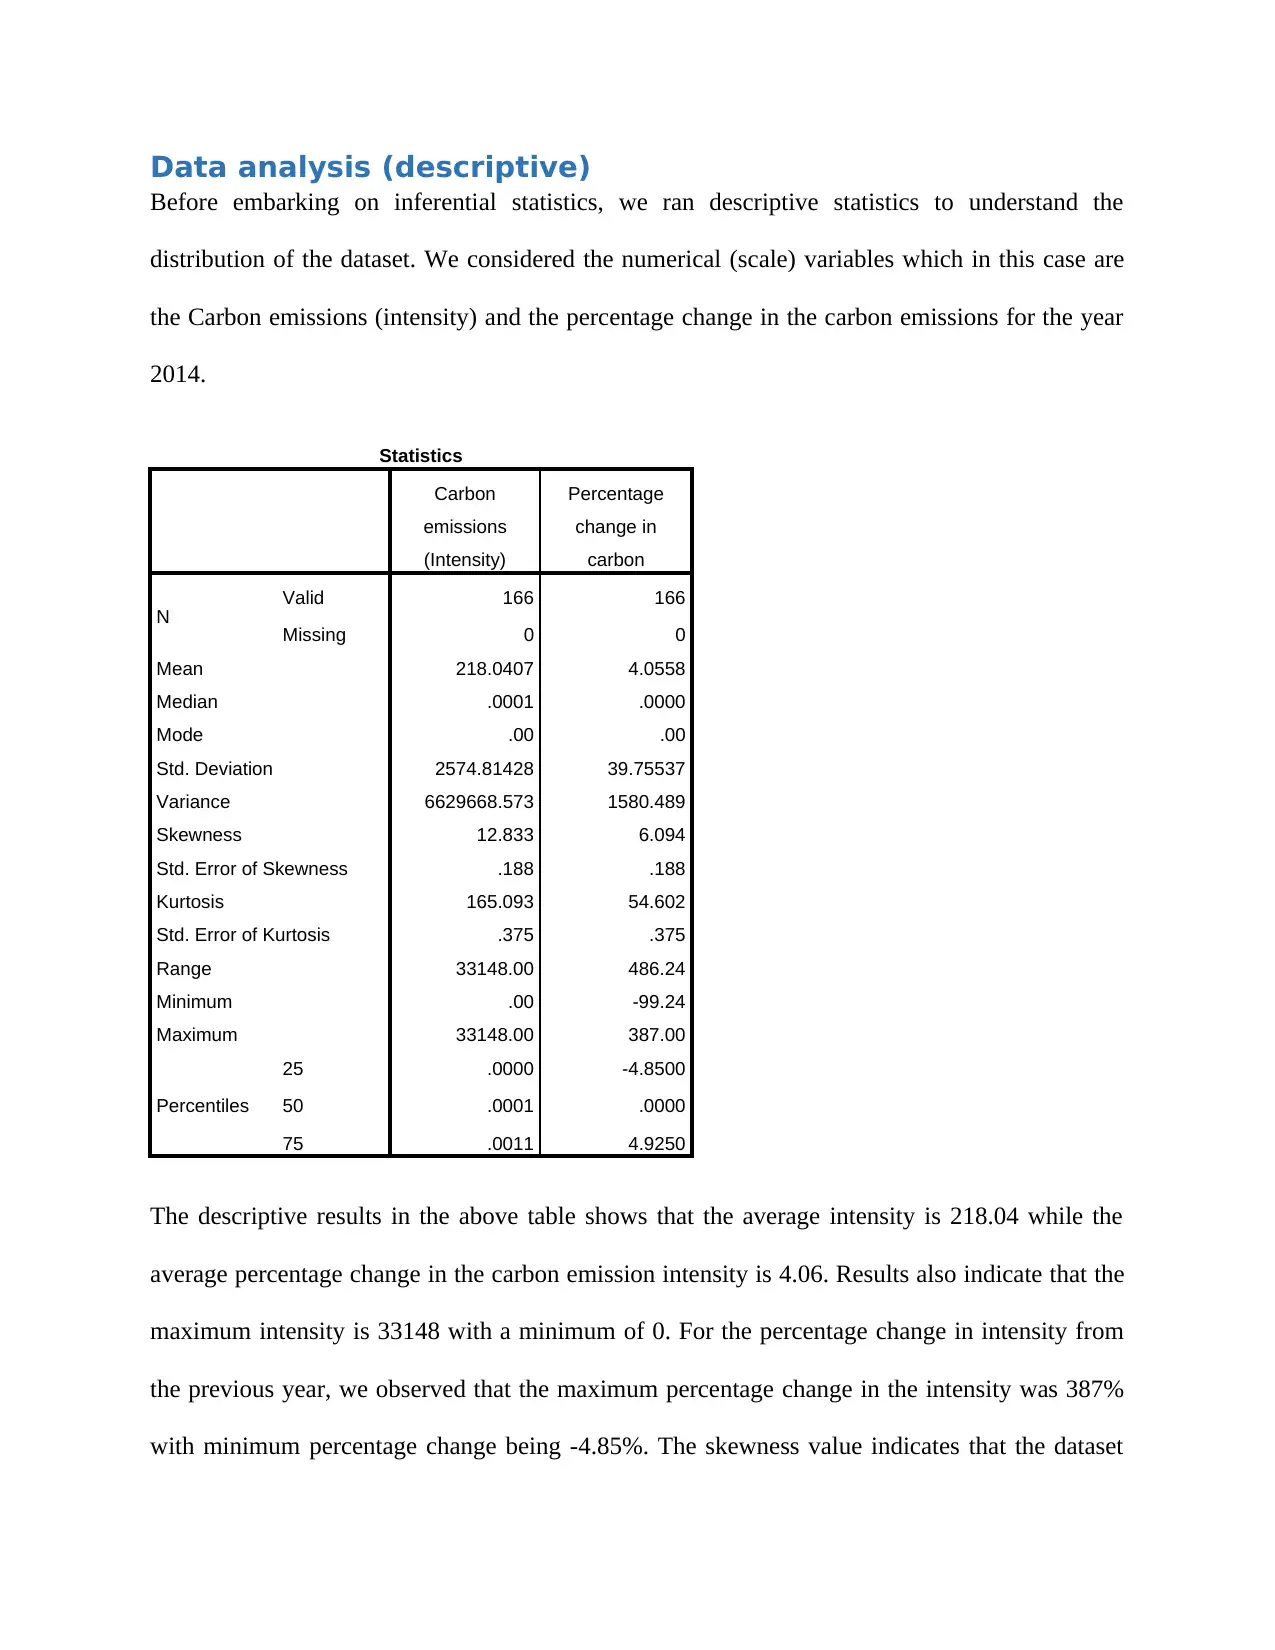
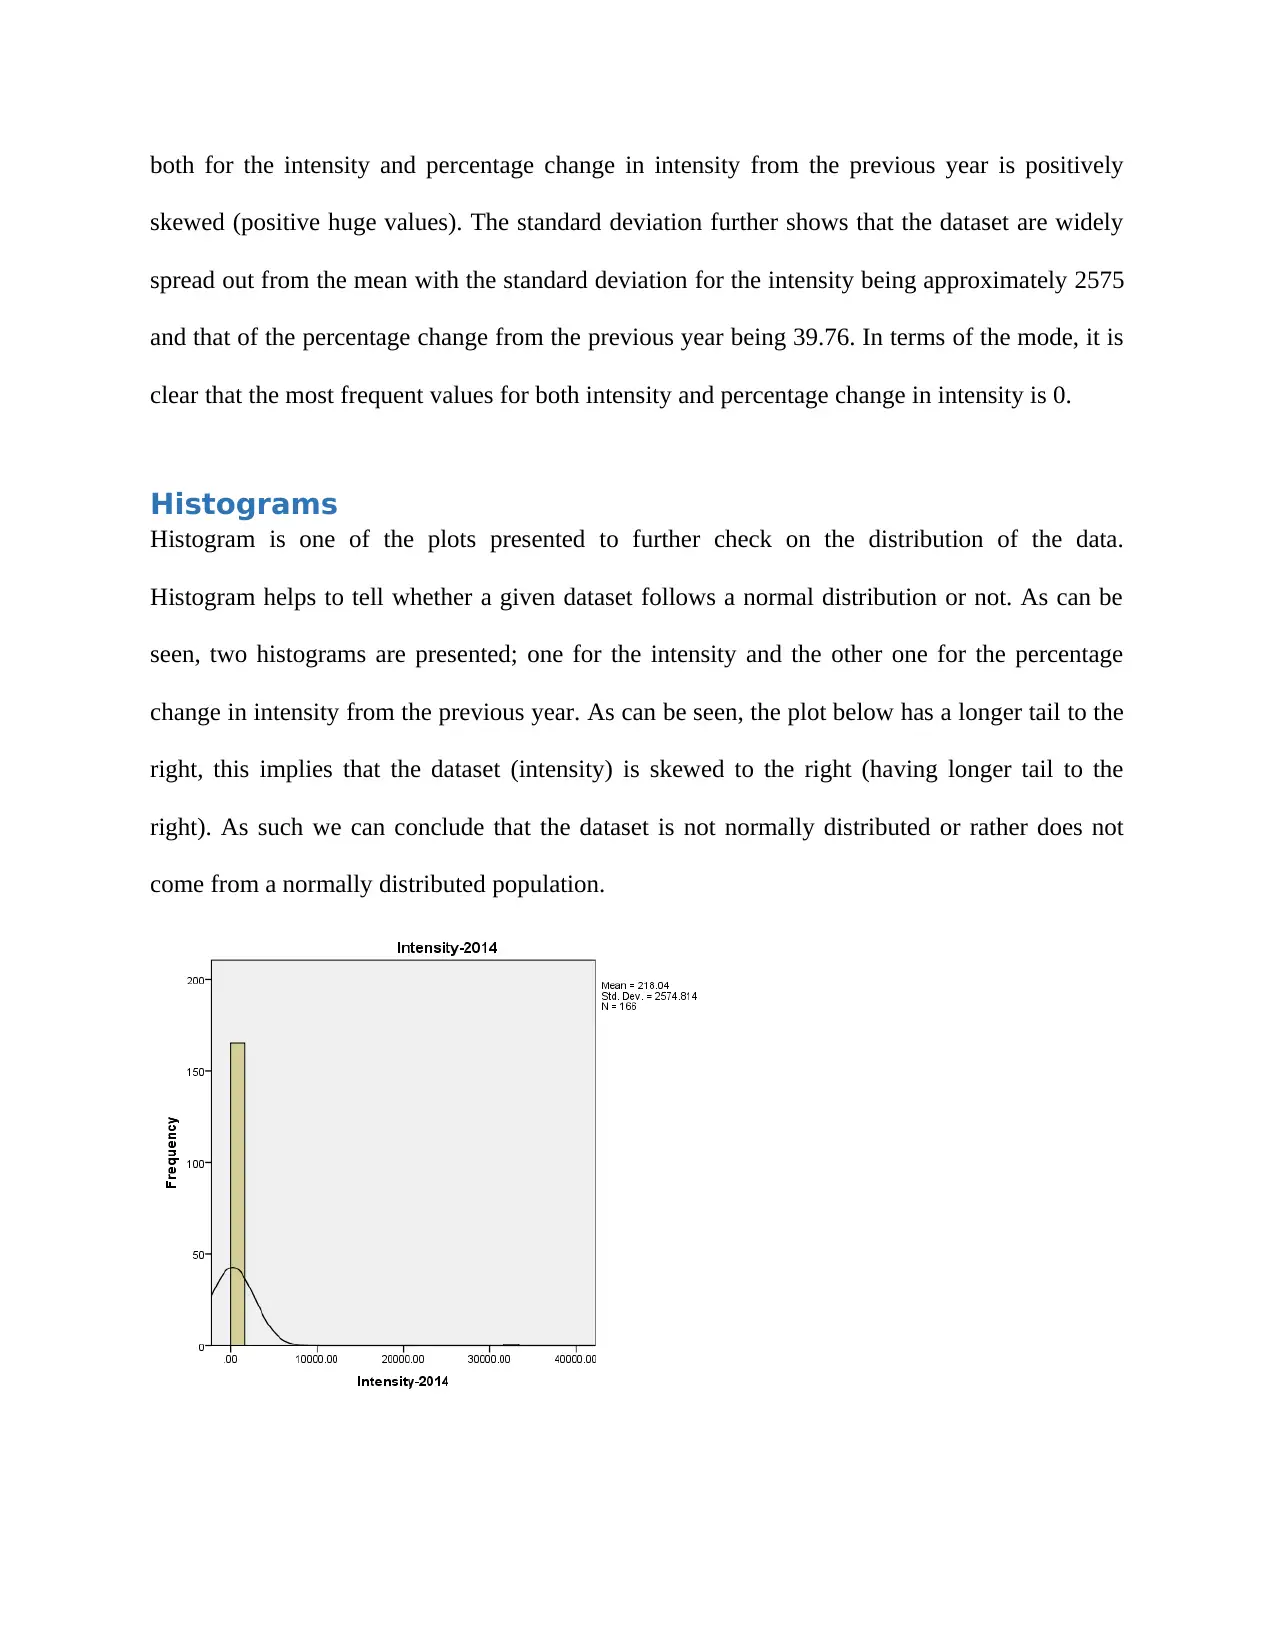
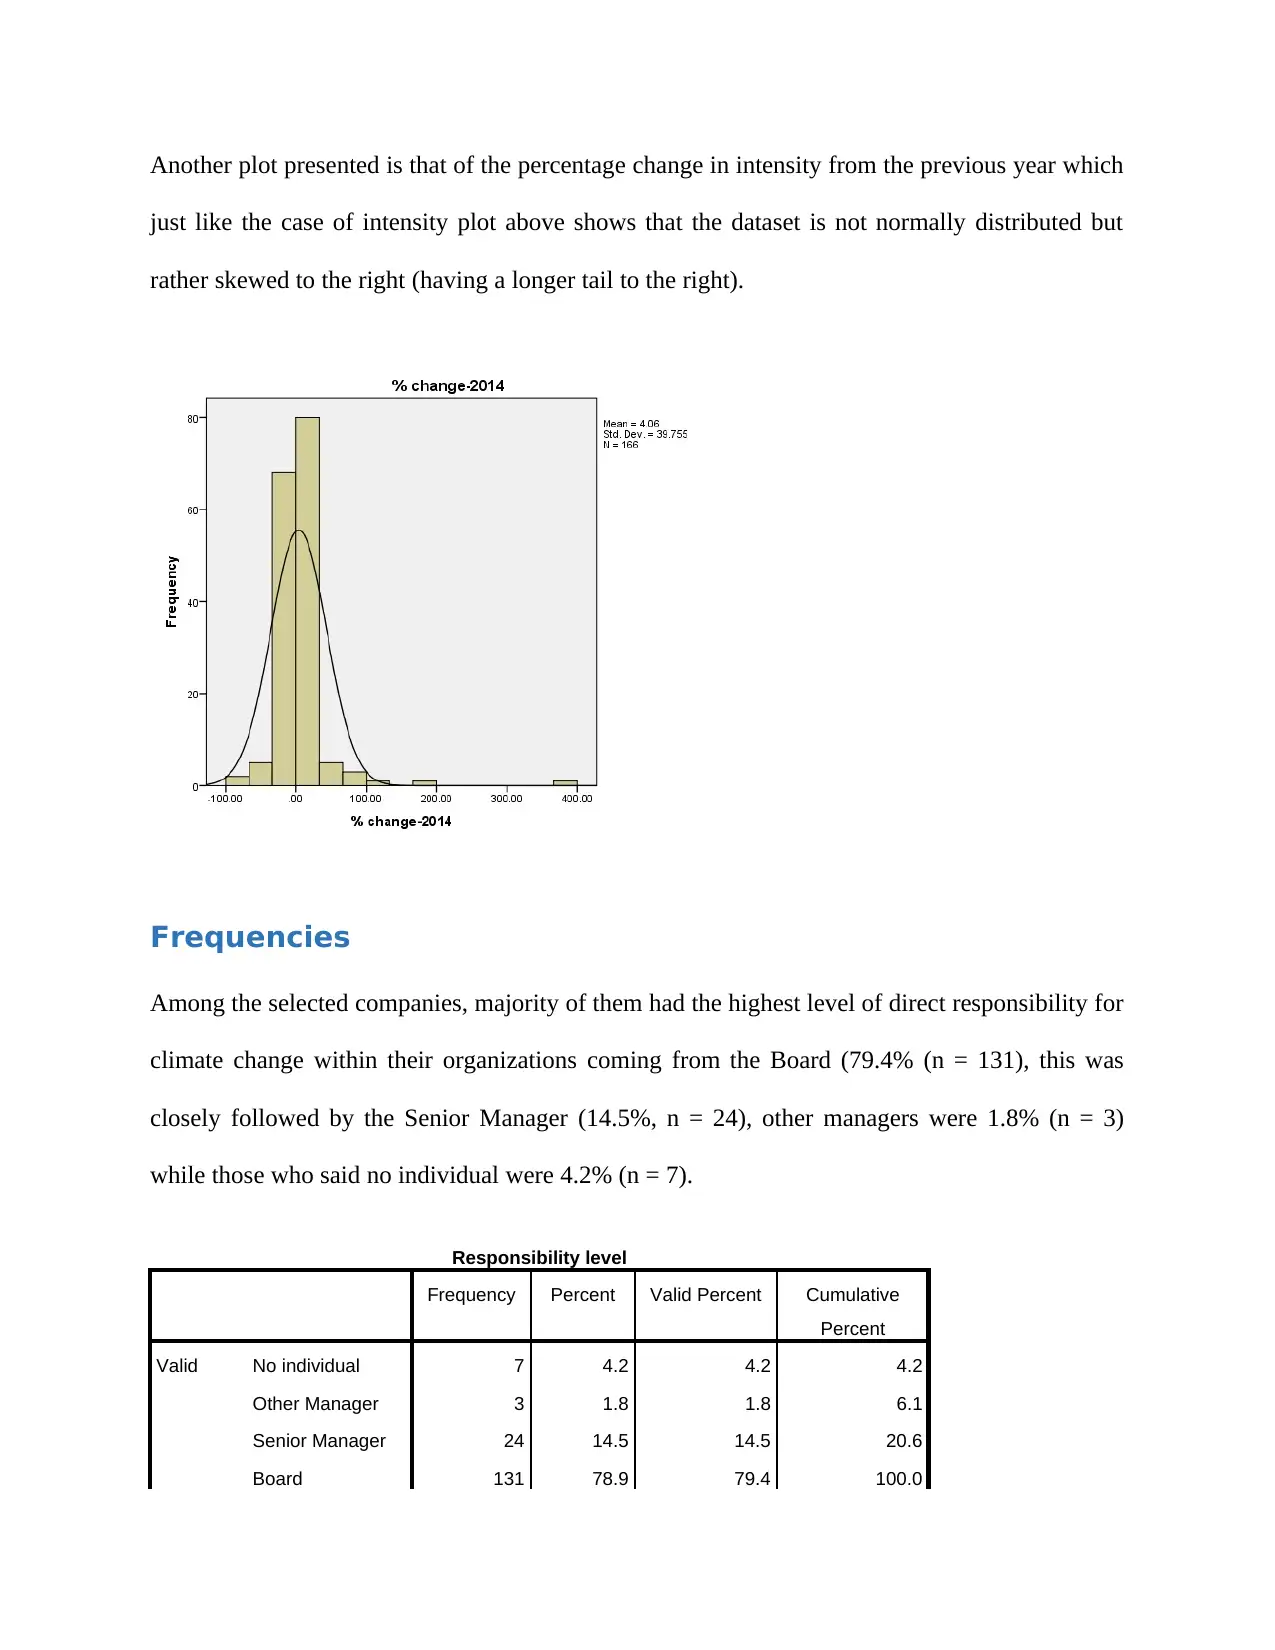
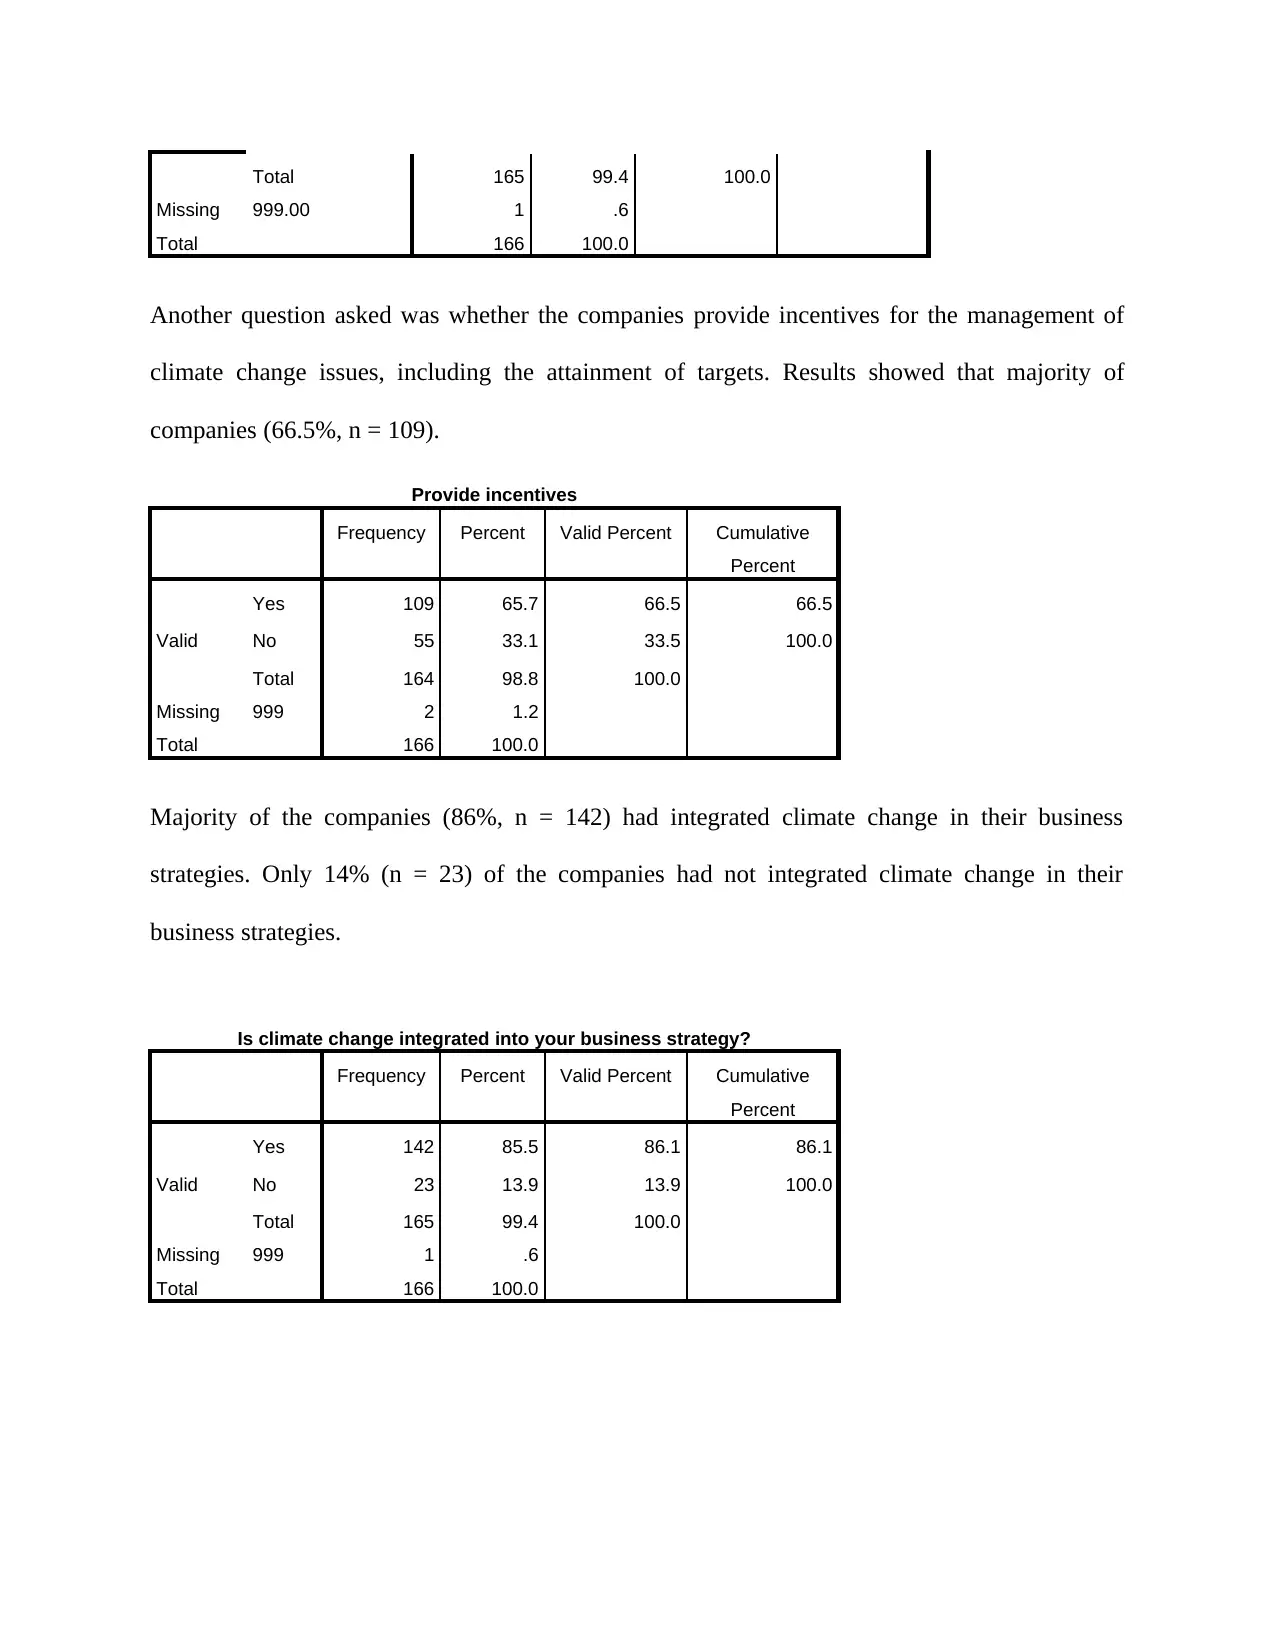
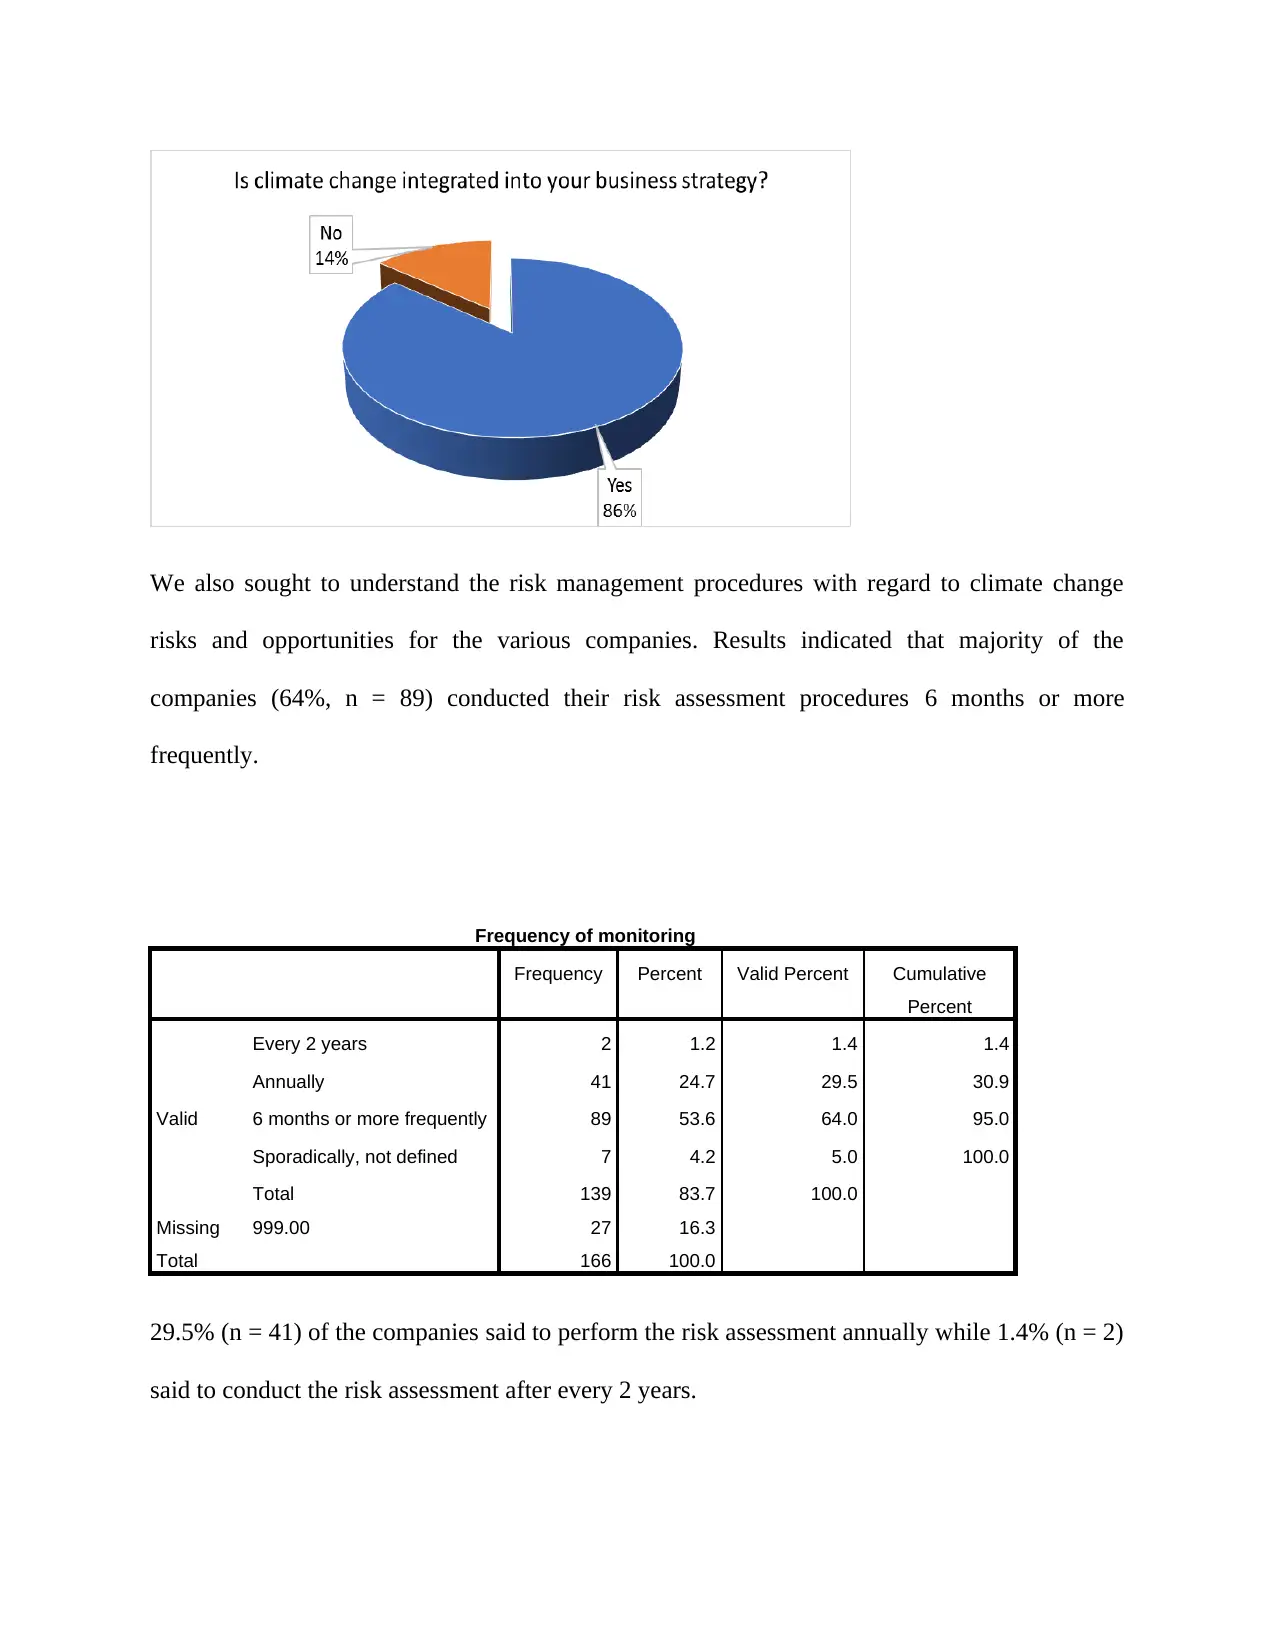
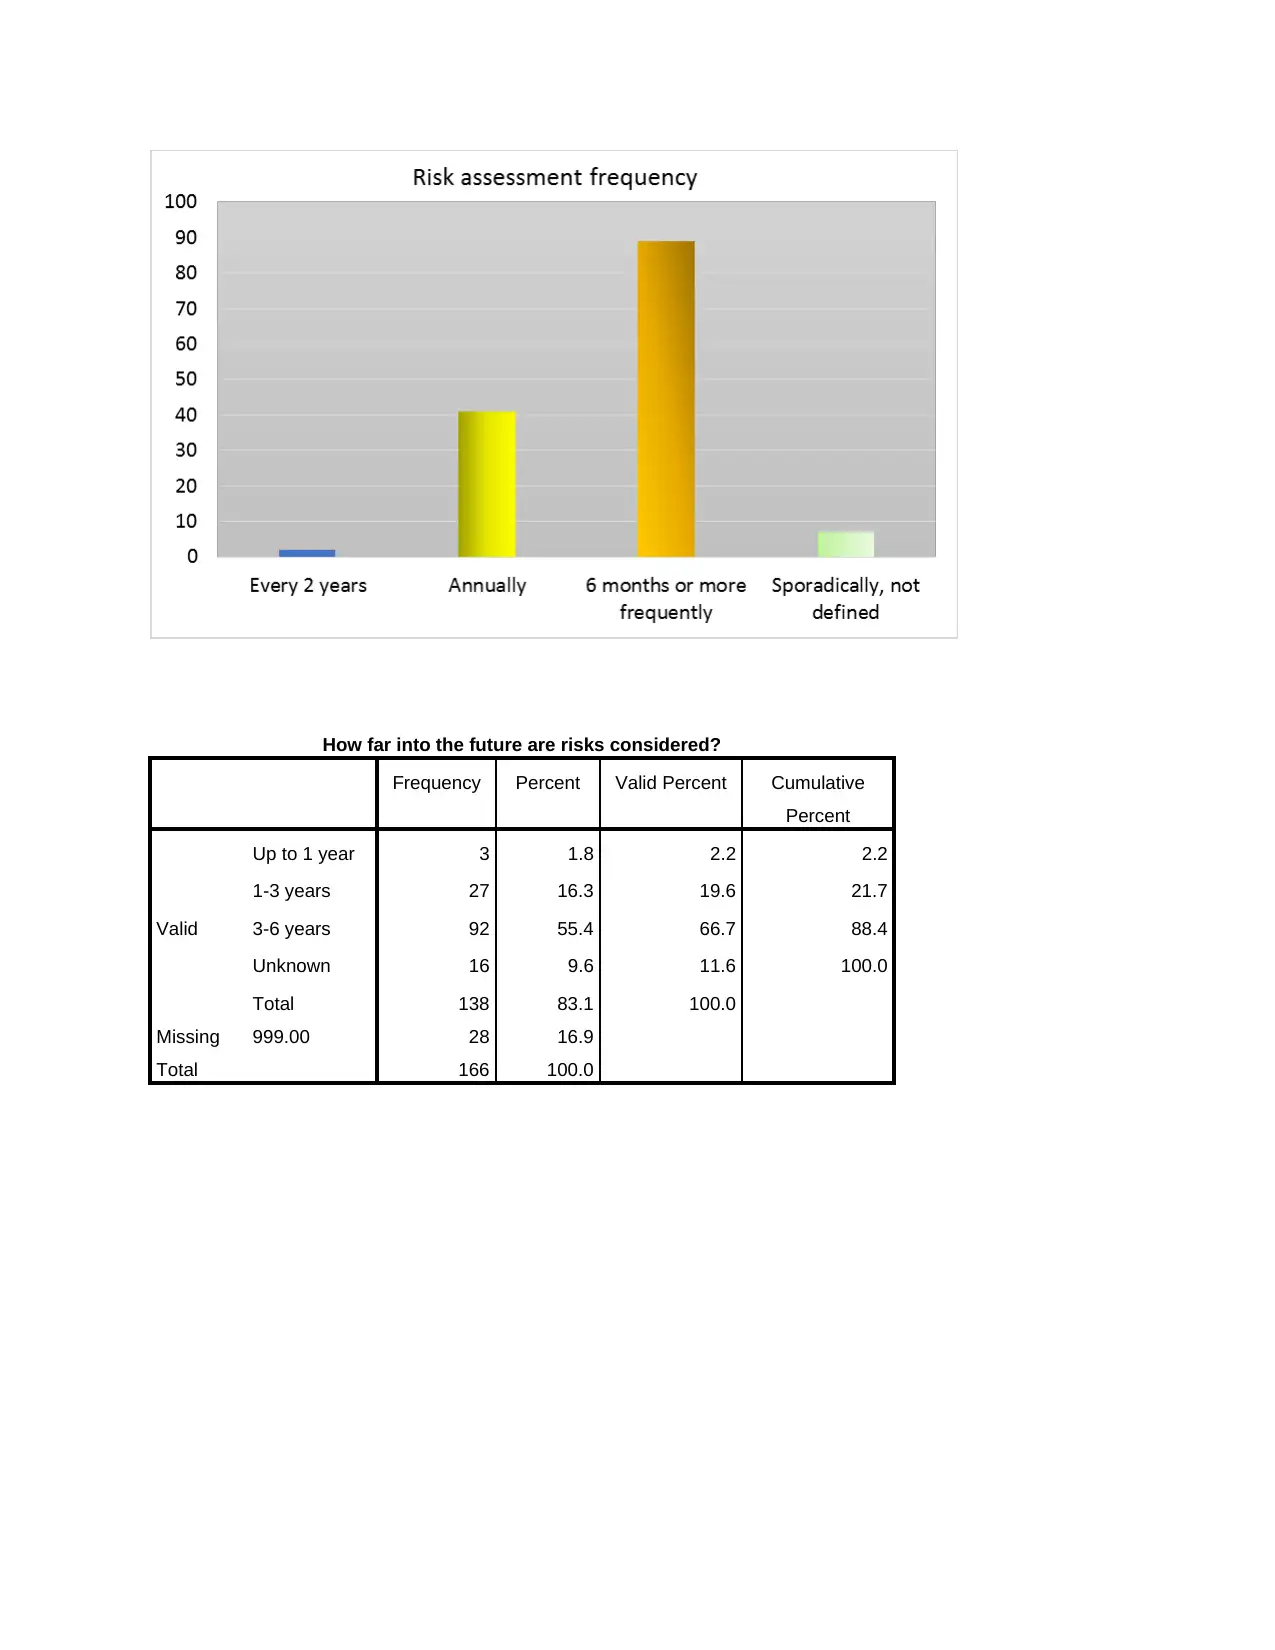
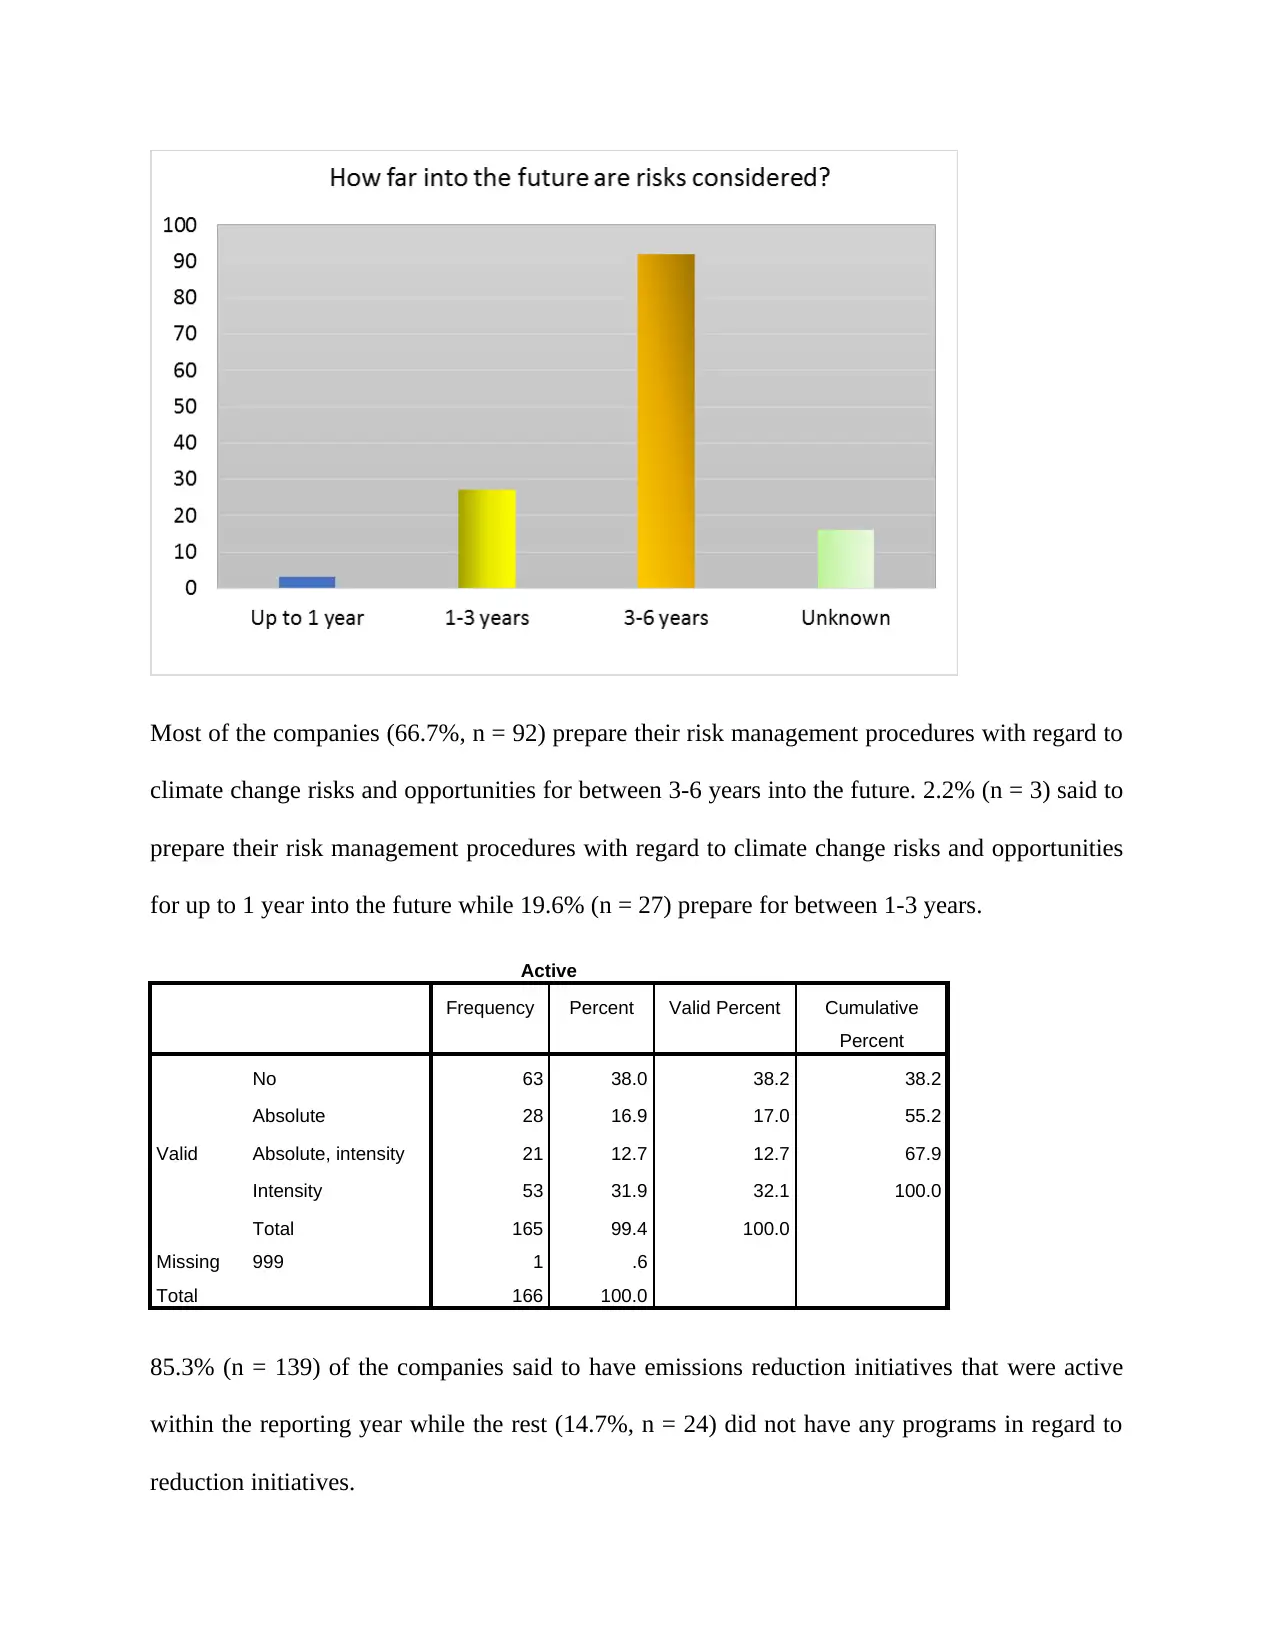
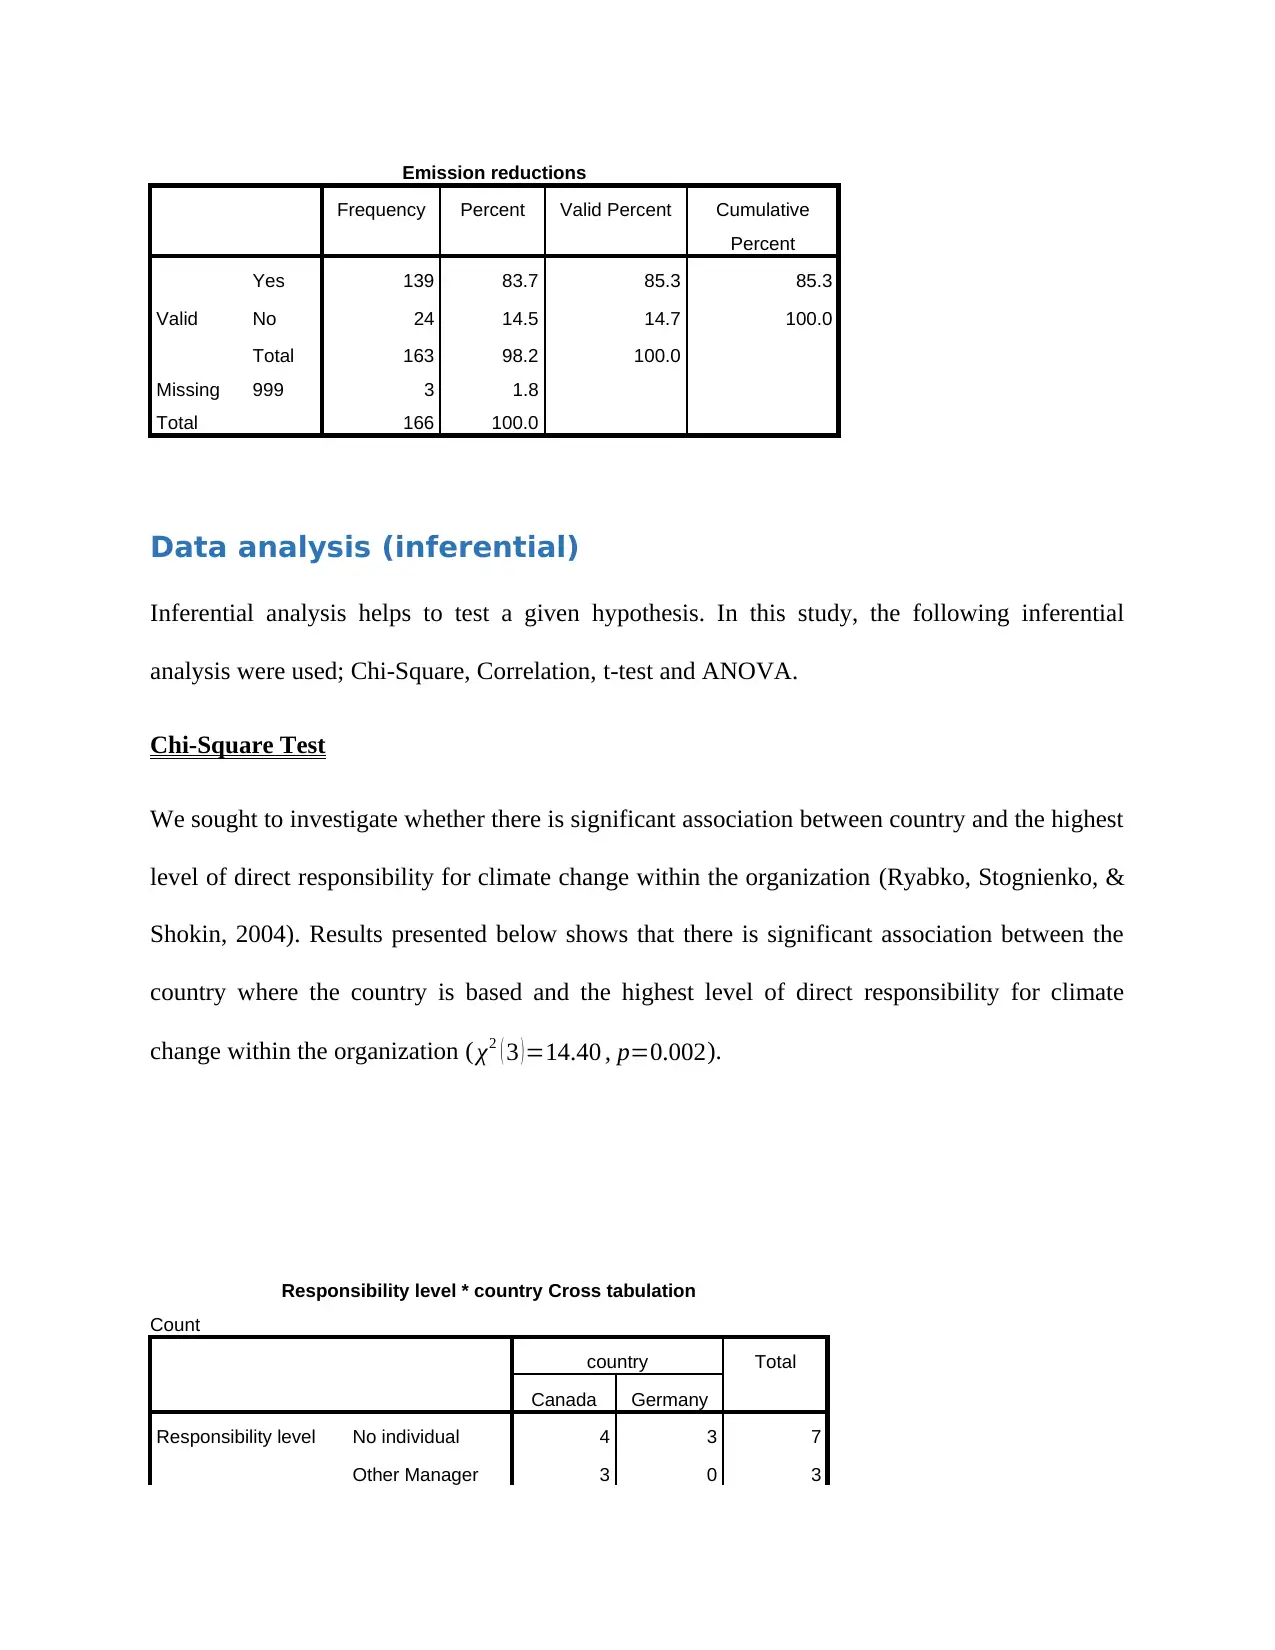
This research project, conducted for MGT723, investigates carbon emissions in Canada and Germany, focusing on the application of stakeholder theory. The study examines a sample of 166 firms, analyzing carbon emission intensity and the influence of company incentives on emission management. The research employs descriptive and inferential statistical analyses, including Chi-Square, correlation, t-tests, and ANOVA, using SPSS to analyze the collected data. The findings reveal a significant association between a country's location and the level of responsibility for climate change within organizations, while also exploring relationships between emission reduction initiatives and risk assessment procedures. The study also presents descriptive statistics, histograms, and frequency analyses to provide a comprehensive overview of the data, including the distribution of carbon emission intensity and percentage changes from the previous year, as well as the integration of climate change into business strategies and the frequency of risk monitoring.

MGT723 Research Project
Semester 1 2018
Assessment Task 2: Data Collection
Title: - Stakeholder Theory in Canada and Germany
Companies
Semester 1 2018
Assessment Task 2: Data Collection
Title: - Stakeholder Theory in Canada and Germany
Companies
Paraphrase This Document
Need a fresh take? Get an instant paraphrase of this document with our AI Paraphraser

Introduction:
Carbon emissions is a serious issue globally and many countries are struggling to see how they
can contain this menace that has threatened the well-being of the climate. It has resulted to
unaccounted amount of pollution in some countries that it becomes very difficult to stay
comfortably. Activities by humans such as deforestation, consuming of non-renewable energy
sources, farming practices (e.g., the utilization of compost, and raising domesticated animals),
modern procedures, refrigeration, and the utilization of a few customer items — result in the
outflow of ozone harming substances (Chunbo & Stern, 2008).
One technique to empower and perhaps direct organizations to decrease the ozone depleting
substance outflows coming about because of their exercises, is through the deliberate or
compulsory detailing of organizations' ozone depleting substance discharges (Smith, 2009).
The aim of this study was to identify and compare the carbon emission for two countries: Canada
and Germany. The study also sought to find out whether there is significant difference in the
average intensity emissions for companies that offer incentives towards management of
emissions and those that do not.

Literature Review – Summary
Environmental change is at present a theme of incredible enthusiasm to organizations, financial
specialists, policy makers, and scholastics. In view of the part of ozone harming substances like
carbon outflows in causing worldwide warming and the huge outcomes that environmental
change may have on the planet, a plenty of activities trying to decrease the carbon outflows of
both open and private associations have developed around the world (Bonner, Hastie, &
Sprinkle, 2000). In like manner, numerous partnerships are giving motivating forces to their
workers outfitted towards diminishing carbon emanations coming about because of the
company's activities (Bansal & Roth, 2000).
The scholarly writing incorporates numerous examinations that have investigated the adequacy
of money related versus nonmonetary motivating forces, in fields as differing as financial
matters, psychology research and many more. Inside financial aspects, organization hypothesis
contemplates the impact of money related motivating forces on individual performance,
contending that fiscal motivations are utilized so as to adjust the key goals with those of the
agent's. In this way, the ideal contract is basically an exchange off between chance sharing
between the representative and the firm and motivating force arrangements, gave that the quality
of the money related motivating forces ought to diminish in extent to the commotion of the
execution measures upon which the agreement is based (Aguilera, Rupp, Williams, & Ganapathi,
2007).
.
⊘ This is a preview!⊘
Do you want full access?
Subscribe today to unlock all pages.

Trusted by 1+ million students worldwide

Conceptual Model:
The conceptual model for this study is shown below;
Dependent Variable Independent Variables
Carbon emission
Intensity
Country
Offer of incentives
Hypotheses:
The following hypothesis were tested for this study;
There is significant association between country and the highest level of direct
responsibility for climate change within the organization.
There is no significant correlation between intensity and percentage change in intensity
for the various countries.
There is no significant difference in intensity for the two countries (Canada and
Germany)
Data collection
Data was collected from Canada and Germany firms. The sample size for the selected firms in
the two countries is 166 firms and the included firms were randomly selected into the sample.
Data was processed and cleaned in Statistical Package for Social Sciences (SPSS). The missing
data were coded -999 and 999. Only useful variables were included in the dataset, the non-useful
variables were deleted from the dataset. A separate data file (excel file) has been attached
together with this report.
Paraphrase This Document
Need a fresh take? Get an instant paraphrase of this document with our AI Paraphraser

Data analysis (descriptive)
Before embarking on inferential statistics, we ran descriptive statistics to understand the
distribution of the dataset. We considered the numerical (scale) variables which in this case are
the Carbon emissions (intensity) and the percentage change in the carbon emissions for the year
2014.
Statistics
Carbon
emissions
(Intensity)
Percentage
change in
carbon
N Valid 166 166
Missing 0 0
Mean 218.0407 4.0558
Median .0001 .0000
Mode .00 .00
Std. Deviation 2574.81428 39.75537
Variance 6629668.573 1580.489
Skewness 12.833 6.094
Std. Error of Skewness .188 .188
Kurtosis 165.093 54.602
Std. Error of Kurtosis .375 .375
Range 33148.00 486.24
Minimum .00 -99.24
Maximum 33148.00 387.00
Percentiles
25 .0000 -4.8500
50 .0001 .0000
75 .0011 4.9250
The descriptive results in the above table shows that the average intensity is 218.04 while the
average percentage change in the carbon emission intensity is 4.06. Results also indicate that the
maximum intensity is 33148 with a minimum of 0. For the percentage change in intensity from
the previous year, we observed that the maximum percentage change in the intensity was 387%
with minimum percentage change being -4.85%. The skewness value indicates that the dataset

both for the intensity and percentage change in intensity from the previous year is positively
skewed (positive huge values). The standard deviation further shows that the dataset are widely
spread out from the mean with the standard deviation for the intensity being approximately 2575
and that of the percentage change from the previous year being 39.76. In terms of the mode, it is
clear that the most frequent values for both intensity and percentage change in intensity is 0.
Histograms
Histogram is one of the plots presented to further check on the distribution of the data.
Histogram helps to tell whether a given dataset follows a normal distribution or not. As can be
seen, two histograms are presented; one for the intensity and the other one for the percentage
change in intensity from the previous year. As can be seen, the plot below has a longer tail to the
right, this implies that the dataset (intensity) is skewed to the right (having longer tail to the
right). As such we can conclude that the dataset is not normally distributed or rather does not
come from a normally distributed population.
⊘ This is a preview!⊘
Do you want full access?
Subscribe today to unlock all pages.

Trusted by 1+ million students worldwide

Another plot presented is that of the percentage change in intensity from the previous year which
just like the case of intensity plot above shows that the dataset is not normally distributed but
rather skewed to the right (having a longer tail to the right).
Frequencies
Among the selected companies, majority of them had the highest level of direct responsibility for
climate change within their organizations coming from the Board (79.4% (n = 131), this was
closely followed by the Senior Manager (14.5%, n = 24), other managers were 1.8% (n = 3)
while those who said no individual were 4.2% (n = 7).
Responsibility level
Frequency Percent Valid Percent Cumulative
Percent
Valid No individual 7 4.2 4.2 4.2
Other Manager 3 1.8 1.8 6.1
Senior Manager 24 14.5 14.5 20.6
Board 131 78.9 79.4 100.0
Paraphrase This Document
Need a fresh take? Get an instant paraphrase of this document with our AI Paraphraser

Total 165 99.4 100.0
Missing 999.00 1 .6
Total 166 100.0
Another question asked was whether the companies provide incentives for the management of
climate change issues, including the attainment of targets. Results showed that majority of
companies (66.5%, n = 109).
Provide incentives
Frequency Percent Valid Percent Cumulative
Percent
Valid
Yes 109 65.7 66.5 66.5
No 55 33.1 33.5 100.0
Total 164 98.8 100.0
Missing 999 2 1.2
Total 166 100.0
Majority of the companies (86%, n = 142) had integrated climate change in their business
strategies. Only 14% (n = 23) of the companies had not integrated climate change in their
business strategies.
Is climate change integrated into your business strategy?
Frequency Percent Valid Percent Cumulative
Percent
Valid
Yes 142 85.5 86.1 86.1
No 23 13.9 13.9 100.0
Total 165 99.4 100.0
Missing 999 1 .6
Total 166 100.0

We also sought to understand the risk management procedures with regard to climate change
risks and opportunities for the various companies. Results indicated that majority of the
companies (64%, n = 89) conducted their risk assessment procedures 6 months or more
frequently.
Frequency of monitoring
Frequency Percent Valid Percent Cumulative
Percent
Valid
Every 2 years 2 1.2 1.4 1.4
Annually 41 24.7 29.5 30.9
6 months or more frequently 89 53.6 64.0 95.0
Sporadically, not defined 7 4.2 5.0 100.0
Total 139 83.7 100.0
Missing 999.00 27 16.3
Total 166 100.0
29.5% (n = 41) of the companies said to perform the risk assessment annually while 1.4% (n = 2)
said to conduct the risk assessment after every 2 years.
⊘ This is a preview!⊘
Do you want full access?
Subscribe today to unlock all pages.

Trusted by 1+ million students worldwide

How far into the future are risks considered?
Frequency Percent Valid Percent Cumulative
Percent
Valid
Up to 1 year 3 1.8 2.2 2.2
1-3 years 27 16.3 19.6 21.7
3-6 years 92 55.4 66.7 88.4
Unknown 16 9.6 11.6 100.0
Total 138 83.1 100.0
Missing 999.00 28 16.9
Total 166 100.0
Frequency Percent Valid Percent Cumulative
Percent
Valid
Up to 1 year 3 1.8 2.2 2.2
1-3 years 27 16.3 19.6 21.7
3-6 years 92 55.4 66.7 88.4
Unknown 16 9.6 11.6 100.0
Total 138 83.1 100.0
Missing 999.00 28 16.9
Total 166 100.0
Paraphrase This Document
Need a fresh take? Get an instant paraphrase of this document with our AI Paraphraser

Most of the companies (66.7%, n = 92) prepare their risk management procedures with regard to
climate change risks and opportunities for between 3-6 years into the future. 2.2% (n = 3) said to
prepare their risk management procedures with regard to climate change risks and opportunities
for up to 1 year into the future while 19.6% (n = 27) prepare for between 1-3 years.
Active
Frequency Percent Valid Percent Cumulative
Percent
Valid
No 63 38.0 38.2 38.2
Absolute 28 16.9 17.0 55.2
Absolute, intensity 21 12.7 12.7 67.9
Intensity 53 31.9 32.1 100.0
Total 165 99.4 100.0
Missing 999 1 .6
Total 166 100.0
85.3% (n = 139) of the companies said to have emissions reduction initiatives that were active
within the reporting year while the rest (14.7%, n = 24) did not have any programs in regard to
reduction initiatives.

Emission reductions
Frequency Percent Valid Percent Cumulative
Percent
Valid
Yes 139 83.7 85.3 85.3
No 24 14.5 14.7 100.0
Total 163 98.2 100.0
Missing 999 3 1.8
Total 166 100.0
Data analysis (inferential)
Inferential analysis helps to test a given hypothesis. In this study, the following inferential
analysis were used; Chi-Square, Correlation, t-test and ANOVA.
Chi-Square Test
We sought to investigate whether there is significant association between country and the highest
level of direct responsibility for climate change within the organization (Ryabko, Stognienko, &
Shokin, 2004). Results presented below shows that there is significant association between the
country where the country is based and the highest level of direct responsibility for climate
change within the organization ( χ2 ( 3 )=14.40 , p=0.002).
Responsibility level * country Cross tabulation
Count
country Total
Canada Germany
Responsibility level No individual 4 3 7
Other Manager 3 0 3
⊘ This is a preview!⊘
Do you want full access?
Subscribe today to unlock all pages.

Trusted by 1+ million students worldwide
1 out of 19

Your All-in-One AI-Powered Toolkit for Academic Success.
+13062052269
info@desklib.com
Available 24*7 on WhatsApp / Email
Unlock your academic potential
Copyright © 2020–2025 A2Z Services. All Rights Reserved. Developed and managed by ZUCOL.