Statistics (STAT-101) Assignment 1: Frequency, Mean and Probability

Verified

Added on  2023/06/03

|6
|517
|50
Homework Assignment
AI Summary
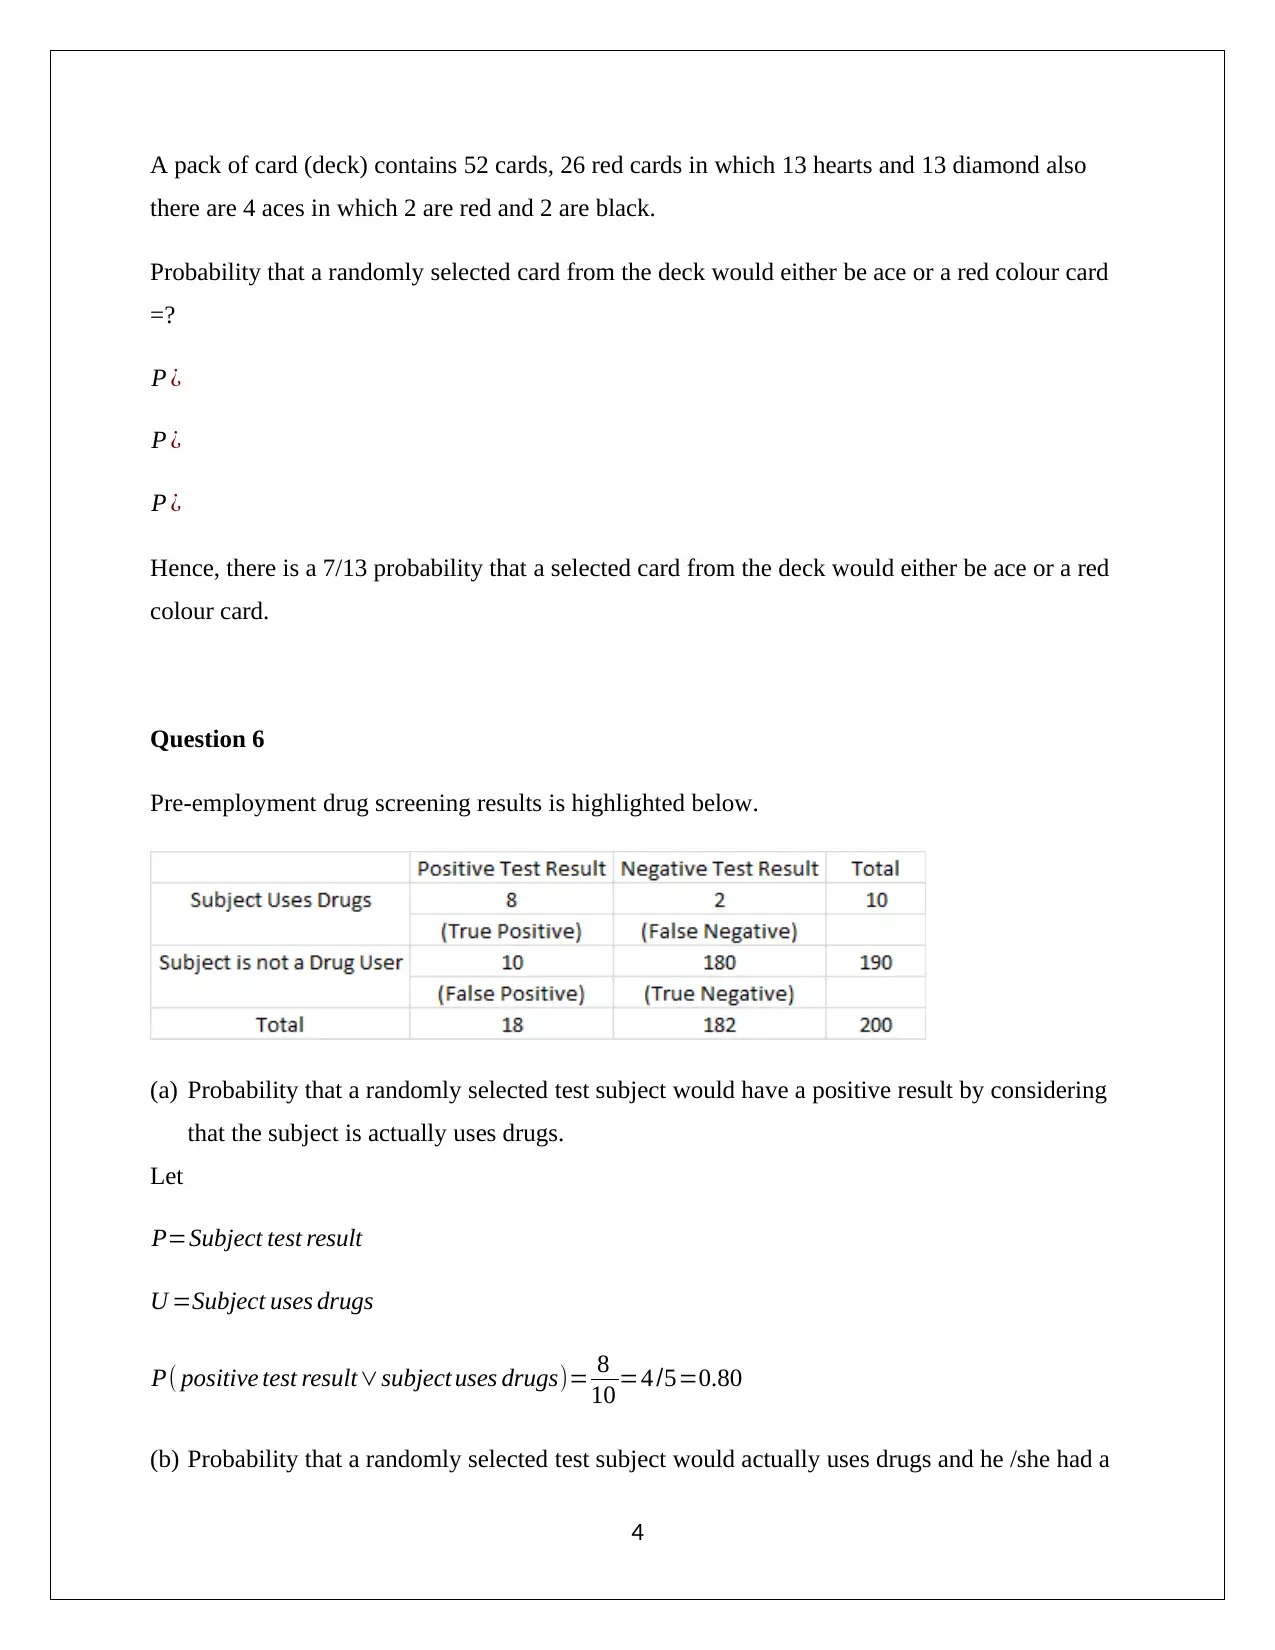
This document provides a solved assignment for Statistics (STAT-101), covering key concepts such as frequency distributions, relative frequency, class boundaries, and mid-points. It includes the construction of frequency tables and histograms, calculation of mean and standard deviation, and probability calculations related to card selection and drug screening results. The assignment demonstrates the application of statistical methods to analyze data and interpret results, providing a comprehensive solution for students studying introductory statistics. Desklib offers more solved assignments and resources for students.
Document Page
STATISTICS (STAT -101)
Assignment – 1
Student’s Name
Student’s ID
Section/CRN
Location
tabler-icon-diamond-filled.svg

Paraphrase This Document

Need a fresh take? Get an instant paraphrase of this document with our AI Paraphraser
Document Page
Question 1
Given data points
Frequency distribution
Class interval Frequency Relative frequency
12 – 16 6 0.30
17- 21 3 0.15
22 -26 7 0.35
27-31 3 0.15
32 -36 1 0.05
Total 20 1
Relative Frequency = Class frequency/Total Observations
Question 2
Frequency table
Class
Interval
Frequenc
y
Class Boundaries Class Mid-Points
1019 4 ¿(2019)/2=0.5
¿ 19+0.5=19.5
¿( 10+19) /2=14.5
2029 6 ¿( 3029)/2=0.5
¿ 29+0.5=29.5
¿( 20+29)/2=24.5
3039 10 =(40-39 ¿/2=0.5
¿ 39+0.5=39.5
¿( 30+39)/2=34.5
4049 6 =(50- 49 ¿ /2=0.5
¿ 49+ 0.5=49.5
¿( 40+9)/2=44.5
5059 4 =(60-59 ¿/2=0.5
¿ 59+0.5=59.5
¿( 50+59) /2=54.5
1
Document Page
Histogram
10 - 19 20-29 30-39 40-49 50-59
0
2
4
6
8
10
12
Histogram
Class Interval
Frequency
Question 3
Data points
5, 6, 7, 8, 9
Mean x= x
n =5+ 6+7+8+ 9
5 =7
Standard deviation of sample ¿ 1
n1 ¿ ¿ ¿
2
Document Page
Standard deviation= ( 4+1+0+1+ 4)
51 =1.58
Based on the above computation, it can be said that value 10 is unusual because it does not lie in
the data points.
Question 4
Distribution of marks
Marks
Interval
No. of
Students
(F)
Mid-Point of
Interval (M)
F*M
0-10 4 = (0+10)/2
= 5
=4*5 = 20
10-20 6 =(10+20)/2
= 15
=6*15 = 90
20-30 10 =(20+30)/2
= 25
=10*25 =250
30-40 6 =(30+40)/2
=35
=6*35 =210
40-50 4 =(40+50)/2
=45
=4*45 =180
Mean= FM
F = 750
30 =25
Therefore, the mean of the marks is 25.
Question 5
3
tabler-icon-diamond-filled.svg

Paraphrase This Document

Need a fresh take? Get an instant paraphrase of this document with our AI Paraphraser
Document Page
A pack of card (deck) contains 52 cards, 26 red cards in which 13 hearts and 13 diamond also
there are 4 aces in which 2 are red and 2 are black.
Probability that a randomly selected card from the deck would either be ace or a red colour card
=?
P ¿
P ¿
P ¿
Hence, there is a 7/13 probability that a selected card from the deck would either be ace or a red
colour card.
Question 6
Pre-employment drug screening results is highlighted below.
(a) Probability that a randomly selected test subject would have a positive result by considering
that the subject is actually uses drugs.
Let
P=Subject test result
U =Subject uses drugs
P( positive test resultsubject uses drugs)= 8
10 =4 /5=0.80
(b) Probability that a randomly selected test subject would actually uses drugs and he /she had a
4
Document Page
positive test result.
P ( subject uses drugs| positive test result ) = 8
18 = 4
9 =0.44
5
chevron_up_icon
1 out of 6
circle_padding
hide_on_mobile
zoom_out_icon
[object Object]