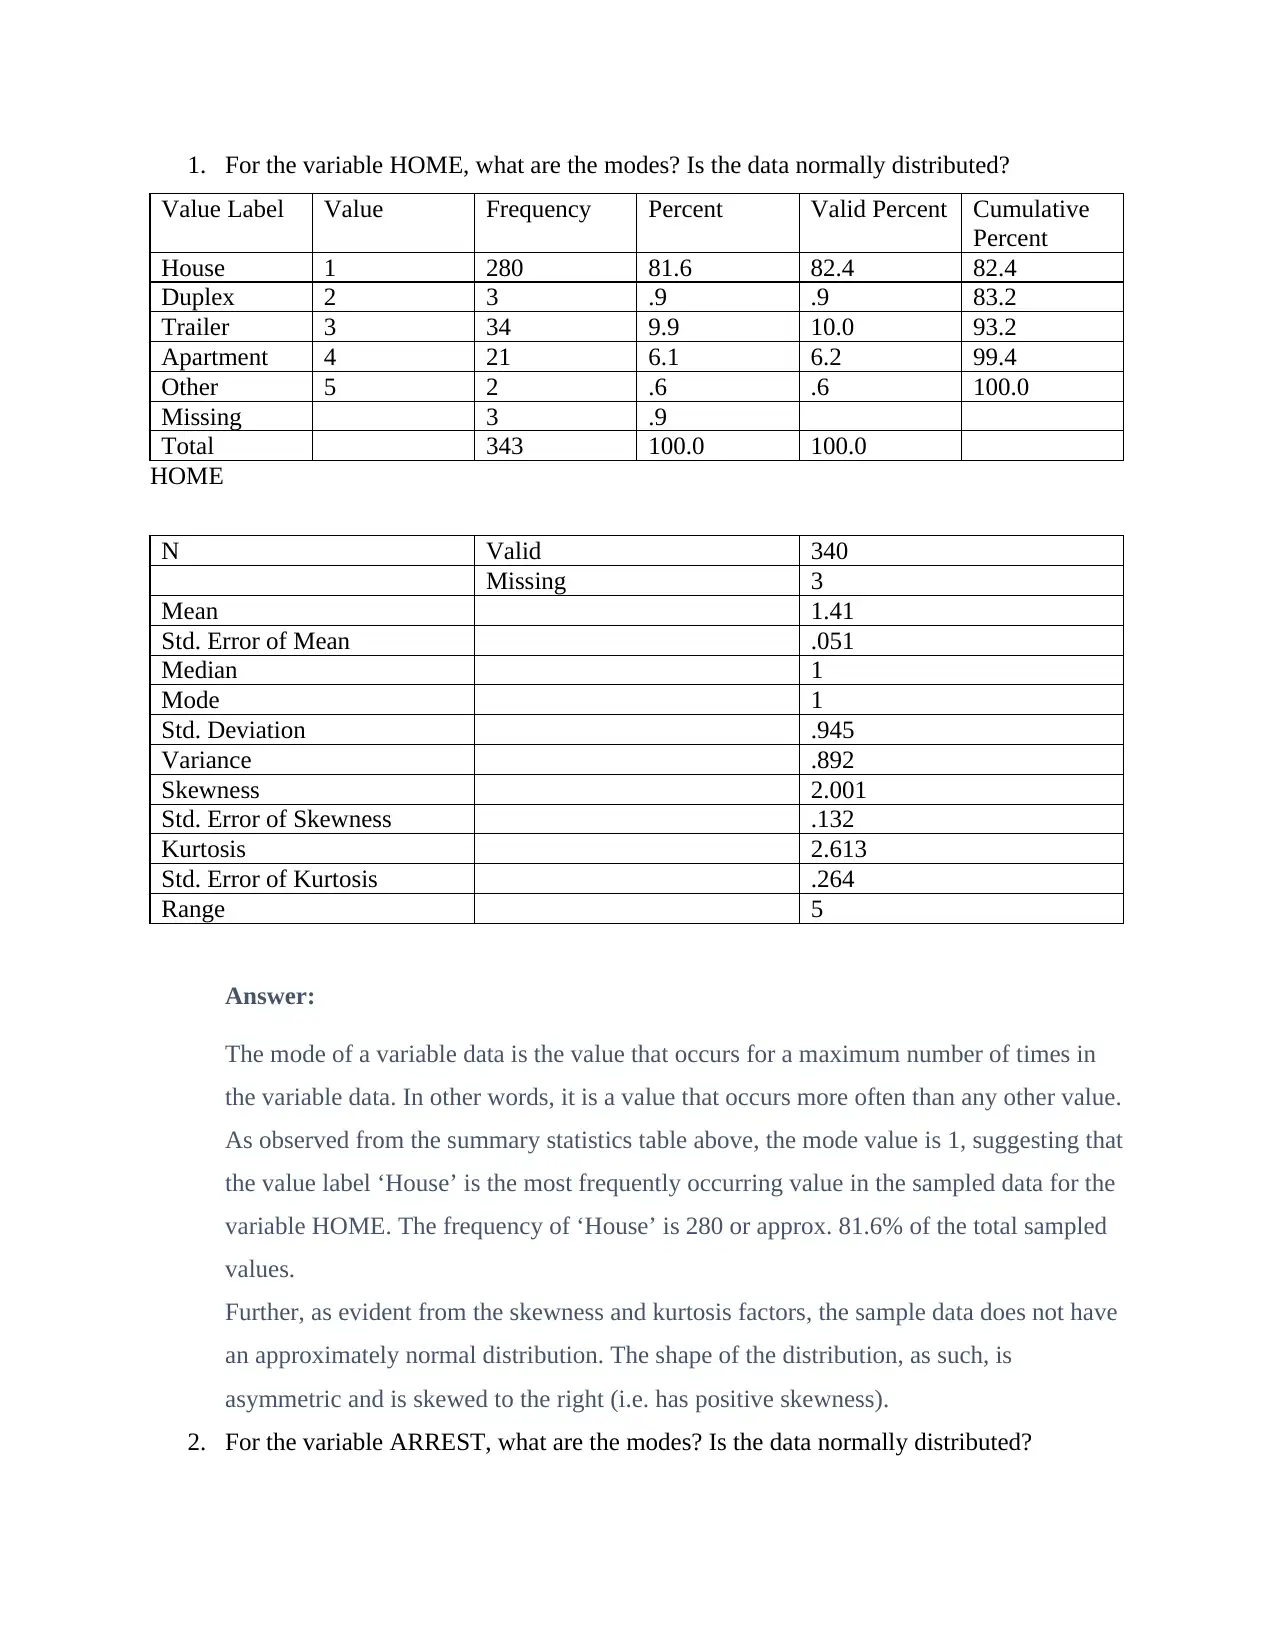
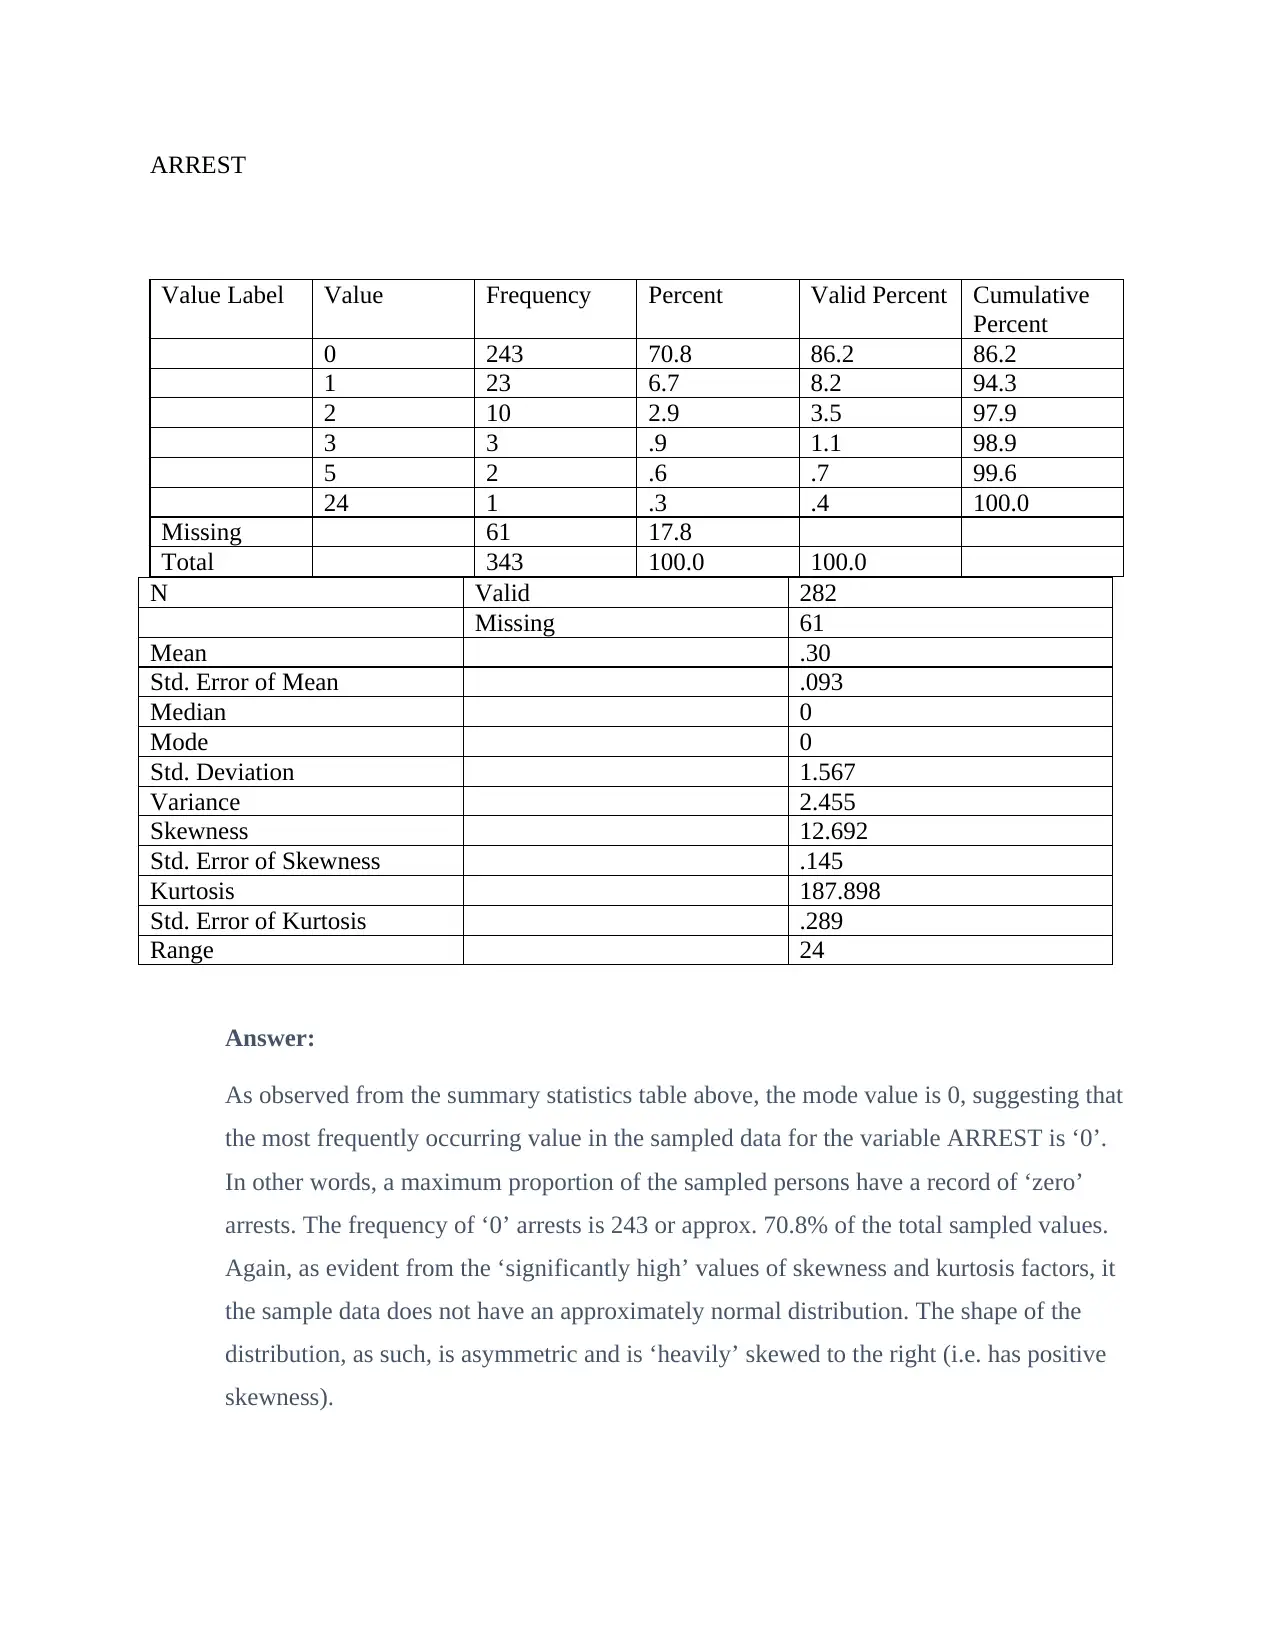
Data Analysis Assignment: HOME, ARREST Variable Modes & Normality

Verified

Added on  2020/05/11

|3
|616
|201
Homework Assignment
AI Summary
This document presents a statistical analysis of two variables, HOME and ARREST, assessing their modes and distribution characteristics. The analysis determines the mode for both variables by examining frequency distributions, revealing that 'House' is the most frequent value for HOME and '0' arrests is the most frequent value for ARREST. The document further investigates whether the data is normally distributed, using skewness and kurtosis factors to conclude that neither variable exhibits a normal distribution. The implications of non-normality are discussed, emphasizing the limitations on statistical tests and inferences that can be reliably drawn from the data. The solution provides a clear and concise explanation of these statistical concepts, supported by data from the assignment.
tabler-icon-diamond-filled.svg

Contribute Materials

Your contribution can guide someone’s learning journey. Share your documents today.
Document Page
1. For the variable HOME, what are the modes? Is the data normally distributed?
Value Label Value Frequency Percent Valid Percent Cumulative
Percent
House 1 280 81.6 82.4 82.4
Duplex 2 3 .9 .9 83.2
Trailer 3 34 9.9 10.0 93.2
Apartment 4 21 6.1 6.2 99.4
Other 5 2 .6 .6 100.0
Missing 3 .9
Total 343 100.0 100.0
HOME
N Valid 340
Missing 3
Mean 1.41
Std. Error of Mean .051
Median 1
Mode 1
Std. Deviation .945
Variance .892
Skewness 2.001
Std. Error of Skewness .132
Kurtosis 2.613
Std. Error of Kurtosis .264
Range 5
Answer:
The mode of a variable data is the value that occurs for a maximum number of times in
the variable data. In other words, it is a value that occurs more often than any other value.
As observed from the summary statistics table above, the mode value is 1, suggesting that
the value label ‘House’ is the most frequently occurring value in the sampled data for the
variable HOME. The frequency of ‘House’ is 280 or approx. 81.6% of the total sampled
values.
Further, as evident from the skewness and kurtosis factors, the sample data does not have
an approximately normal distribution. The shape of the distribution, as such, is
asymmetric and is skewed to the right (i.e. has positive skewness).
2. For the variable ARREST, what are the modes? Is the data normally distributed?
tabler-icon-diamond-filled.svg

Secure Best Marks with AI Grader

Need help grading? Try our AI Grader for instant feedback on your assignments.
Document Page
ARREST
Value Label Value Frequency Percent Valid Percent Cumulative
Percent
0 243 70.8 86.2 86.2
1 23 6.7 8.2 94.3
2 10 2.9 3.5 97.9
3 3 .9 1.1 98.9
5 2 .6 .7 99.6
24 1 .3 .4 100.0
Missing 61 17.8
Total 343 100.0 100.0
N Valid 282
Missing 61
Mean .30
Std. Error of Mean .093
Median 0
Mode 0
Std. Deviation 1.567
Variance 2.455
Skewness 12.692
Std. Error of Skewness .145
Kurtosis 187.898
Std. Error of Kurtosis .289
Range 24
Answer:
As observed from the summary statistics table above, the mode value is 0, suggesting that
the most frequently occurring value in the sampled data for the variable ARREST is ‘0’.
In other words, a maximum proportion of the sampled persons have a record of ‘zero’
arrests. The frequency of ‘0’ arrests is 243 or approx. 70.8% of the total sampled values.
Again, as evident from the ‘significantly high’ values of skewness and kurtosis factors, it
the sample data does not have an approximately normal distribution. The shape of the
distribution, as such, is asymmetric and is ‘heavily’ skewed to the right (i.e. has positive
skewness).
Document Page
3. What difference does it make in the case of each of the variables (HOME and ARREST) if the
data is not normally distributed?
Answer:
In case, each of the variables (HOME and ARREST) is not normally distributed, the variable
data cannot be used to perform any statistical tests, or as such, draw any reliable conclusions
using the descriptive summary for the sample data or for the general population (in concern).
Moreover, the techniques of statistical inference cannot be used in such cases as it is very likely
that the sample data is not a true representation of the broader population and thus, can lead to
wrong interpretations of results.
chevron_up_icon
1 out of 3
circle_padding
hide_on_mobile
zoom_out_icon
logo.png

Your All-in-One AI-Powered Toolkit for Academic Success.

Available 24*7 on WhatsApp / Email

[object Object]