Report on Statistical Analysis of Superstitious Beliefs with SPSS
VerifiedAdded on 2023/06/12
|26
|2305
|70
Report
AI Summary
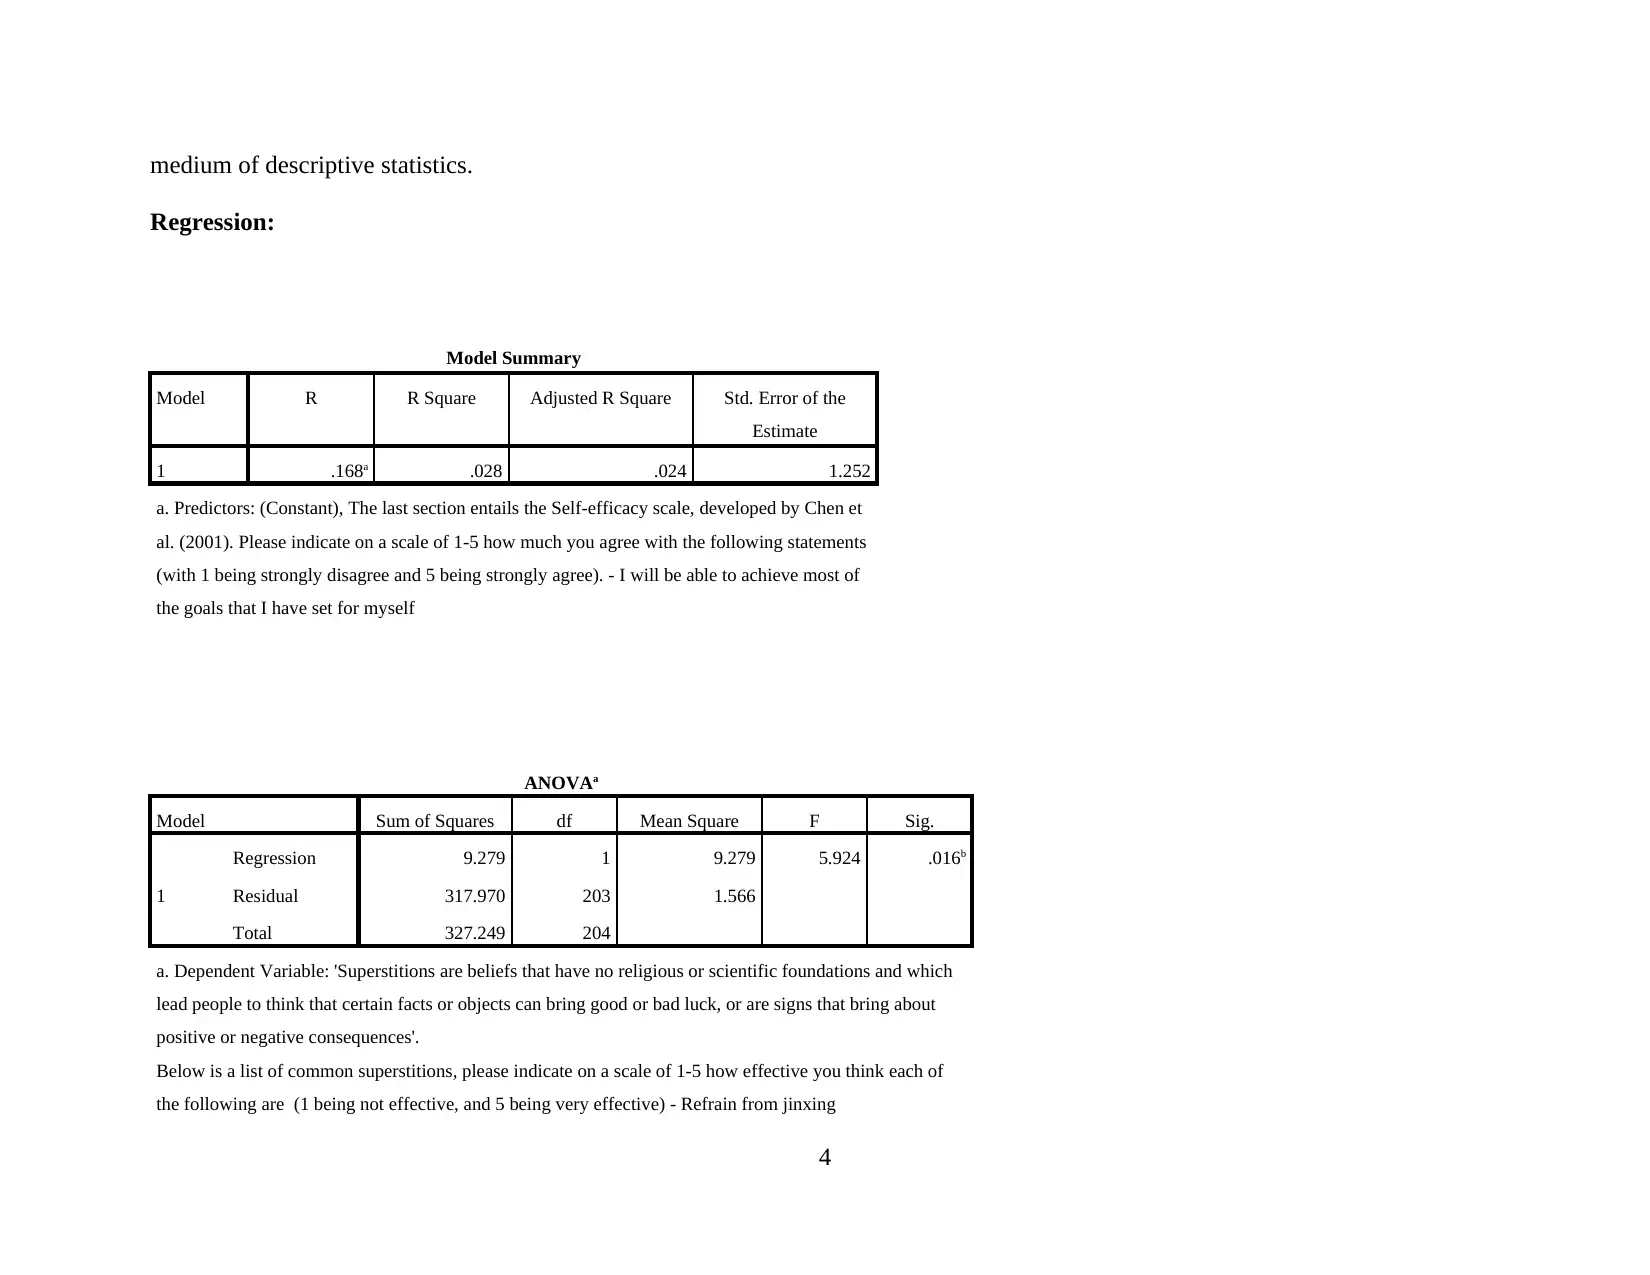
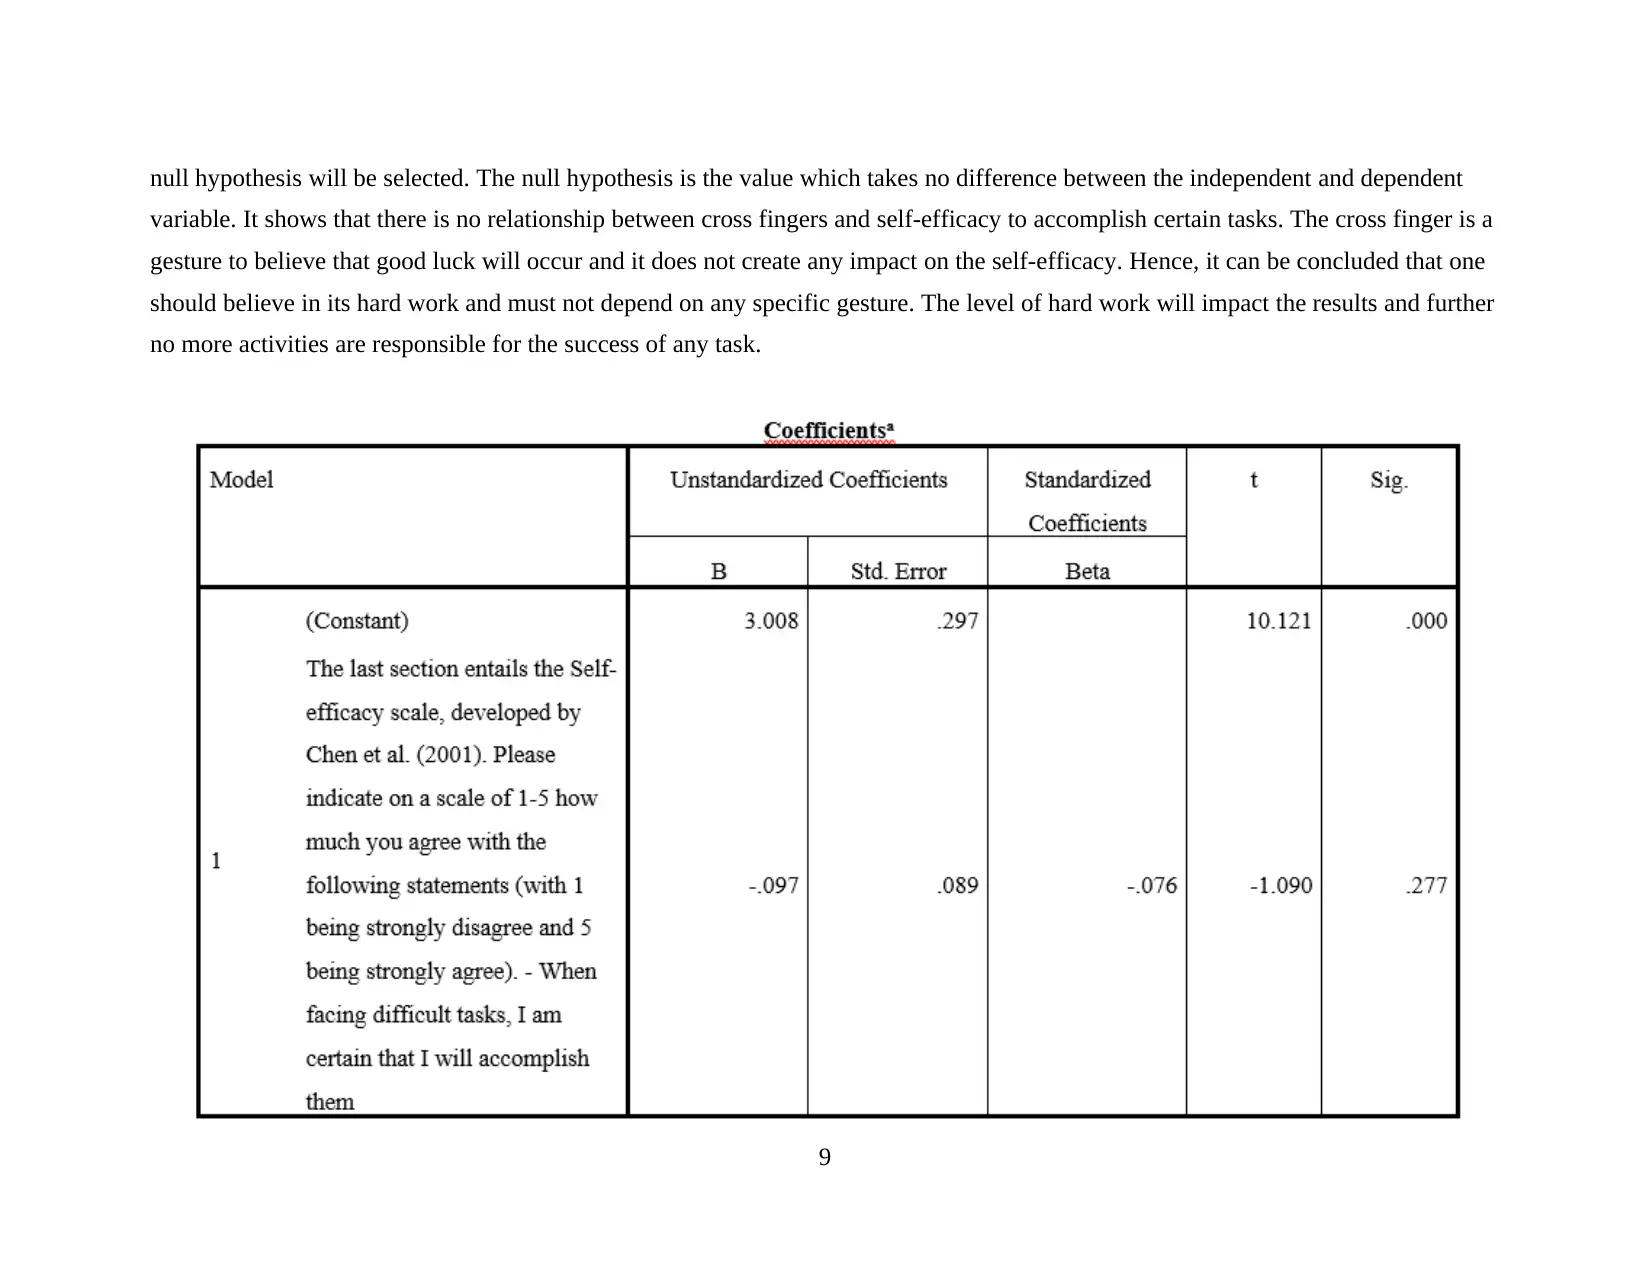
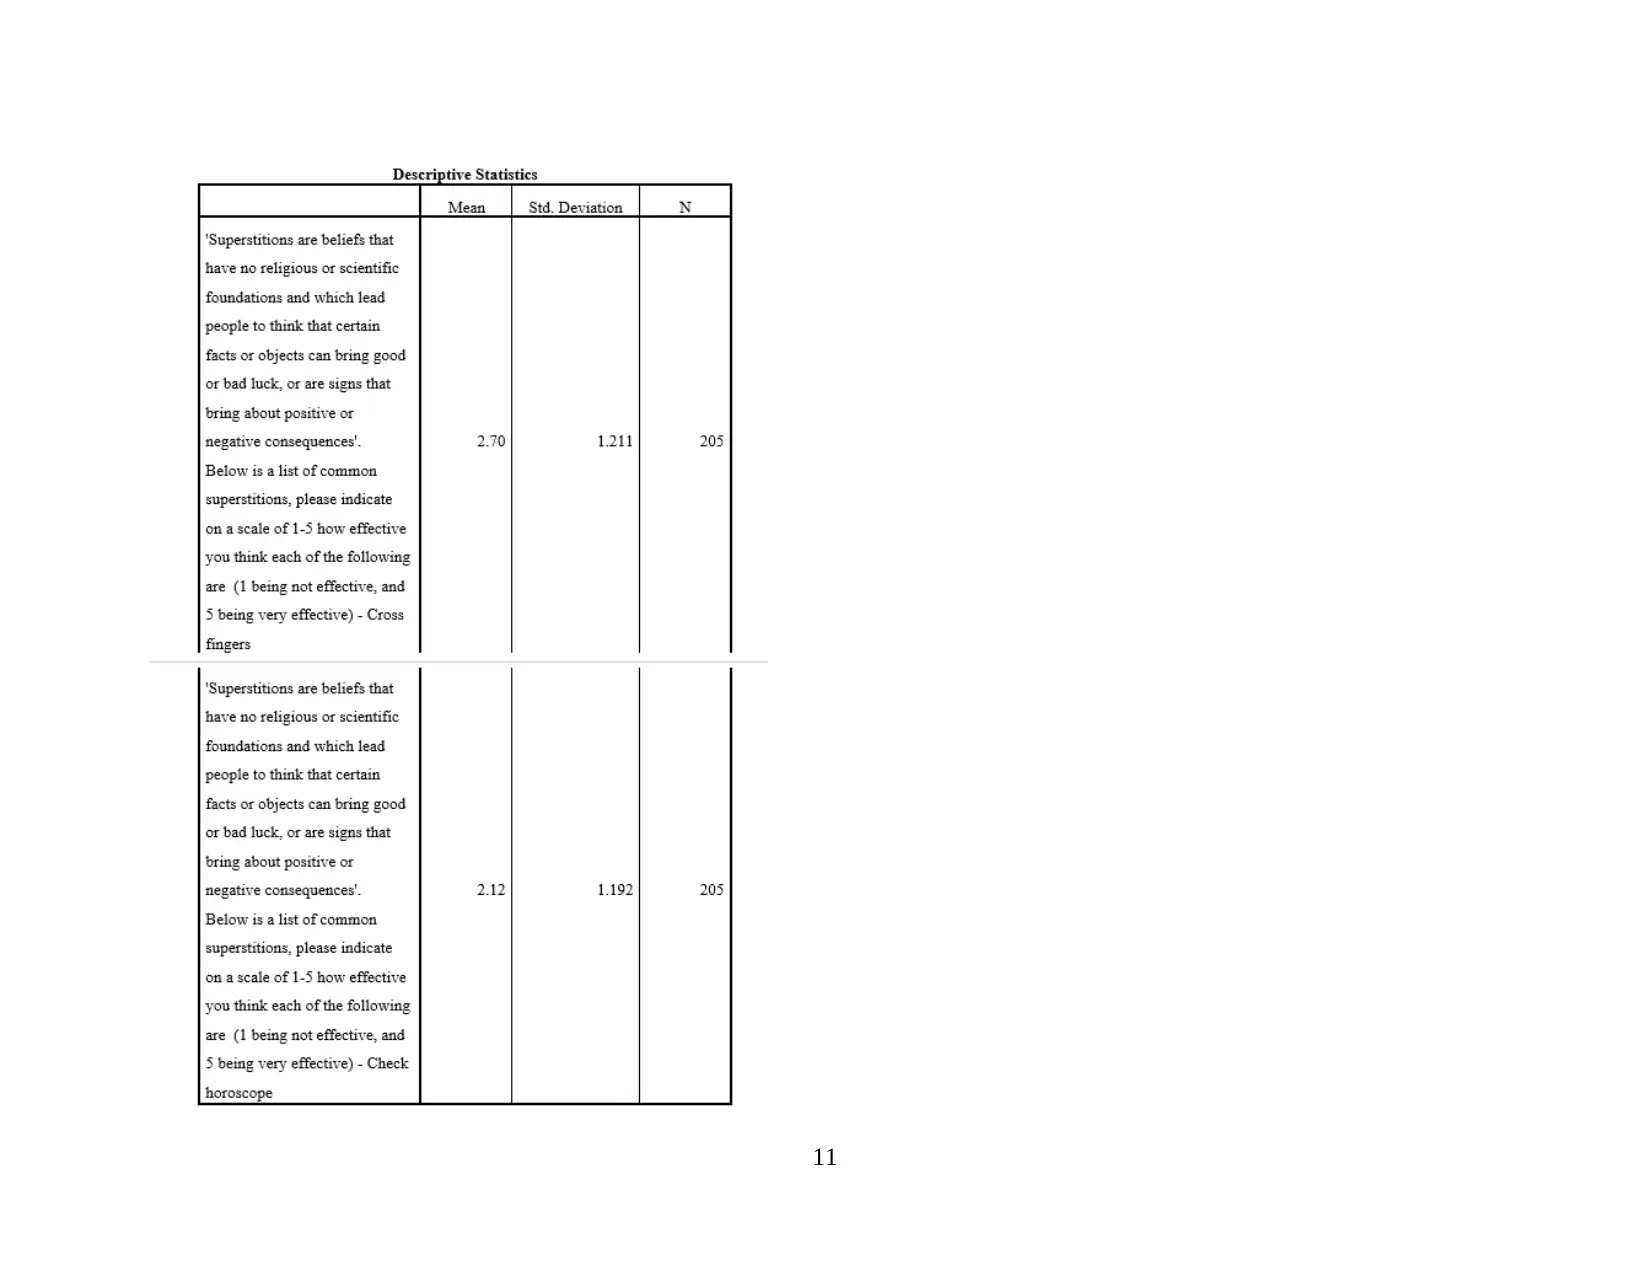
This report explores the relationship between superstitious beliefs and self-efficacy using SPSS. The study employs descriptive statistics, regression analysis, ANOVA, and correlation tests to analyze data collected from a questionnaire. The findings reveal varying degrees of association between specific superstitious beliefs (such as refraining from jinxing, crossing fingers, and checking horoscopes) and self-efficacy. The report interprets the statistical significance of these relationships, discussing whether null or alternate hypotheses are supported by the data. The conclusion emphasizes the role of SPSS in simplifying statistical analysis and highlights the importance of hard work and preparation over reliance on superstitious rituals for achieving goals. The report provides valuable insights into the interplay between psychological beliefs and personal effectiveness, with references to relevant academic literature.
Contribute Materials
Your contribution can guide someone’s learning journey. Share your
documents today.

Rubric
Secure Best Marks with AI Grader
Need help grading? Try our AI Grader for instant feedback on your assignments.

Contents
ABSTRACT.....................................................................................................................................2
INTRODUCTION...........................................................................................................................3
MAIN BODY...................................................................................................................................3
Method....................................................................................................................................3
Participants.............................................................................................................................3
Design.....................................................................................................................................3
Measures.................................................................................................................................3
Procedure................................................................................................................................3
Results....................................................................................................................................3
CONCLUSION..............................................................................................................................15
REFERENCES..............................................................................................................................16
APPENDIX....................................................................................................................................17
1

ABSTRACT
The study is conducted for the superstitious beliefs that are carried on with the students and how they appear and reflect in their
behaviour. Various type of hypothesis is formed according to the data given and then the various type of tests is performed
accordingly.
2
The study is conducted for the superstitious beliefs that are carried on with the students and how they appear and reflect in their
behaviour. Various type of hypothesis is formed according to the data given and then the various type of tests is performed
accordingly.
2

INTRODUCTION
SPSS stands for statistical package for social science. It is a software which is used to perform the complex calculations of
statistics. The statistics is divided into two parts: descriptive statistics and inferential statistics. The descriptive statistics includes
mean, mode and median. On the other hand, inferential statistics includes various parametric and non-parametric tests such as t-test,
ANOVA, correlation and regression (Abu-Bader, and Jones, 2021). This report includes the data about superstitious beliefs which
includes various activities such as refrain from jinxing, cross fingers and repeating a particular phase. It also includes the self-
efficiency scale. According to the data, hypothesis is framed and inferential test are performed.
MAIN BODY
Method
Participants
The participants of conducting and filling the questionnaire for the quantitative research in this study for the superstitious
beliefs are conducted for carrying out the students answer to the superstitious beliefs. This practice is ths formed for the academic
investigator and determining the orthodox behaviours of the students.
Design
In the below report the design is used in the format of table, which will be helpful for carrying out and figuring the results and
outcomes of the tests and the hypothesis.
Measures
In the report the stimuli are the student’s behaviour and the attitude of the students for answering the questions of the study.
The measure could be the primary or secondary. The secondary approach is used from the previous studies and researches that are
conducted on the similar kind of study and the outcome is prepared accordingly. Also give a summary for the studies that are
conducted previously.
Procedure
Procedure could be related to the design and structure of the study. It helps in determining the outcomes of what the students
think of the test and the hypothesis formed. The results could either be positive or negative. Accordingly, the results are framed.
Results
Descriptive Statistics:
The descriptive statistics of the data which has been computed through the medium of SPSS results in that usually the third
option has been selected by the respondents. It tells about the frequencies and various statistical functions are discussed through the
3
Secure Best Marks with AI Grader
Need help grading? Try our AI Grader for instant feedback on your assignments.

medium of descriptive statistics.
Regression:
Model Summary
Model R R Square Adjusted R Square Std. Error of the
Estimate
1 .168a .028 .024 1.252
a. Predictors: (Constant), The last section entails the Self-efficacy scale, developed by Chen et
al. (2001). Please indicate on a scale of 1-5 how much you agree with the following statements
(with 1 being strongly disagree and 5 being strongly agree). - I will be able to achieve most of
the goals that I have set for myself
ANOVAa
Model Sum of Squares df Mean Square F Sig.
1
Regression 9.279 1 9.279 5.924 .016b
Residual 317.970 203 1.566
Total 327.249 204
a. Dependent Variable: 'Superstitions are beliefs that have no religious or scientific foundations and which
lead people to think that certain facts or objects can bring good or bad luck, or are signs that bring about
positive or negative consequences'.
Below is a list of common superstitions, please indicate on a scale of 1-5 how effective you think each of
the following are (1 being not effective, and 5 being very effective) - Refrain from jinxing
4

b. Predictors: (Constant), The last section entails the Self-efficacy scale, developed by Chen et al. (2001).
Please indicate on a scale of 1-5 how much you agree with the following statements (with 1 being strongly
disagree and 5 being strongly agree). - I will be able to achieve most of the goals that I have set for myself
H0 (Null Hypothesis): There is no significant relationship between superstitious beliefs of jinxing and self-efficacy of an individual.
H1 (alternate Hypothesis): There is significant relationship between superstitious beliefs of jinxing and self-efficacy of an individual.
Interpretation: From the above prepared statistical table it can be interpreted that regression model applied on the factors that possess
dependent and independent nature in SPSS it can be observed that correlation between the influence of the factors is very less and the
significance value recorded is .016 which is more than 0.05 thus alternate hypothesis would be selected. It helps to understand related
effect observed of superstitious beliefs in relation with certain related facts, objects that would bring good luck or bad luck. It helps to
predict on the scale of 1 to 5 as what would be the related impact and whether there is any significant association present between
superstition beliefs in relation to refrain from jinxing and if a respected person would be able to achieve goals by him/her for
himself/herself. It is thus observed that there is significant association present between the dependent & independent variables present.
Therefore, the scale provided ranging from 1 to 5 where 1 indicates being not effective and 5 represents being very effective in case of
refrain whereas in case of self-efficacy scale 1 reflects strong disagreement and 5 depicts strong agreement in table.
5

6
Paraphrase This Document
Need a fresh take? Get an instant paraphrase of this document with our AI Paraphraser

7

2. H0 (null hypothesis)- There is no significant relationship between the superstitious belief of cross fingers and self-efficacy to
accomplish certain difficult task.
H1 (alternate hypothesis)- There is significant relationship between the superstitious belief of cross fingers and self-efficacy to
accomplish certain difficult task.
Interpretation: The above table shows the relationship between superstitious belief and self-efficacy to achieve a specific task. The r
value denotes the relationship between null and alternate hypothesis. There is high correlation between the variables. The value of r2
denotes the coefficient of determination, it is computed at 0.006. In the above scenario, the test of regression is being performed. The
significant difference is 0.016. It shows the level of acceptance of null hypothesis. The value is less than the 0.05 which shows that
8
accomplish certain difficult task.
H1 (alternate hypothesis)- There is significant relationship between the superstitious belief of cross fingers and self-efficacy to
accomplish certain difficult task.
Interpretation: The above table shows the relationship between superstitious belief and self-efficacy to achieve a specific task. The r
value denotes the relationship between null and alternate hypothesis. There is high correlation between the variables. The value of r2
denotes the coefficient of determination, it is computed at 0.006. In the above scenario, the test of regression is being performed. The
significant difference is 0.016. It shows the level of acceptance of null hypothesis. The value is less than the 0.05 which shows that
8

null hypothesis will be selected. The null hypothesis is the value which takes no difference between the independent and dependent
variable. It shows that there is no relationship between cross fingers and self-efficacy to accomplish certain tasks. The cross finger is a
gesture to believe that good luck will occur and it does not create any impact on the self-efficacy. Hence, it can be concluded that one
should believe in its hard work and must not depend on any specific gesture. The level of hard work will impact the results and further
no more activities are responsible for the success of any task.
9
Secure Best Marks with AI Grader
Need help grading? Try our AI Grader for instant feedback on your assignments.

3.H0: There is no significant relationship between superstitious belief of cross fingers and bad luck& good luck.
H1: There is significant relationship between superstitious belief of cross fingers and bad luck& good luck.
Interpretation: The above table shows the significant relationship between superstitious belief of cross finger& good luck and bad
luck. The test performed in the above table is ANOVA. It is used to monitor the means of two or more groups and how significantly
are both the variables related to each other. The significance value for the above table is 0.277 which is more than the p value.
Therefore, the alternate hypothesis is to be selected. It simply depicts that there is significant relationship between cross fingers and
good luck & bad luck. Most of the respondents believe that there is relationship between both the variables.
Correlation
10

11

4.Correlation
H0: There is no relationship between superstitious belief of checking horoscope and wearing a luck object for improving the future.
H1: There is a relationship between superstitious belief of checking horoscope and wearing a luck object for improving the future.
Interpretation: From the above prepared table it can be interpreted that the value observed by developed statistical table for calculating
the efficient association between variables such as checking horoscope and wearing an object that would improve their future related
aspects situations and conditions is .392. It helps to calculate and predict significant relationship thus the value is more than .05 which
is less than .392 hence it can be seen that the alternative hypothesis would be selected. It is thus believed that wearing something such
as any lucky object or a thing that would make you believe that it would help to predict horoscope.
12
Paraphrase This Document
Need a fresh take? Get an instant paraphrase of this document with our AI Paraphraser

13

5. Ho (Null hypothesis) - There is no significant relationship between ritual or charm and goals they set for themselves.
H1(Alternate hypothesis): There is significant relationship between ritual or charm and goals they set for themselves.
Interpretation: From the above asserted table it can be interpreted that there is a significant relationship present between ritual and
14
H1(Alternate hypothesis): There is significant relationship between ritual or charm and goals they set for themselves.
Interpretation: From the above asserted table it can be interpreted that there is a significant relationship present between ritual and
14

charms & goals the reason being that significance value observed so far is recorded to be more than .05. Therefore, alternate
hypothesis would be selected as it proves that there is significant association present between the two factors taken in account. It is
hence recorded at .380 that is more than .05. Hence it is said that there is no role of superstitious activities according to the knowledge
possessed by us and the hard work would only contribute for achieving good marks and maintaining a better grading system. If
someone is well prepared before entering the exam hall it is possible that he/she won’t be needing any beliefs in such activities
whereas for having a positive mindset and belief that is developed by family person it might serve as a better tool for achieving better
scores and grades. It is also recommended that there is no charm or ritual that would help to get marks if one is not well prepared for
examinations thus it is essential for individuals to trust their hard work and prepare well in advance that would be helpful in long run
and getting better market opportunities too. It is hence observed that one who has believe in themselves and has better knowledge and
practices in the information gained and practiced he/she would attain good marks and results.
CONCLUSION
From the above report, it can be concluded that SPSS is a software which reduces the time and efforts of various researchers. It
assists in performing the tests which helps to know the relationships between dependent and independent variables. The test performed
in the above report are ANOVA, regression, t- test and correlation. The different test applied are according to the varied situations.
There are different types of t-test such as independent t-test, paired sample t-test and one sample t-test. The regression test is applied
when there are various independent variables and one dependent variable. Therefore, different inferential test can be applied according
to different situations.
15
Secure Best Marks with AI Grader
Need help grading? Try our AI Grader for instant feedback on your assignments.

REFERENCES
Books and Journals
Abu-Bader, S. and Jones, T.V., 2021. Statistical mediation analysis using the sobel test and hayes SPSS process macro. International
Journal of Quantitative and Qualitative Research Methods.
Alvarez, M.R., Baños, R.V. and Fonseca, M.T., 2018. Using SPSS to interpret the relationship between two variables according to
measurement scale. Revista d'Innovació i Recerca en Educació, 11(2), p.45.
Anwar, H., and et.al., 2017. Alginate-polyvinyl alcohol based interpenetrating polymer network for prolonged drug therapy,
optimization and in-vitro characterization. Carbohydrate polymers, 166, pp.183-194.
Han, X., 2021, February. An Automated Time Series Modeling and Forecasting Approach based on SPSS Statistics. In 2021 The 5th
International Conference on Compute and Data Analysis (pp. 73-78).
Jiang, Y., and et.al., 2017. Plant cultivars imprint the rhizosphere bacterial community composition and association networks. Soil
Biology and Biochemistry, 109, pp.145-155.
Kaurav, R.P.S., Gursoy, D. and Chowdhary, N. eds., 2021. An SPSS Guide for Tourism, Hospitality and Events Researchers.
Routledge.
Pasaribu, E.Z., and et.al., 2020. Belajar Statistika: Siapa Takut dengan SPSS. Yayasan Kita Menulis.
Su, X., and et.al., , 2019. Effect of organic acids on bread quality improvement. Food chemistry, 278, pp.267-275.
Wagner III, W.E., 2019. Using IBM® SPSS® statistics for research methods and social science statistics. Sage Publications.
Zakariah, M.A. and Afriani, V., 2021. ANALISIS STATISTIK DENGAN SPSS UNTUK PENELITIAN KUANTITATIF. Yayasan
Pondok Pesantren Al Mawaddah Warrahmah Kolaka.
16

APPENDIX
17
17

18
Paraphrase This Document
Need a fresh take? Get an instant paraphrase of this document with our AI Paraphraser

19

20

21
Secure Best Marks with AI Grader
Need help grading? Try our AI Grader for instant feedback on your assignments.

22

23

24
Paraphrase This Document
Need a fresh take? Get an instant paraphrase of this document with our AI Paraphraser

25
1 out of 26
Related Documents

Your All-in-One AI-Powered Toolkit for Academic Success.
+13062052269
info@desklib.com
Available 24*7 on WhatsApp / Email
Unlock your academic potential
© 2024 | Zucol Services PVT LTD | All rights reserved.