Statistical and Financial Analysis for Restaurant Chain Expansion
VerifiedAdded on 2020/01/07
|17
|3471
|455
Report
AI Summary
This report provides a detailed analysis of a restaurant chain's business performance and expansion plans. It begins with an introduction outlining the business scenario, which involves a large restaurant chain planning to open a new unit in London. The report then delves into Task 1, covering the planning and collection of primary and secondary data, including survey methodology and sampling frames. It presents a questionnaire designed to gather customer preferences. Task 2 focuses on creating and summarizing information for decision-making, analyzing results to draw valid conclusions, and using measures of dispersion, quartiles, percentiles, and correlation coefficients. The report also includes the production of graphs using spreadsheets, creating trend lines for assessing future trends, and the dissemination of information through software. Finally, it prepares a formal business report, utilizing appropriate information processing and financial tools, including a project plan for determining the critical path. The report concludes with a discussion of the findings and recommendations for the restaurant chain's expansion strategy.

BDM
Paraphrase This Document
Need a fresh take? Get an instant paraphrase of this document with our AI Paraphraser
Table of Contents
INTRODUCTION......................................................................................................................3
TASK 1......................................................................................................................................3
1.1 Planning for the collection of primary and secondary data..............................................3
1.2 Presenting survey methodology and sampling frame used..............................................3
1.3 Preparation of questionnaire............................................................................................4
2.1 Creating and summarizing information for decision making..........................................6
2.2 Analyzing results to draw valid conclusion.....................................................................7
2.3 Using measures of dispersion for decision making..........................................................9
2.4 Quartile, percentile and correlation coefficient................................................................9
TASK 2....................................................................................................................................10
3.1 Producing graphs by using spread sheet........................................................................10
3.2 Creating trend line for assessing future trends...............................................................11
3.3 Dissemination of information through software............................................................12
3.4 Preparation of formal business report............................................................................12
4.1 Using appropriate information processing tools for decision making...........................12
4.2 Preparing a project plan for determining critical path...................................................13
4.3 Using financial tools for decision making.....................................................................14
CONCLUSION........................................................................................................................15
REFERENCES.........................................................................................................................16

⊘ This is a preview!⊘
Do you want full access?
Subscribe today to unlock all pages.
Trusted by 1+ million students worldwide
INTRODUCTION
In the business organization, owner or manager has to take several decisions
regarding effective administration, fund raising, expansion etc. Moreover, any inappropriate
decision has high or negative impact on the productivity and profitability of firm. This project
report is based on the case scenario which entails that large restaurant chain is planning to
open another unit in London. Moreover, now tourism in London is increasing with the very
high pace. Further, now having parties in restaurant become the part of individuals life style.
In this, the present report will provide deeper understanding about the ways in which
statistical and financial tools helps in developing suitable framework for near future. Besides
this, it will also shed light on the project management tools such as network diagram, Gantt
chart which in turn helps in framing highly competent framework for the near future.
TASK 1
1.1 Planning for the collection of primary and secondary data
Primary data collection: Data which is gathered by scholar through the means of
survey, observation, focus group etc. is known as primary data. As the name suggests,
primary data is gathered by scholar for the first time in accordance with the research
aims and objectives. Such data is highly raw in nature and assists in presenting the fair
solution of research issue or problem. In this, to analyze the taste and preferences of
customers regarding the existing and another one research will conduct survey.
Moreover, by asking questions in relation to price, location etc. researcher would
become able to extract suitable information (Rajasekaran and et.al., 2016). Thus, for
the collection of primary data researcher will prepare questionnaire by including both
types of questions into it such as close and open ended. Thereafter, research will send
questionnaire to 20 customers of ABC restaurant which are selected from purposive
sampling technique. Hence, by following such plan primary data will be gathered by
scholar.
Secondary data collection: Books, journals and scholarly articles are the main
sources that contain valuable findings presented by other scholars through in-depth
research. Hence, to gain information about customer preferences, attitude and their
Paraphrase This Document
Need a fresh take? Get an instant paraphrase of this document with our AI Paraphraser
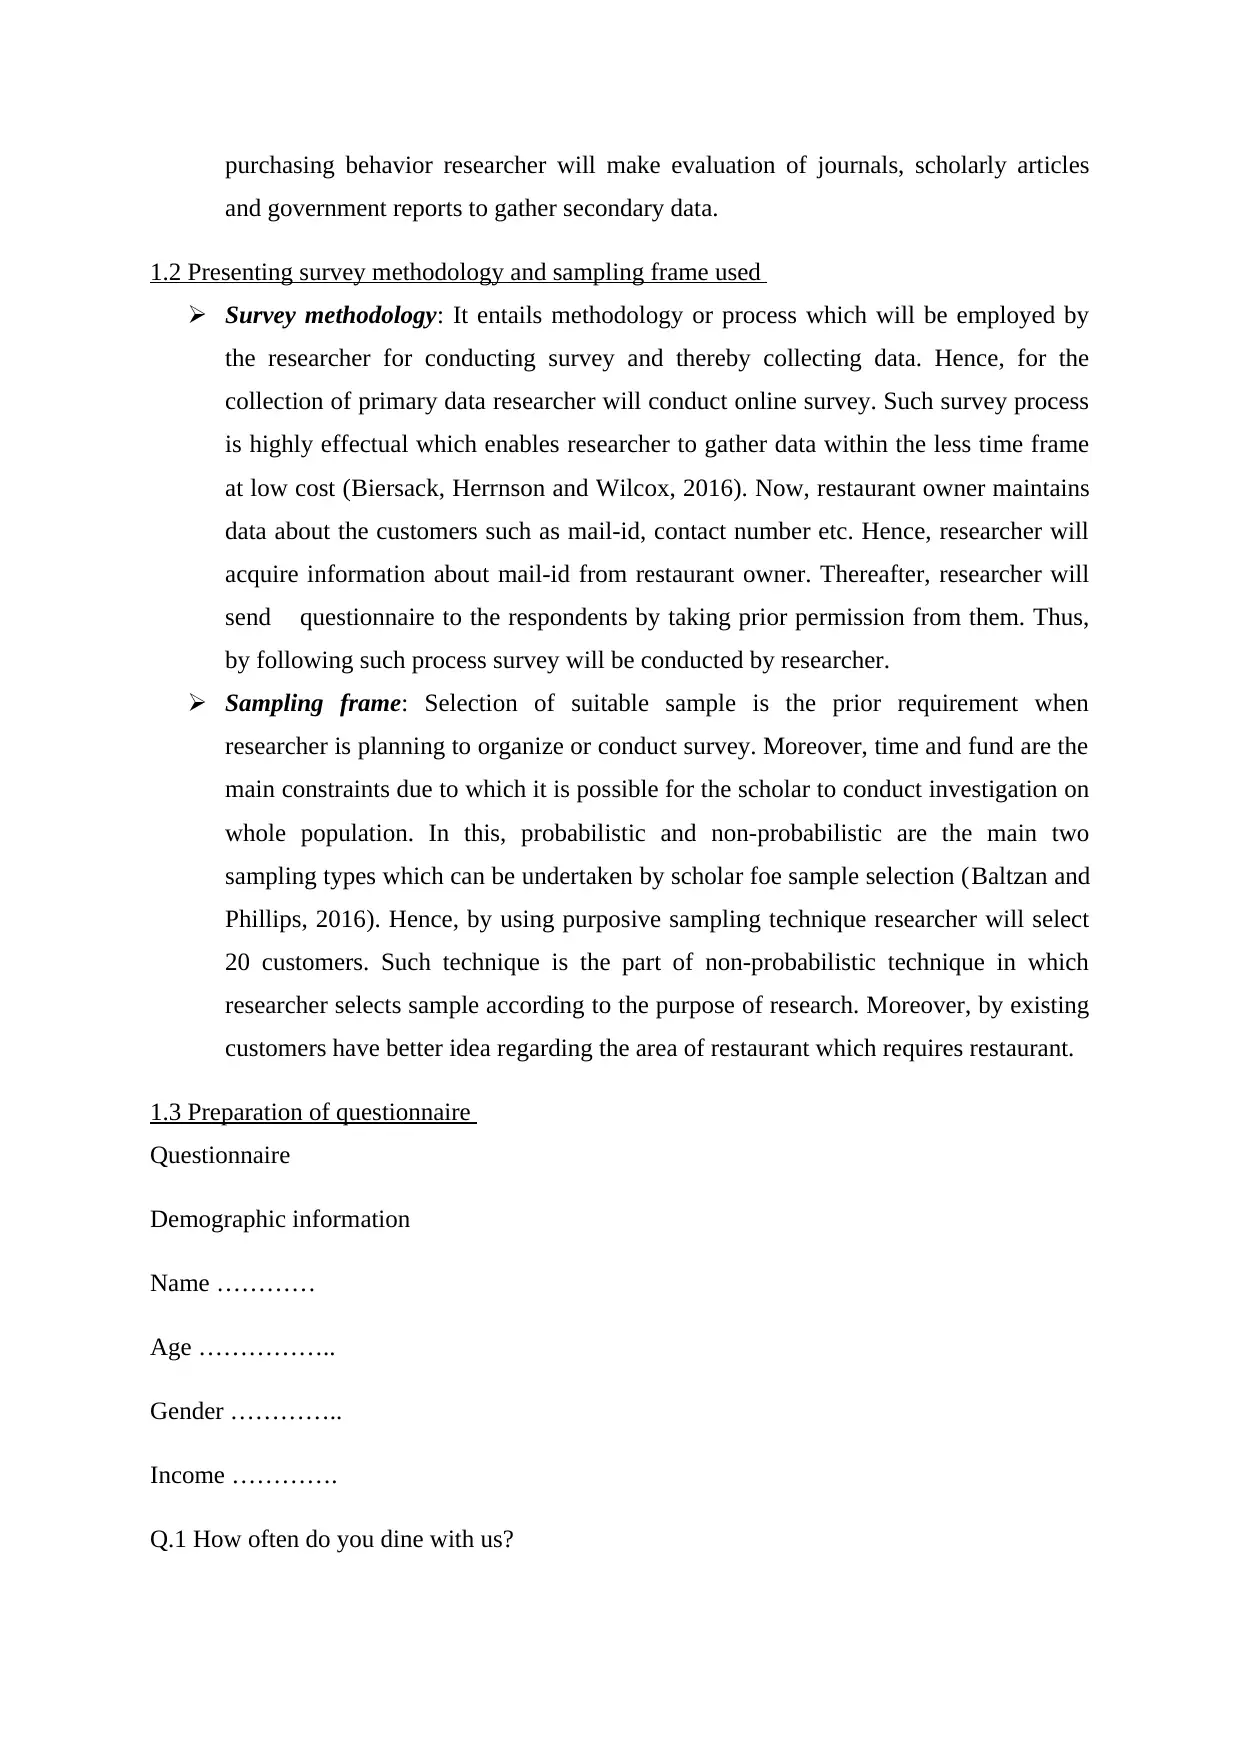
purchasing behavior researcher will make evaluation of journals, scholarly articles
and government reports to gather secondary data.
1.2 Presenting survey methodology and sampling frame used
Survey methodology: It entails methodology or process which will be employed by
the researcher for conducting survey and thereby collecting data. Hence, for the
collection of primary data researcher will conduct online survey. Such survey process
is highly effectual which enables researcher to gather data within the less time frame
at low cost (Biersack, Herrnson and Wilcox, 2016). Now, restaurant owner maintains
data about the customers such as mail-id, contact number etc. Hence, researcher will
acquire information about mail-id from restaurant owner. Thereafter, researcher will
send questionnaire to the respondents by taking prior permission from them. Thus,
by following such process survey will be conducted by researcher.
Sampling frame: Selection of suitable sample is the prior requirement when
researcher is planning to organize or conduct survey. Moreover, time and fund are the
main constraints due to which it is possible for the scholar to conduct investigation on
whole population. In this, probabilistic and non-probabilistic are the main two
sampling types which can be undertaken by scholar foe sample selection (Baltzan and
Phillips, 2016). Hence, by using purposive sampling technique researcher will select
20 customers. Such technique is the part of non-probabilistic technique in which
researcher selects sample according to the purpose of research. Moreover, by existing
customers have better idea regarding the area of restaurant which requires restaurant.
1.3 Preparation of questionnaire
Questionnaire
Demographic information
Name …………
Age ……………..
Gender …………..
Income ………….
Q.1 How often do you dine with us?
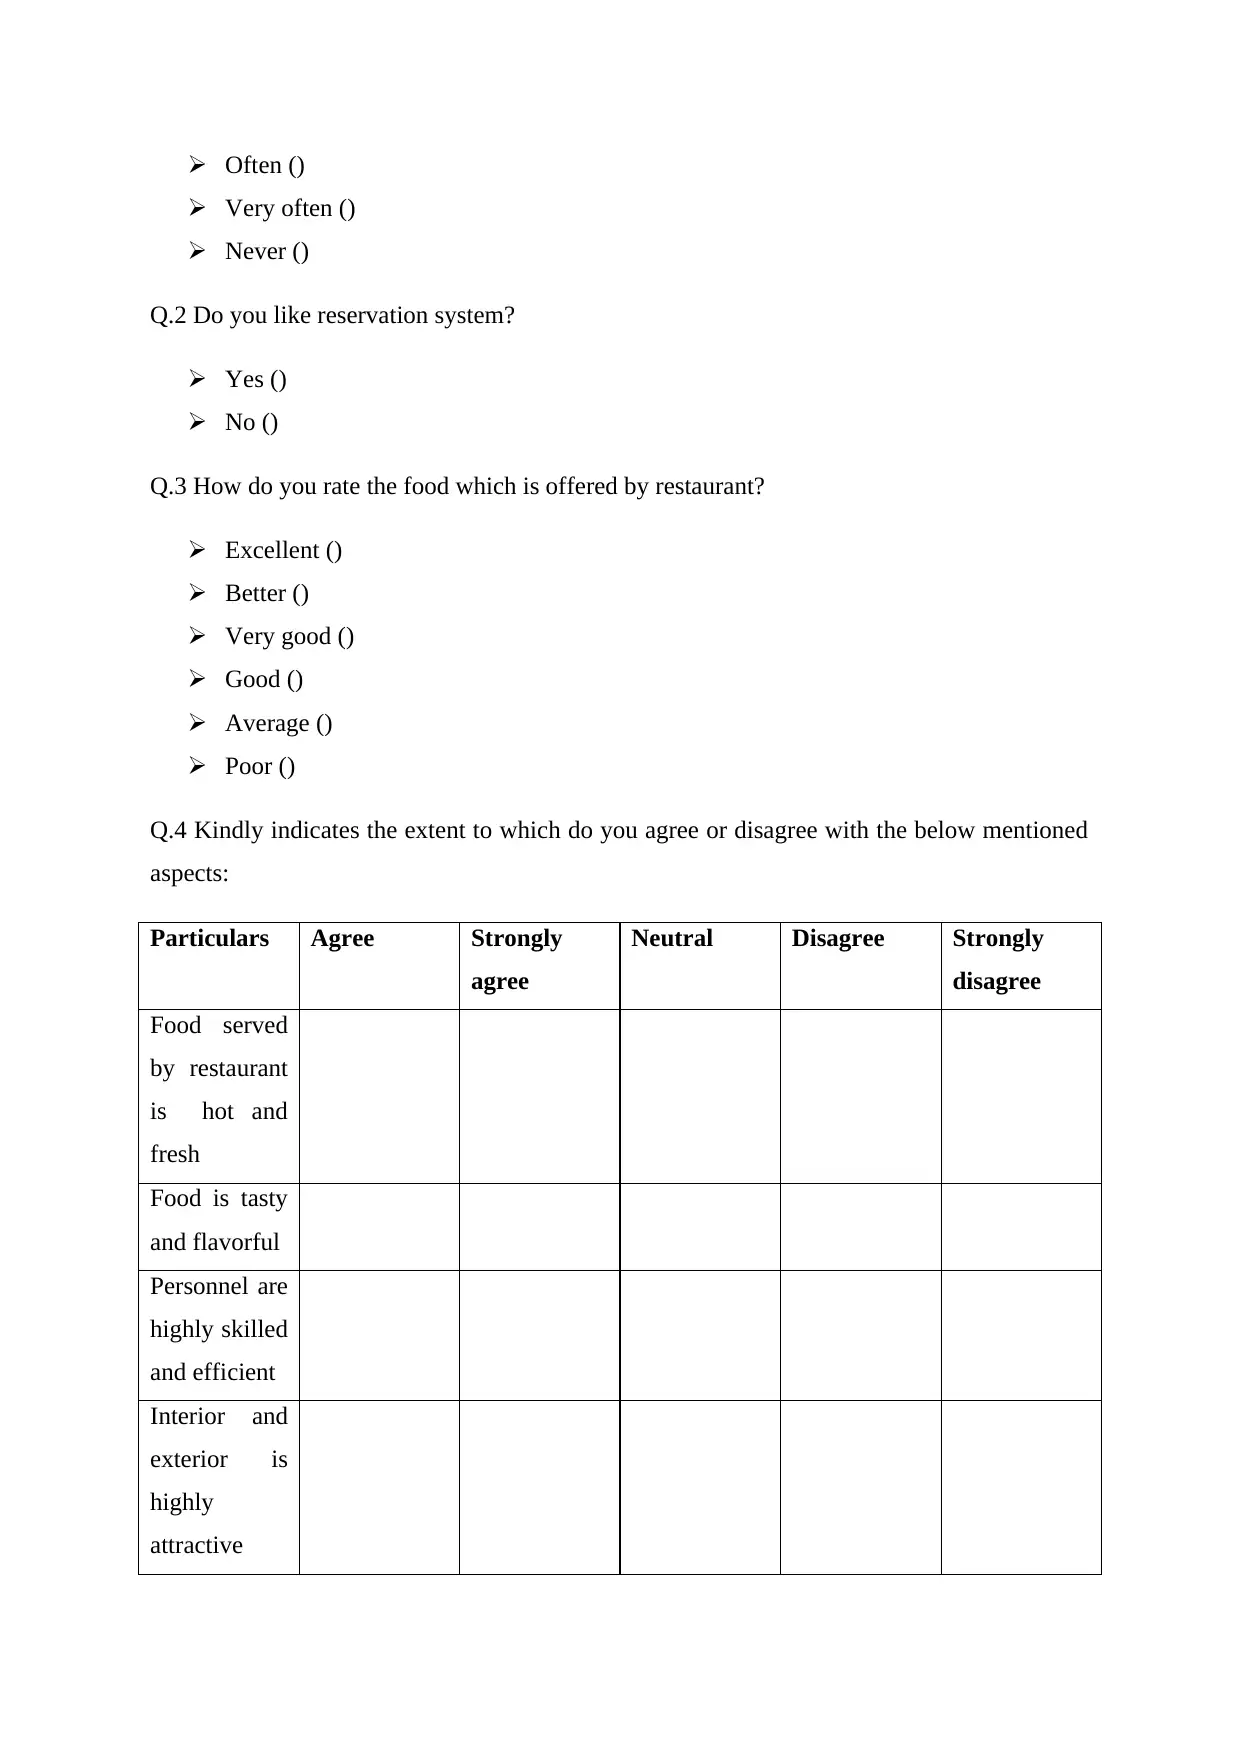
Often ()
Very often ()
Never ()
Q.2 Do you like reservation system?
Yes ()
No ()
Q.3 How do you rate the food which is offered by restaurant?
Excellent ()
Better ()
Very good ()
Good ()
Average ()
Poor ()
Q.4 Kindly indicates the extent to which do you agree or disagree with the below mentioned
aspects:
Particulars Agree Strongly
agree
Neutral Disagree Strongly
disagree
Food served
by restaurant
is hot and
fresh
Food is tasty
and flavorful
Personnel are
highly skilled
and efficient
Interior and
exterior is
highly
attractive
⊘ This is a preview!⊘
Do you want full access?
Subscribe today to unlock all pages.
Trusted by 1+ million students worldwide
Proper
hygiene is
maintained
by restaurant
Waiting time
affects your
satisfaction
level
Q.5 From the following factors which promotional medium have high level of impact on your
decision making?
Television ()
Newspaper ()
Social media ()
Q.6 Is location factor affect your decision making in relation to dine?
Yes ()
No ()
Q.7 How much do you ready to pay for the meal of two people?
£50-60
£65-80
£80-90
Q.8 Which kind of food do you like most?
……………………………………………….
Q.9 Giving recommendations for improvement ………..(Kindly clarify)
2.1 Creating and summarizing information for decision making
Sales and profit figures of large chain restaurant are enumerated below:
Years Sales Profit
2008 1100 220
Paraphrase This Document
Need a fresh take? Get an instant paraphrase of this document with our AI Paraphraser
2009 1200 240
2010 1380 276
2011 1450 284
2012 1320 250
2013 1380 264
2014 1580 275
2015 1750 290
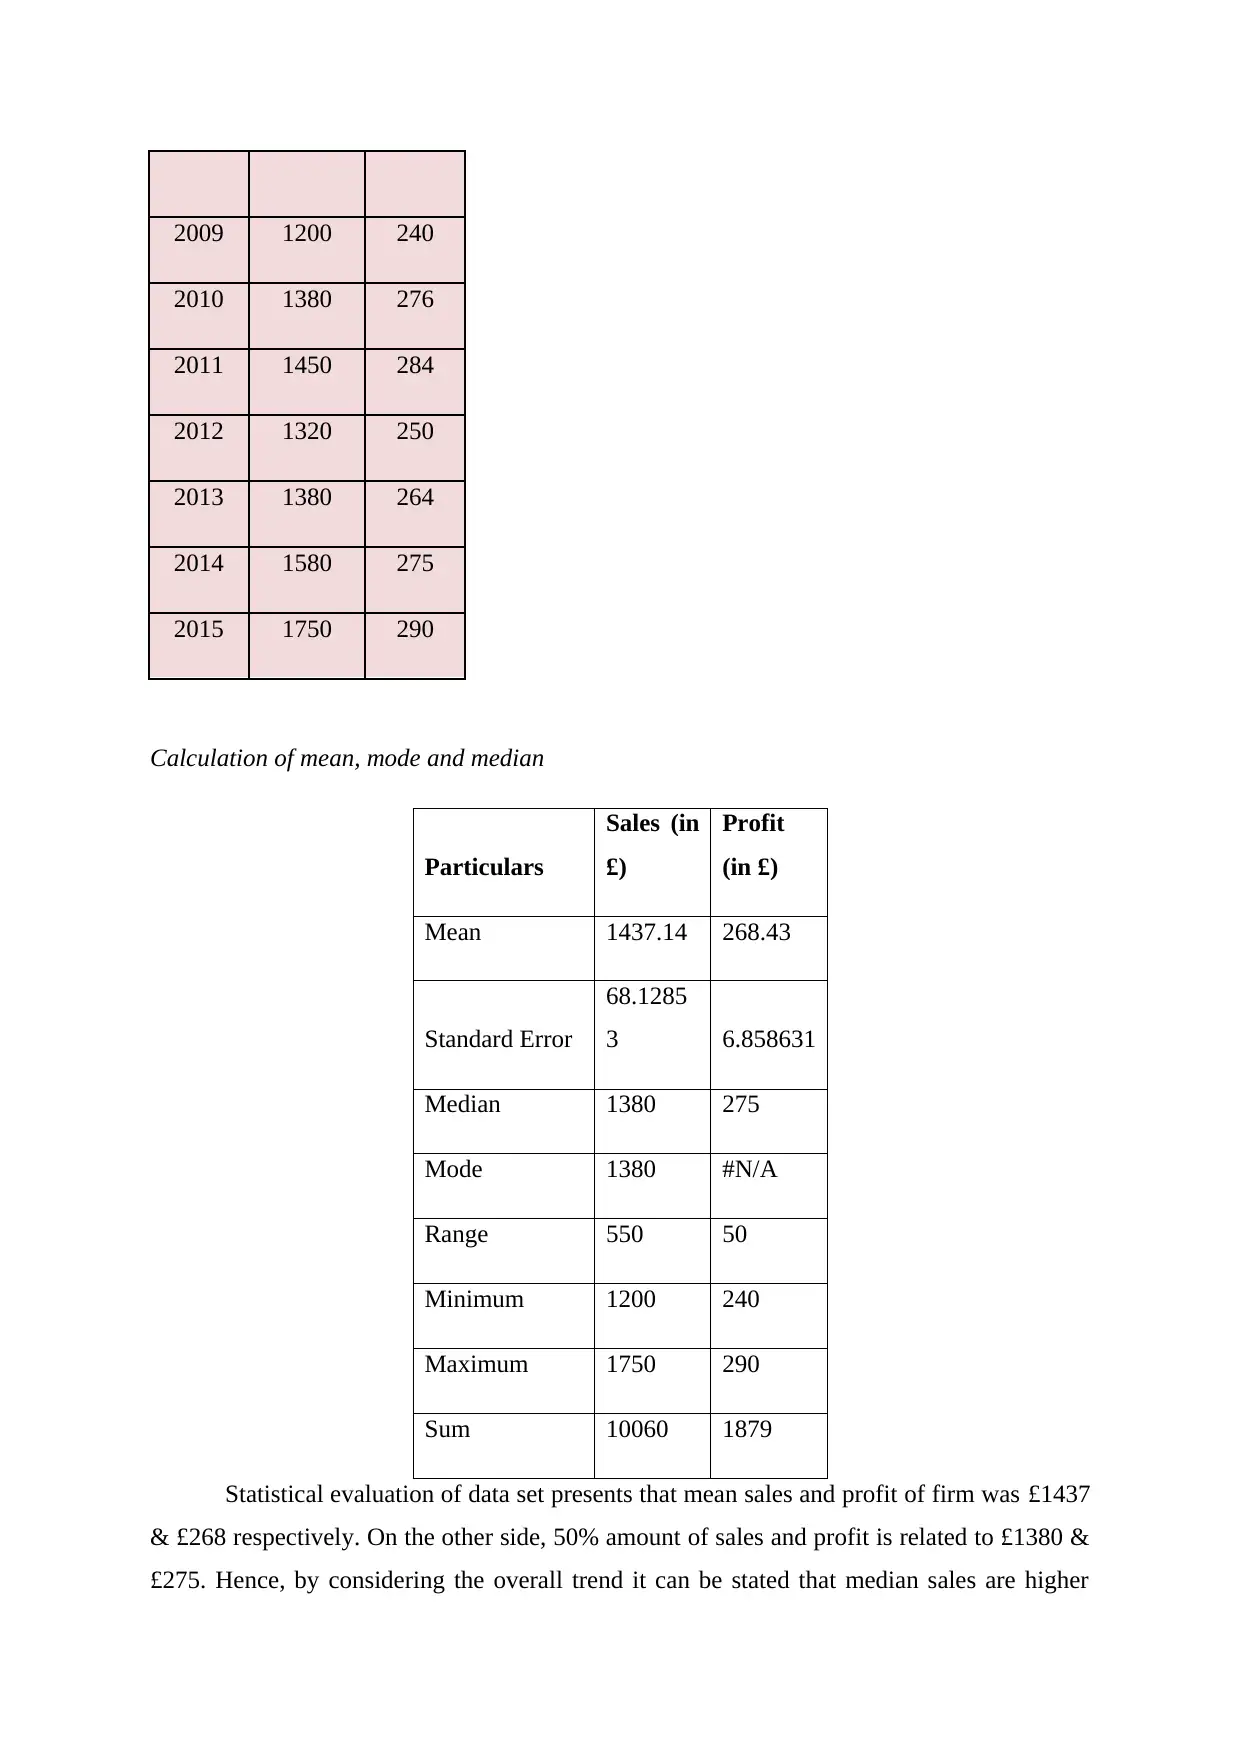
Calculation of mean, mode and median
Particulars
Sales (in
£)
Profit
(in £)
Mean 1437.14 268.43
Standard Error
68.1285
3 6.858631
Median 1380 275
Mode 1380 #N/A
Range 550 50
Minimum 1200 240
Maximum 1750 290
Sum 10060 1879
Statistical evaluation of data set presents that mean sales and profit of firm was £1437
& £268 respectively. On the other side, 50% amount of sales and profit is related to £1380 &
£275. Hence, by considering the overall trend it can be stated that median sales are higher
2010 1380 276
2011 1450 284
2012 1320 250
2013 1380 264
2014 1580 275
2015 1750 290
Calculation of mean, mode and median
Particulars
Sales (in
£)
Profit
(in £)
Mean 1437.14 268.43
Standard Error
68.1285
3 6.858631
Median 1380 275
Mode 1380 #N/A
Range 550 50
Minimum 1200 240
Maximum 1750 290
Sum 10060 1879
Statistical evaluation of data set presents that mean sales and profit of firm was £1437
& £268 respectively. On the other side, 50% amount of sales and profit is related to £1380 &
£275. Hence, by considering the overall trend it can be stated that median sales are higher
than the average amount. Hence, by undertaking significant measure or action restaurant unit
can increase its sales and profit level.
2.2 Analyzing results to draw valid conclusion
Outcome of primary of data investigation
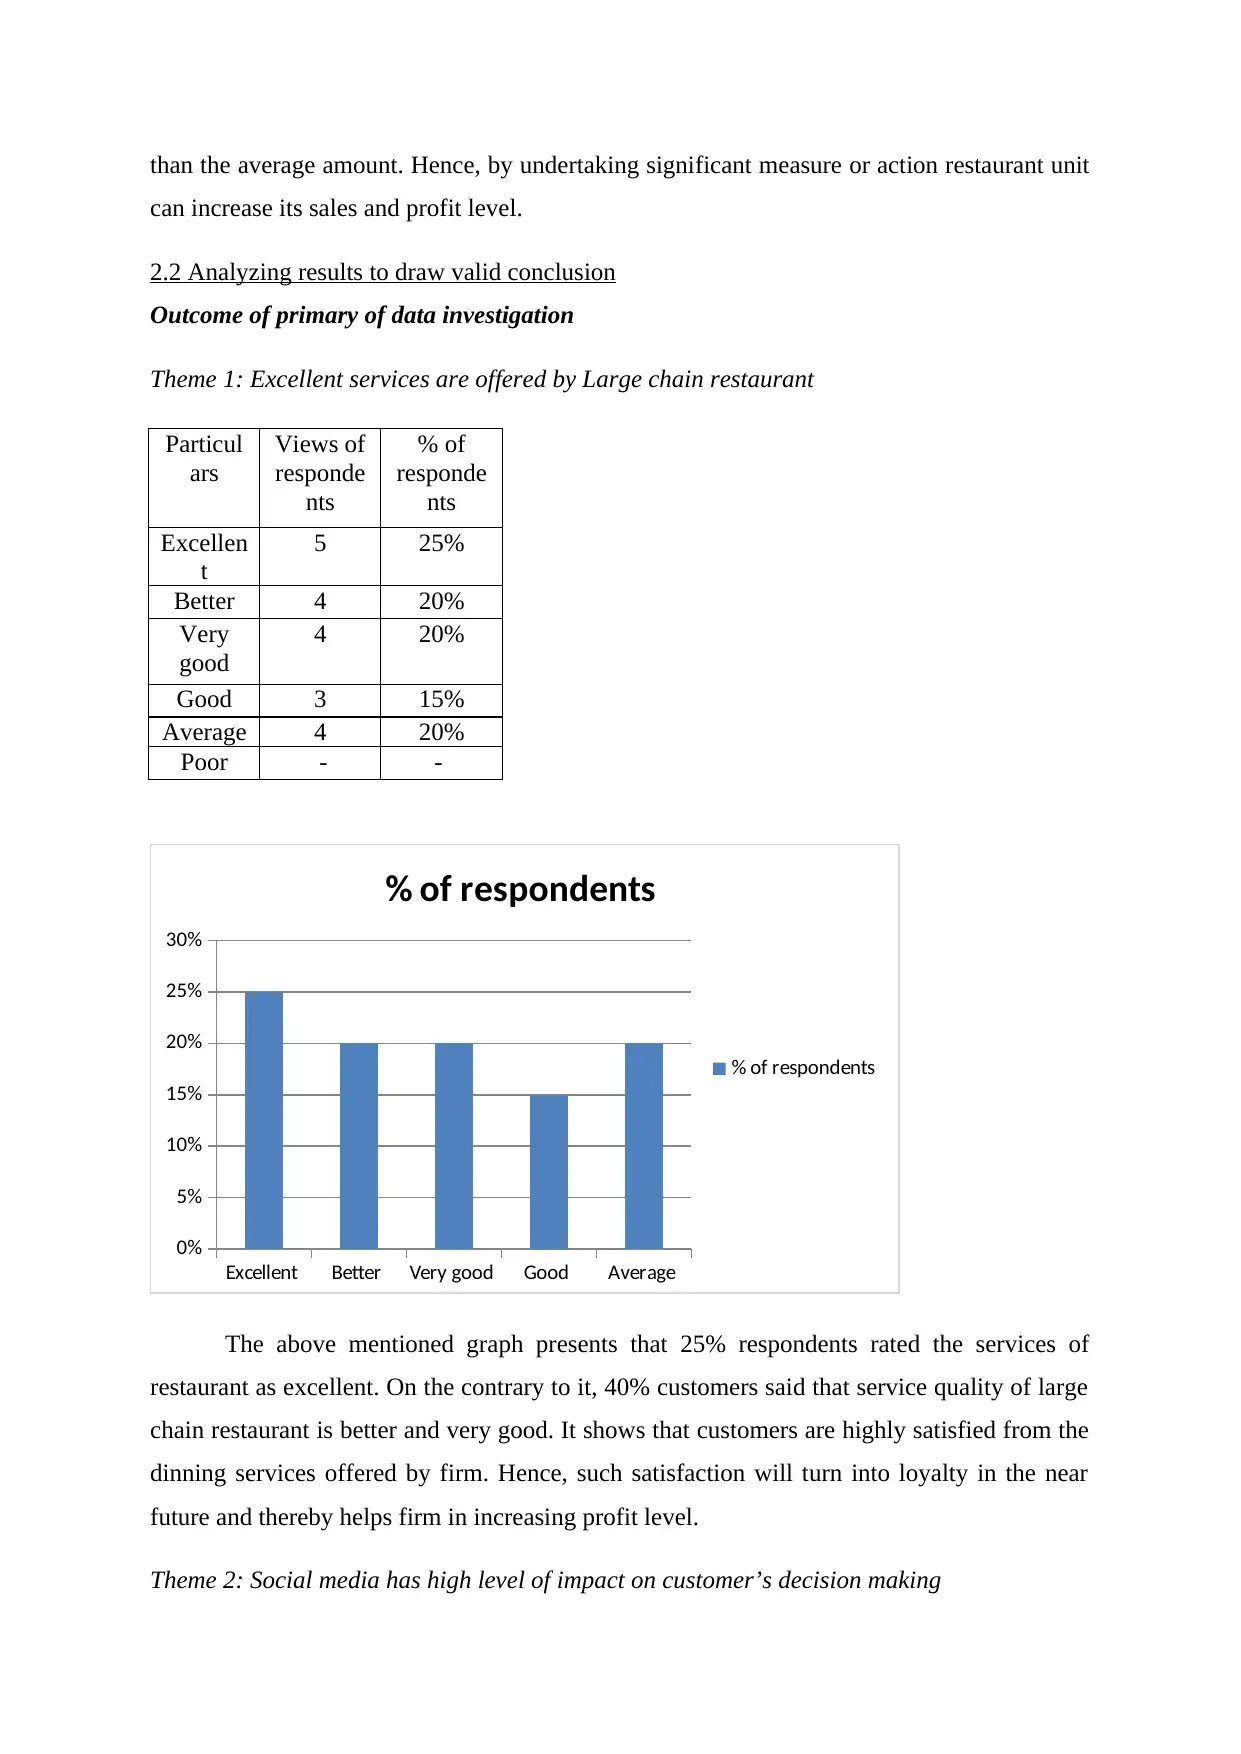
Theme 1: Excellent services are offered by Large chain restaurant
Particul
ars
Views of
responde
nts
% of
responde
nts
Excellen
t
5 25%
Better 4 20%
Very
good
4 20%
Good 3 15%
Average 4 20%
Poor - -
Excellent Better Very good Good Average
0%
5%
10%
15%
20%
25%
30%
% of respondents
% of respondents
The above mentioned graph presents that 25% respondents rated the services of
restaurant as excellent. On the contrary to it, 40% customers said that service quality of large
chain restaurant is better and very good. It shows that customers are highly satisfied from the
dinning services offered by firm. Hence, such satisfaction will turn into loyalty in the near
future and thereby helps firm in increasing profit level.
Theme 2: Social media has high level of impact on customer’s decision making
can increase its sales and profit level.
2.2 Analyzing results to draw valid conclusion
Outcome of primary of data investigation
Theme 1: Excellent services are offered by Large chain restaurant
Particul
ars
Views of
responde
nts
% of
responde
nts
Excellen
t
5 25%
Better 4 20%
Very
good
4 20%
Good 3 15%
Average 4 20%
Poor - -
Excellent Better Very good Good Average
0%
5%
10%
15%
20%
25%
30%
% of respondents
% of respondents
The above mentioned graph presents that 25% respondents rated the services of
restaurant as excellent. On the contrary to it, 40% customers said that service quality of large
chain restaurant is better and very good. It shows that customers are highly satisfied from the
dinning services offered by firm. Hence, such satisfaction will turn into loyalty in the near
future and thereby helps firm in increasing profit level.
Theme 2: Social media has high level of impact on customer’s decision making
⊘ This is a preview!⊘
Do you want full access?
Subscribe today to unlock all pages.
Trusted by 1+ million students worldwide
Particulars Views of respondents % of respondents
Newspaper 6 30%
Television 4 20%
Social media 10 50%
Total 20 100%
Results of survey show that decision making of 50% customers is highly influenced
from social media. From secondary data investigation, it has been assessed that now people
make use of social media with the very high rate and share their views as well as suggestions
with others. On the other side, 20% respondents consider television, whereas remaining
customers undertake newspaper while take dinning decision. On the basis of this aspect, by
developing suitable promotional mix company can entice the decision making of others.
2.3 Using measures of dispersion for decision making
Calculation of standard deviation and variances
Particulars
Sales (in
£)
Profit
(in £)
Standard
Deviation 180.25 18.15
Sample
Variance
32490.4
8 329.29
Kurtosis 0.51 -0.88
Skewness 0.73 -0.58
From evaluation, it has been determined that standard deviation of sales and profit
measure is £180.25 & £18.15. Hence, in the near future revenue and margin of the firm will
deviate from such amount. Thus, manager needs to undertake such aspect while framing
strategies and policies regarding another restaurant unit (Abadi, 2017).
2.4 Quartile, percentile and correlation coefficient
Quartile measure helps company in assessing its performance eve in the respect of
each quarter. Percentile also presents the same but it shows output in the form of percentage
(Quartile, 2017). Hence, by evaluating such performance firm can make suitable decisions
and thereby makes contribution in the attainment of organizational goals and objectives.
Computation of quartile and percentile
Quartiles Percentiles Sales (Amount in £) Profit (Amount
Paraphrase This Document
Need a fresh take? Get an instant paraphrase of this document with our AI Paraphraser
in £)
Quartile 1 25th Percentile 1290 247.5
Quartile 2 50th Percentile 1380 269.5
Quartile 3 75th Percentile 1482.5 278
Tabular presentation shows that sales revenue and profit margin of large restaurant
unit was £1290 & £247.5 respectively. On the other side, in the second and third quarter,
sales of firm were £1380 and £1482.5. Further, profit margin of business unit also increased
from £269.5 to £278. Hence, by considering all such aspects it can be stated that both sales
revenue and profit margin were increased from one quarter to another. This aspect clearly
shows that business unit had attained success in attracting the large number of customers.
Calculation of correlation coefficient
Particulars Sales Profit
Sales 1 .90
Profit .90 1
The above depicted table entails that high level of positive relationship takes place
between the sales and profit margin of restaurant. According to the statistical aspects if sales
revenue will increase then profit aspect moves in upward direction and vice versa. On the
basis of this aspect, business entity needs to frame highly competent framework which place
positive impact on both sales revenue and margin (Link and et.al., 2017).
TASK 2
3.1 Producing graphs by using spread sheet
Graphical presentation of sales and profit from 2005 to 2015:
Quartile 1 25th Percentile 1290 247.5
Quartile 2 50th Percentile 1380 269.5
Quartile 3 75th Percentile 1482.5 278
Tabular presentation shows that sales revenue and profit margin of large restaurant
unit was £1290 & £247.5 respectively. On the other side, in the second and third quarter,
sales of firm were £1380 and £1482.5. Further, profit margin of business unit also increased
from £269.5 to £278. Hence, by considering all such aspects it can be stated that both sales
revenue and profit margin were increased from one quarter to another. This aspect clearly
shows that business unit had attained success in attracting the large number of customers.
Calculation of correlation coefficient
Particulars Sales Profit
Sales 1 .90
Profit .90 1
The above depicted table entails that high level of positive relationship takes place
between the sales and profit margin of restaurant. According to the statistical aspects if sales
revenue will increase then profit aspect moves in upward direction and vice versa. On the
basis of this aspect, business entity needs to frame highly competent framework which place
positive impact on both sales revenue and margin (Link and et.al., 2017).
TASK 2
3.1 Producing graphs by using spread sheet
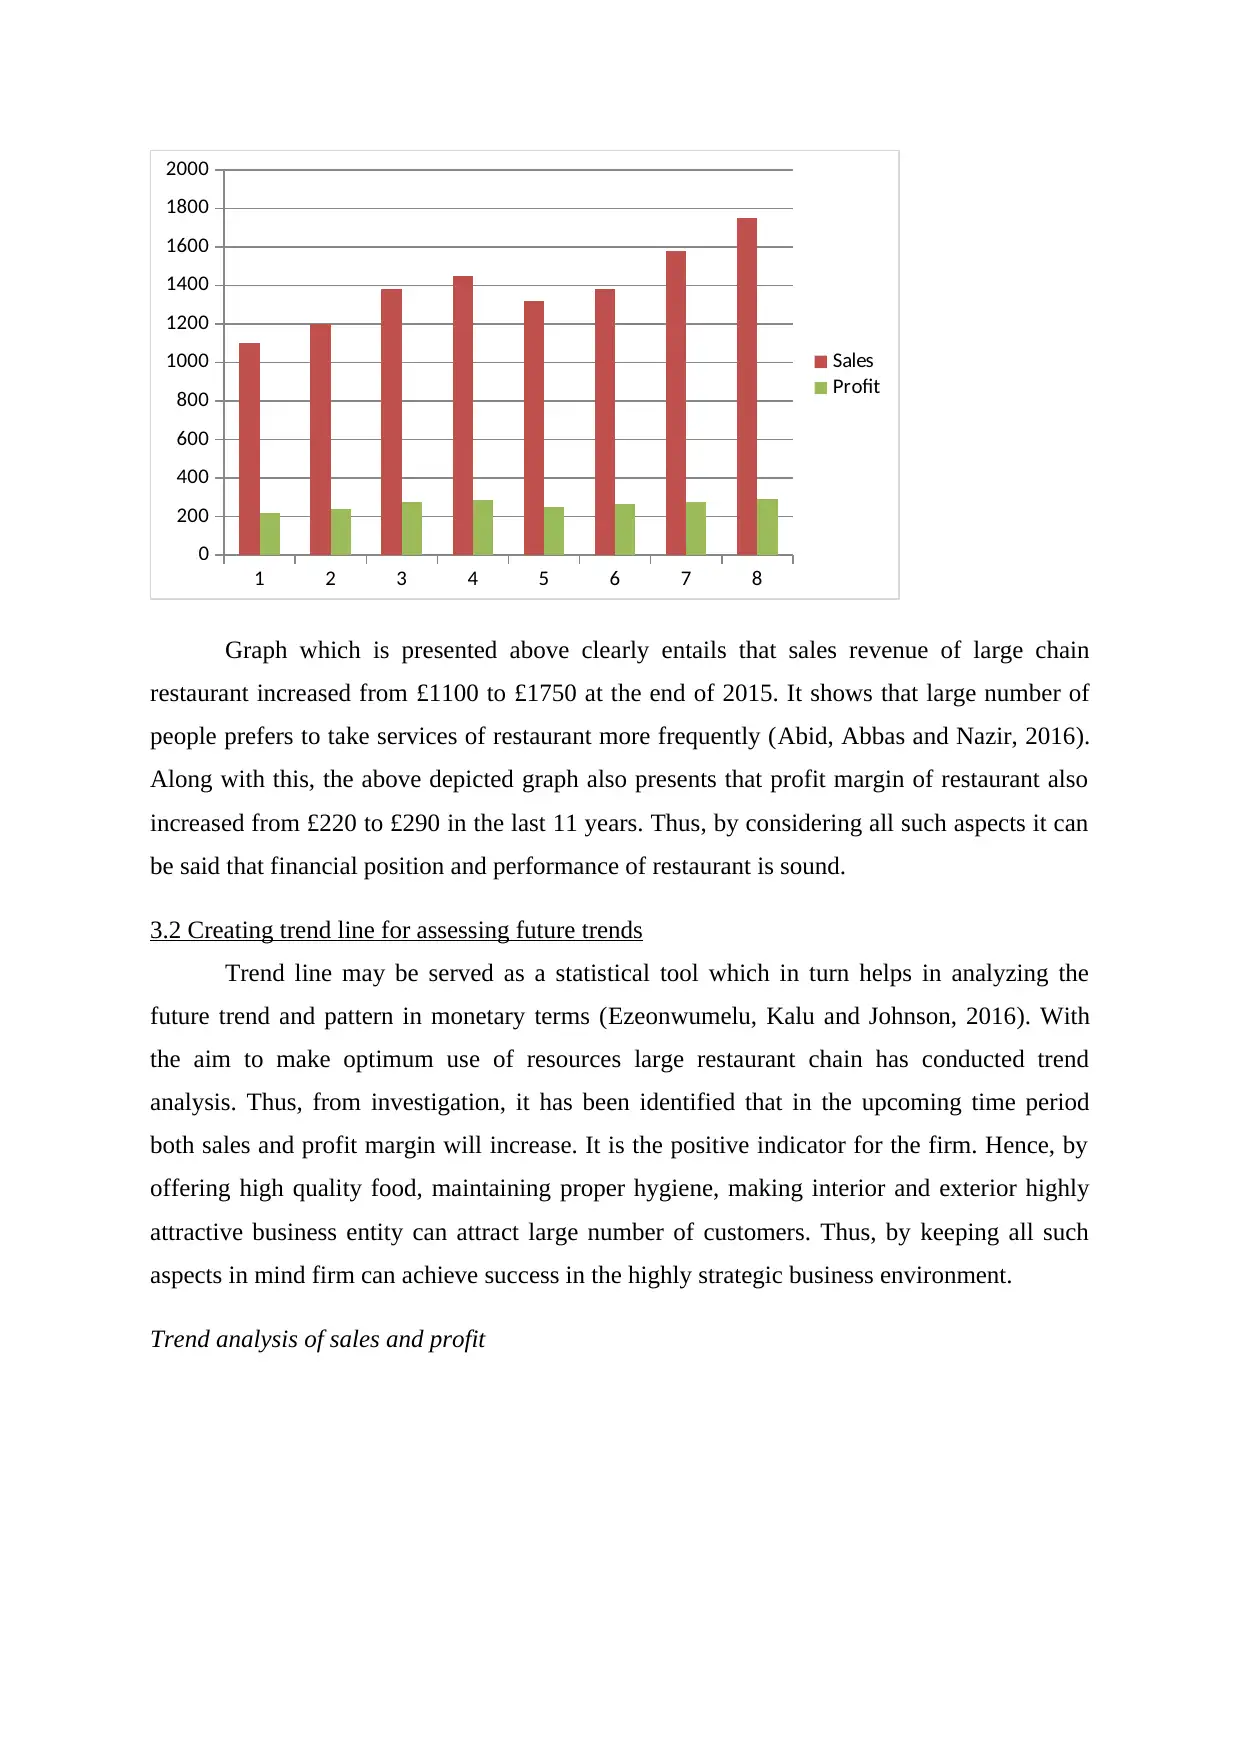
Graphical presentation of sales and profit from 2005 to 2015:
1 2 3 4 5 6 7 8
0
200
400
600
800
1000
1200
1400
1600
1800
2000
Sales
Profit
Graph which is presented above clearly entails that sales revenue of large chain
restaurant increased from £1100 to £1750 at the end of 2015. It shows that large number of
people prefers to take services of restaurant more frequently (Abid, Abbas and Nazir, 2016).
Along with this, the above depicted graph also presents that profit margin of restaurant also
increased from £220 to £290 in the last 11 years. Thus, by considering all such aspects it can
be said that financial position and performance of restaurant is sound.
3.2 Creating trend line for assessing future trends
Trend line may be served as a statistical tool which in turn helps in analyzing the
future trend and pattern in monetary terms (Ezeonwumelu, Kalu and Johnson, 2016). With
the aim to make optimum use of resources large restaurant chain has conducted trend
analysis. Thus, from investigation, it has been identified that in the upcoming time period
both sales and profit margin will increase. It is the positive indicator for the firm. Hence, by
offering high quality food, maintaining proper hygiene, making interior and exterior highly
attractive business entity can attract large number of customers. Thus, by keeping all such
aspects in mind firm can achieve success in the highly strategic business environment.
Trend analysis of sales and profit
⊘ This is a preview!⊘
Do you want full access?
Subscribe today to unlock all pages.
Trusted by 1+ million students worldwide
1 out of 17
Related Documents


Your All-in-One AI-Powered Toolkit for Academic Success.
+13062052269
info@desklib.com
Available 24*7 on WhatsApp / Email
![[object Object]](/_next/static/media/star-bottom.7253800d.svg)
Unlock your academic potential
Copyright © 2020–2026 A2Z Services. All Rights Reserved. Developed and managed by ZUCOL.