Statistics for Business Decisions - Analysis of Homework Assignment
VerifiedAdded on 2023/01/06
|10
|2046
|55
Homework Assignment
AI Summary
This statistics assignment solution analyzes various aspects of business decision-making using statistical methods. It begins with an analysis of survey data, employing ordinal scales to interpret respondent opinions on a proposed tax increase for a rail project. The solution then delves into descriptive statistics, calculating and interpreting measures like mean, median, mode, and standard deviation for time spent in meetings, and visualizing the data with frequency histograms. Furthermore, the assignment explores data collection methods, differentiating between primary and secondary approaches, and providing examples for different scenarios, such as analyzing voting intentions, bank interest rates, demographic profiles, and opinions on marijuana legalization. Finally, the solution presents regression analysis, including the creation and interpretation of a normal probability plot, correlation assessment, and the application of a simple linear regression model to examine the relationship between television watching and overweight children. The solution concludes with hypothesis testing and interpretation of results, emphasizing the impact of television viewing on weight gain.

Statistics for Business
Decisions
Decisions
Paraphrase This Document
Need a fresh take? Get an instant paraphrase of this document with our AI Paraphraser

Table of Contents
Question 1........................................................................................................................................2
a....................................................................................................................................................2
b...................................................................................................................................................2
Question 2........................................................................................................................................3
a....................................................................................................................................................3
b...................................................................................................................................................3
c....................................................................................................................................................4
Question 3........................................................................................................................................4
a....................................................................................................................................................4
b...................................................................................................................................................4
c....................................................................................................................................................5
d...................................................................................................................................................5
e....................................................................................................................................................6
Question 4........................................................................................................................................6
a....................................................................................................................................................6
b...................................................................................................................................................6
c....................................................................................................................................................7
d...................................................................................................................................................8
e....................................................................................................................................................8
f....................................................................................................................................................8
REFERENCES................................................................................................................................9
Question 1
a.
The responses of this question provide quantitative data because it deals with numeric
information which is associated with each data set. Ordinal scale of measurement is used to
present the data in better manner because it uses labels to classify cases into ordered classes.
Here, there ordered classes are used i.e. vote for, vote against and no opinion. Also, this method
is used to evaluate the views of other and in the same way, to determine the views of
respondents, this scale is used through interview method.
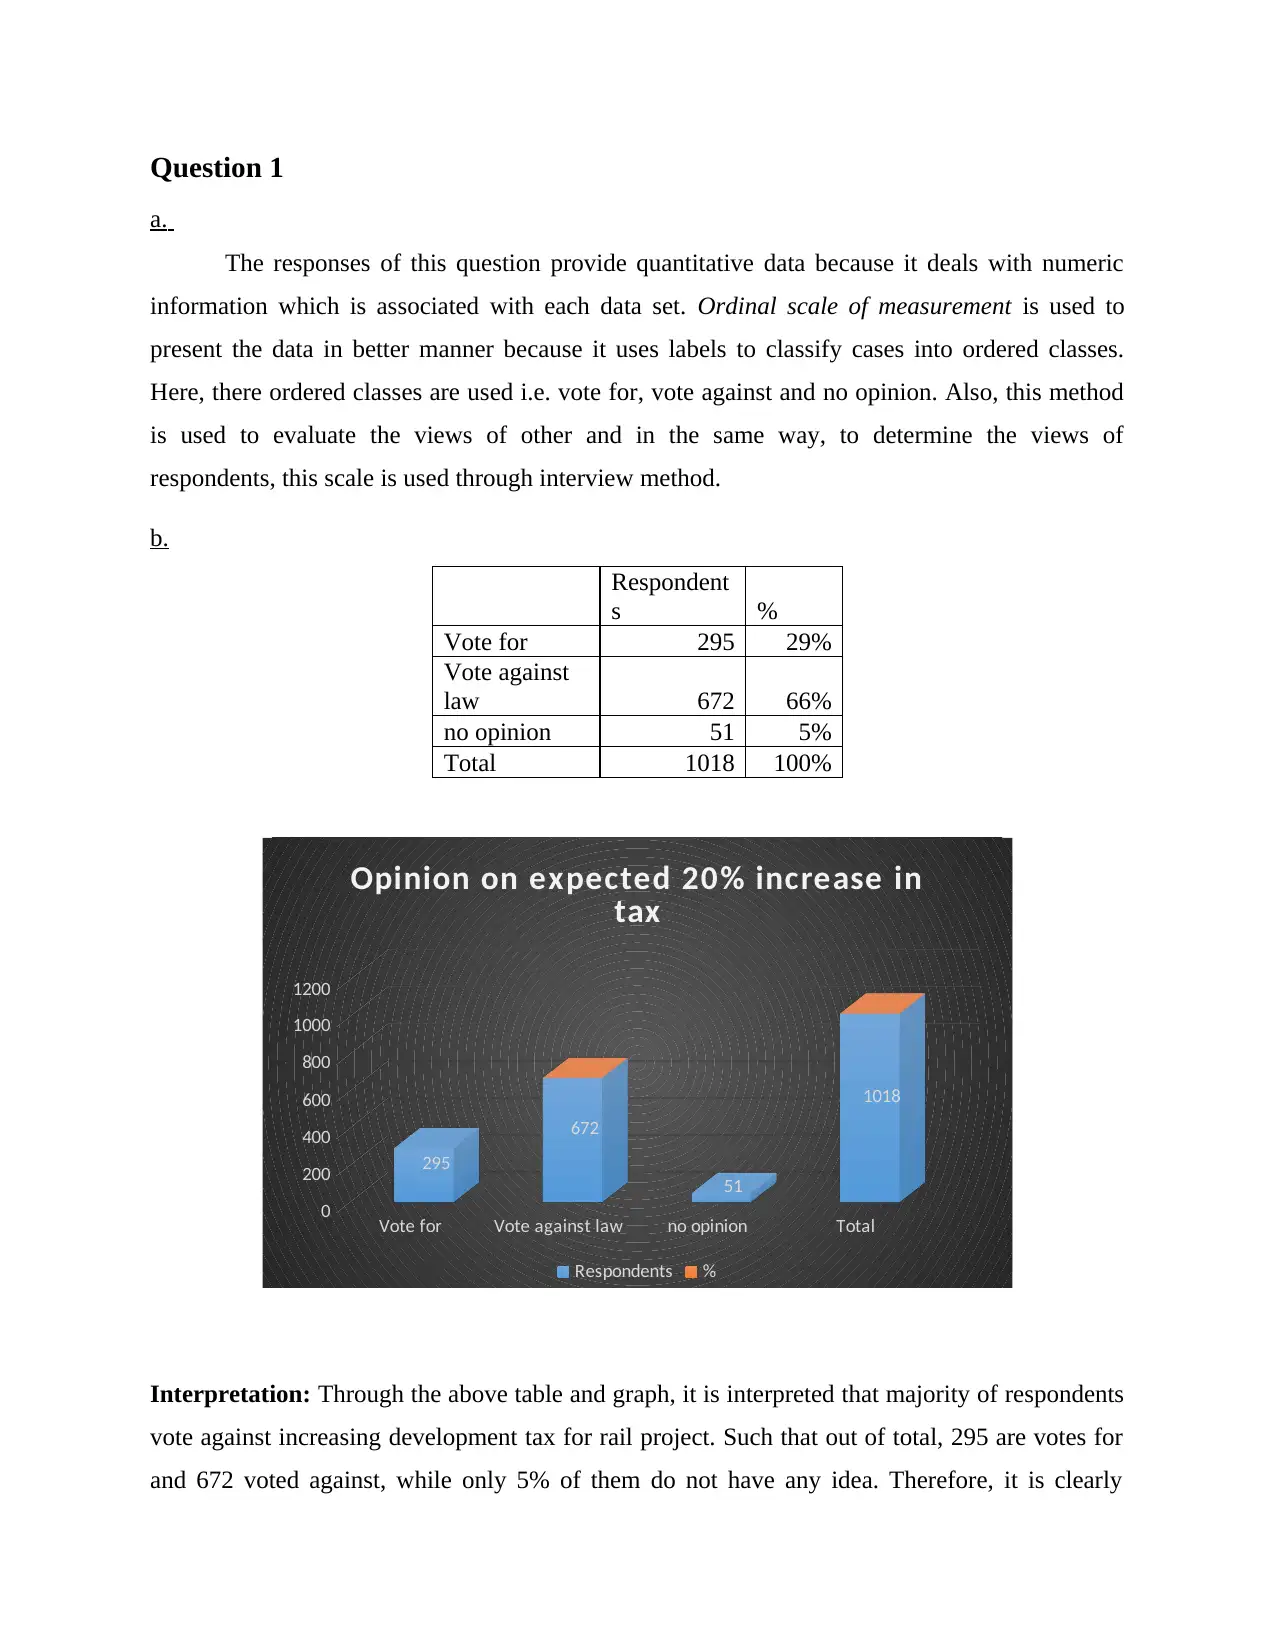
b.
Respondent
s %
Vote for 295 29%
Vote against
law 672 66%
no opinion 51 5%
Total 1018 100%
Vote for Vote against law no opinion Total
0
200
400
600
800
1000
1200
295
672
51
1018
Opinion on expected 20% increase in
tax
Respondents %
Interpretation: Through the above table and graph, it is interpreted that majority of respondents
vote against increasing development tax for rail project. Such that out of total, 295 are votes for
and 672 voted against, while only 5% of them do not have any idea. Therefore, it is clearly
a.
The responses of this question provide quantitative data because it deals with numeric
information which is associated with each data set. Ordinal scale of measurement is used to
present the data in better manner because it uses labels to classify cases into ordered classes.
Here, there ordered classes are used i.e. vote for, vote against and no opinion. Also, this method
is used to evaluate the views of other and in the same way, to determine the views of
respondents, this scale is used through interview method.
b.
Respondent
s %
Vote for 295 29%
Vote against
law 672 66%
no opinion 51 5%
Total 1018 100%
Vote for Vote against law no opinion Total
0
200
400
600
800
1000
1200
295
672
51
1018
Opinion on expected 20% increase in
tax
Respondents %
Interpretation: Through the above table and graph, it is interpreted that majority of respondents
vote against increasing development tax for rail project. Such that out of total, 295 are votes for
and 672 voted against, while only 5% of them do not have any idea. Therefore, it is clearly
⊘ This is a preview!⊘
Do you want full access?
Subscribe today to unlock all pages.
Trusted by 1+ million students worldwide
reflected that increase in development tax for commencement of a new rail project is not
accepted by the respondents. That is why, most of them are voted against the proposal because it
decreases customer spending which affect negatively upon the project.
Question 2
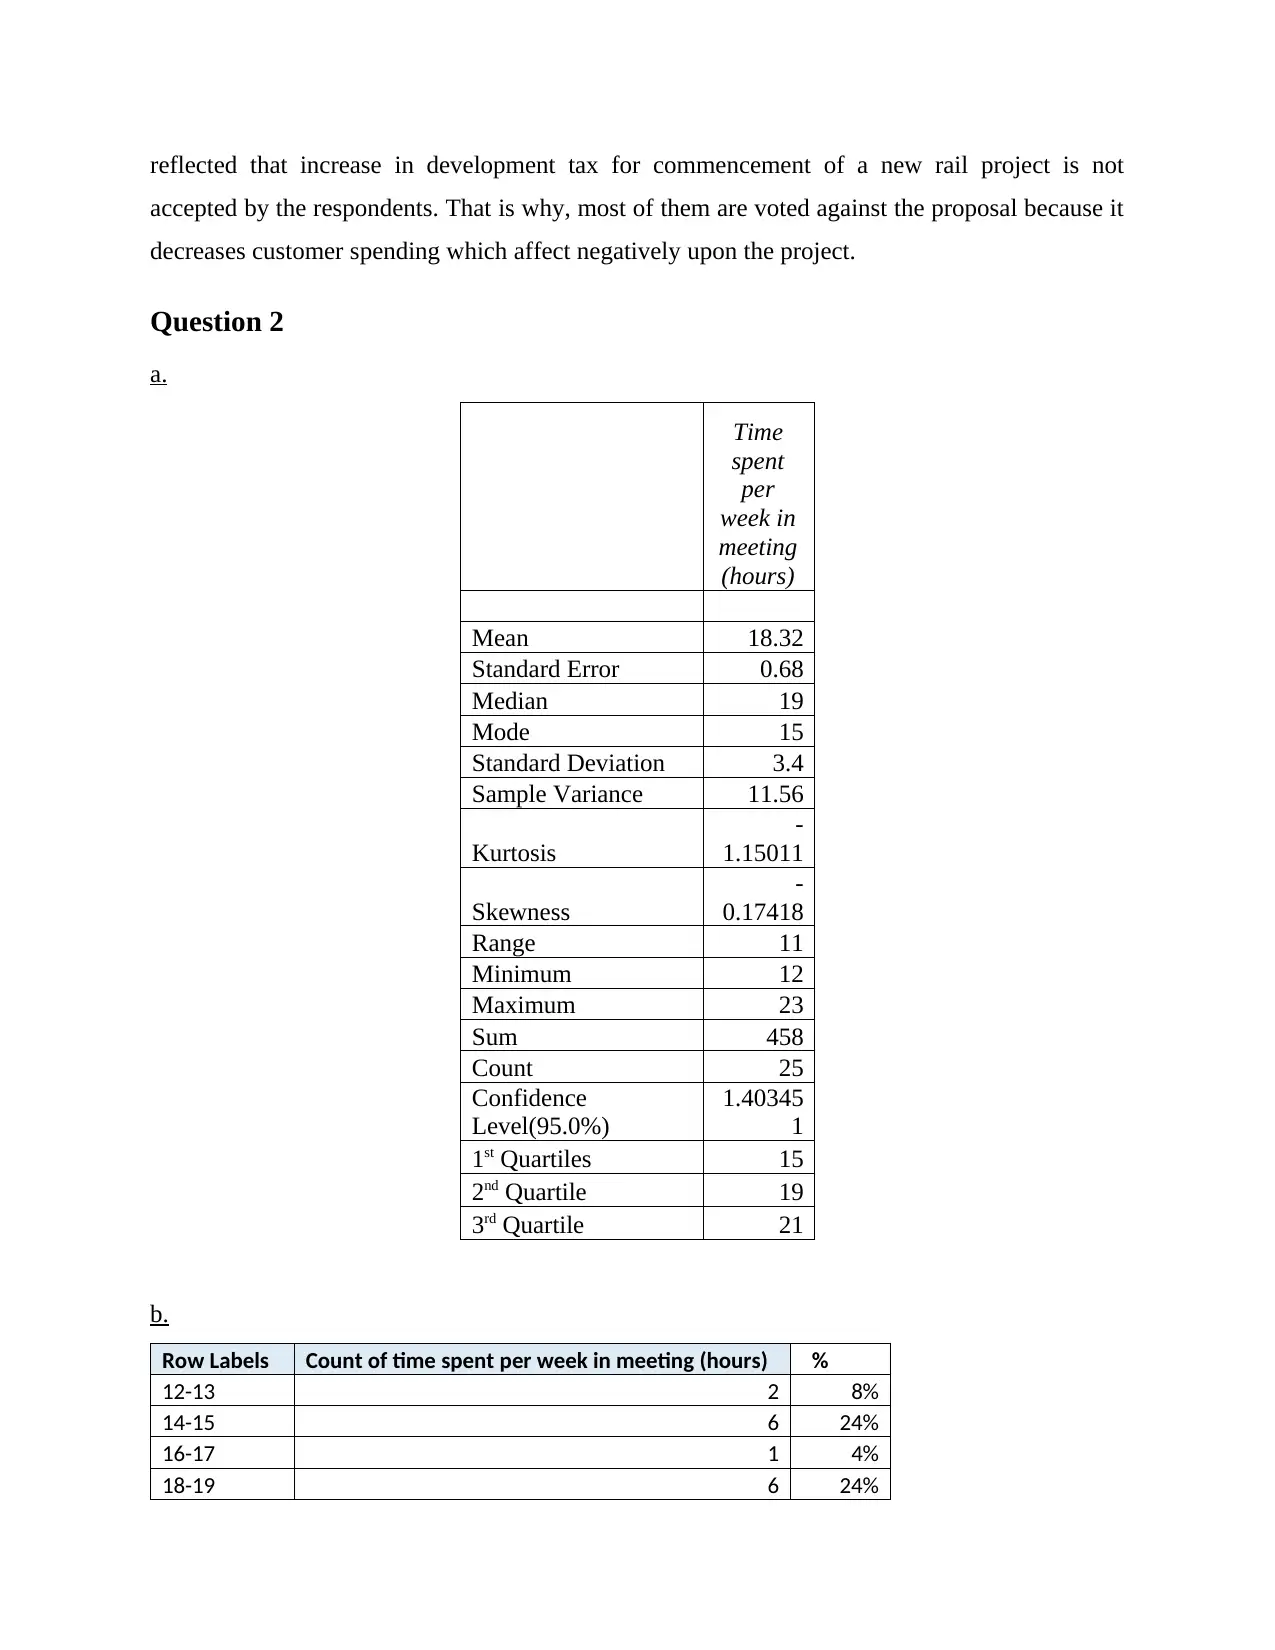
a.
Time
spent
per
week in
meeting
(hours)
Mean 18.32
Standard Error 0.68
Median 19
Mode 15
Standard Deviation 3.4
Sample Variance 11.56
Kurtosis
-
1.15011
Skewness
-
0.17418
Range 11
Minimum 12
Maximum 23
Sum 458
Count 25
Confidence
Level(95.0%)
1.40345
1
1st Quartiles 15
2nd Quartile 19
3rd Quartile 21
b.
Row Labels Count of time spent per week in meeting (hours) %
12-13 2 8%
14-15 6 24%
16-17 1 4%
18-19 6 24%
accepted by the respondents. That is why, most of them are voted against the proposal because it
decreases customer spending which affect negatively upon the project.
Question 2
a.
Time
spent
per
week in
meeting
(hours)
Mean 18.32
Standard Error 0.68
Median 19
Mode 15
Standard Deviation 3.4
Sample Variance 11.56
Kurtosis
-
1.15011
Skewness
-
0.17418
Range 11
Minimum 12
Maximum 23
Sum 458
Count 25
Confidence
Level(95.0%)
1.40345
1
1st Quartiles 15
2nd Quartile 19
3rd Quartile 21
b.
Row Labels Count of time spent per week in meeting (hours) %
12-13 2 8%
14-15 6 24%
16-17 1 4%
18-19 6 24%
Paraphrase This Document
Need a fresh take? Get an instant paraphrase of this document with our AI Paraphraser
20-21 5 20%
22-23 5 20%
Grand Total 25 100%
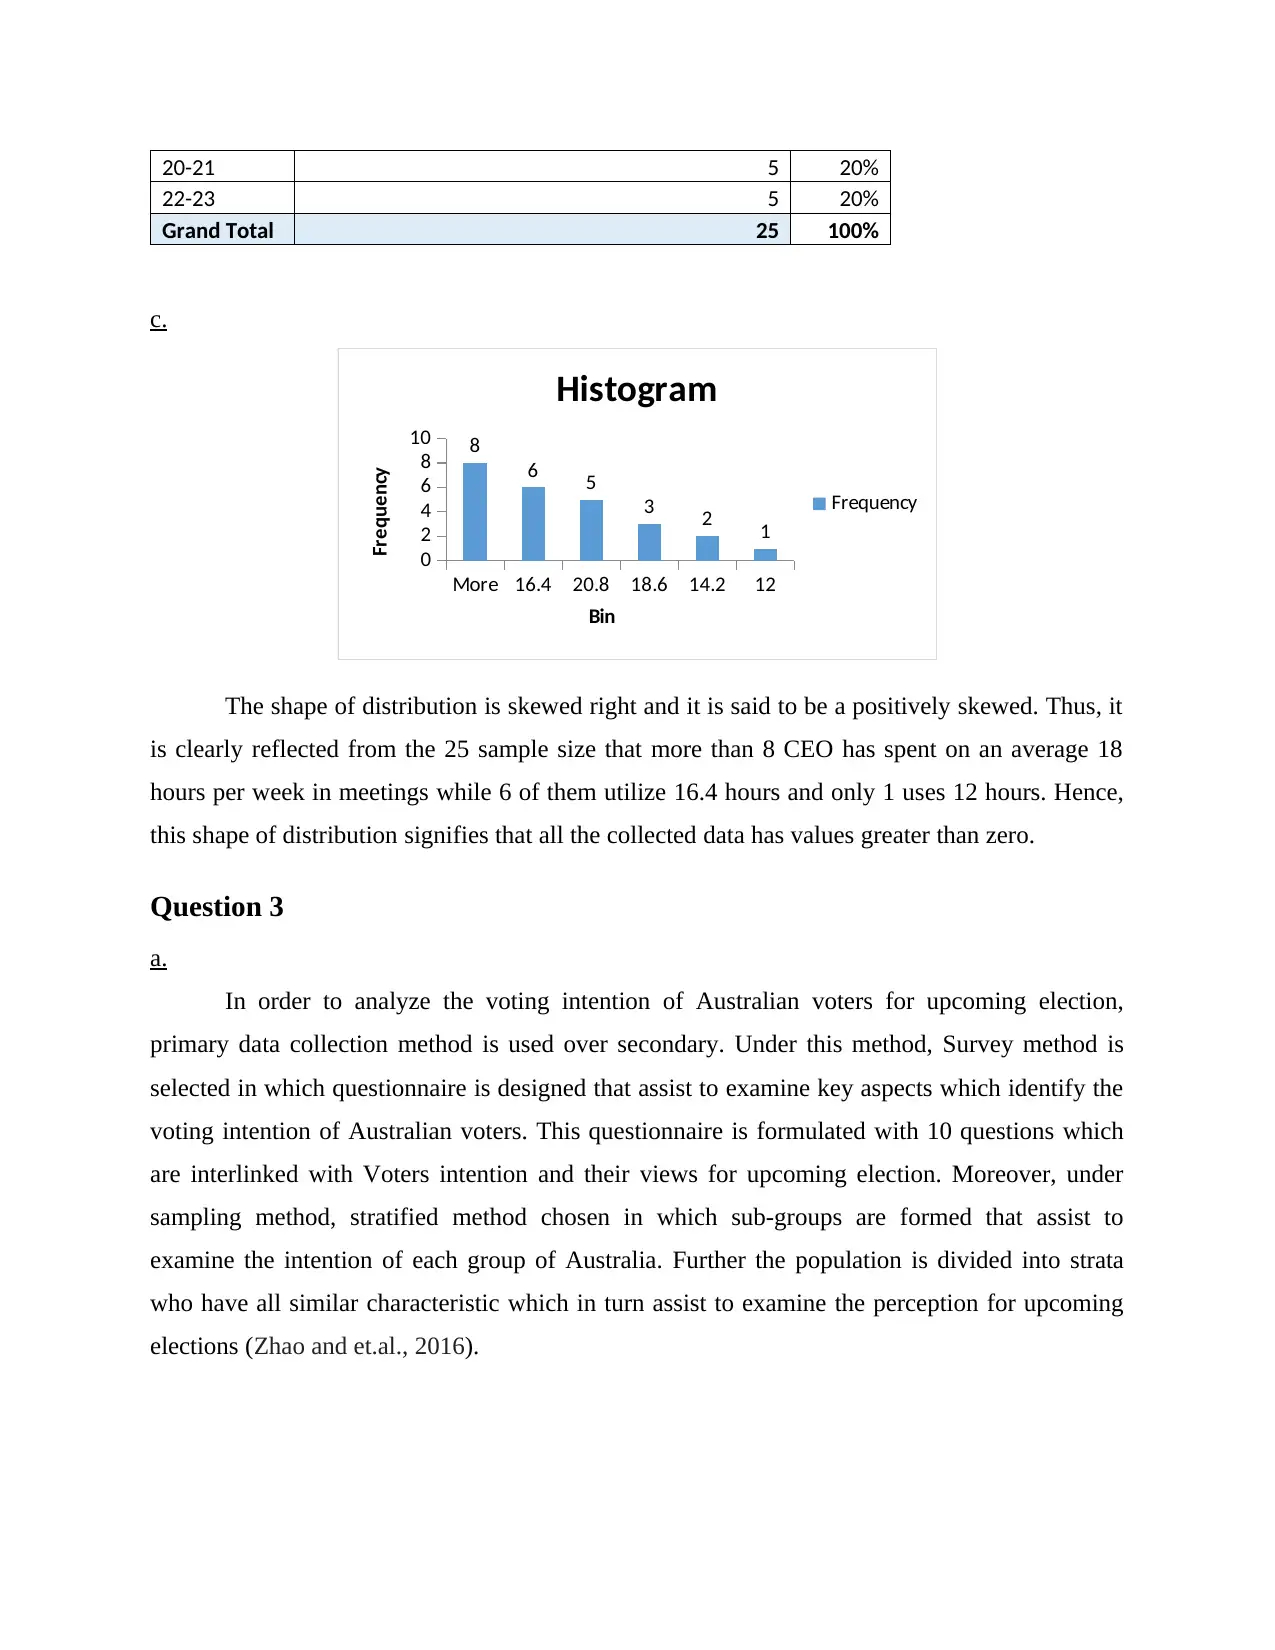
c.
More 16.4 20.8 18.6 14.2 12
0
2
4
6
8
10 8
6 5
3 2 1
Histogram
Frequency
Bin
Frequency
The shape of distribution is skewed right and it is said to be a positively skewed. Thus, it
is clearly reflected from the 25 sample size that more than 8 CEO has spent on an average 18
hours per week in meetings while 6 of them utilize 16.4 hours and only 1 uses 12 hours. Hence,
this shape of distribution signifies that all the collected data has values greater than zero.
Question 3
a.
In order to analyze the voting intention of Australian voters for upcoming election,
primary data collection method is used over secondary. Under this method, Survey method is
selected in which questionnaire is designed that assist to examine key aspects which identify the
voting intention of Australian voters. This questionnaire is formulated with 10 questions which
are interlinked with Voters intention and their views for upcoming election. Moreover, under
sampling method, stratified method chosen in which sub-groups are formed that assist to
examine the intention of each group of Australia. Further the population is divided into strata
who have all similar characteristic which in turn assist to examine the perception for upcoming
elections (Zhao and et.al., 2016).
22-23 5 20%
Grand Total 25 100%
c.
More 16.4 20.8 18.6 14.2 12
0
2
4
6
8
10 8
6 5
3 2 1
Histogram
Frequency
Bin
Frequency
The shape of distribution is skewed right and it is said to be a positively skewed. Thus, it
is clearly reflected from the 25 sample size that more than 8 CEO has spent on an average 18
hours per week in meetings while 6 of them utilize 16.4 hours and only 1 uses 12 hours. Hence,
this shape of distribution signifies that all the collected data has values greater than zero.
Question 3
a.
In order to analyze the voting intention of Australian voters for upcoming election,
primary data collection method is used over secondary. Under this method, Survey method is
selected in which questionnaire is designed that assist to examine key aspects which identify the
voting intention of Australian voters. This questionnaire is formulated with 10 questions which
are interlinked with Voters intention and their views for upcoming election. Moreover, under
sampling method, stratified method chosen in which sub-groups are formed that assist to
examine the intention of each group of Australia. Further the population is divided into strata
who have all similar characteristic which in turn assist to examine the perception for upcoming
elections (Zhao and et.al., 2016).
b.
In this situation, primary data collection method is used because it is used for specific
reasons and here, with the help of this method, a research is conducted over 4 big banks in which
it will be analyzed for not passing on the full interest cuts introduced by reserve bank of
Australia to its borrowers. Therefore, under this method, interview is conducted in which
different questions are asked that clearly identify the reasons of not passing on full interest cuts.
On the other side, for sampling method, simple random sampling method in which 4 managers
(each from bank) are selected randomly in order to identify causes. This method is chosen over
others because it is easy to use and assist to get proper results with actual representation of larger
populations. While on the other side for other sampling method, different criteria are used and
chances of errors is increases and this in turn leads to wrong outcomes as well (Alyahya and
Rowe, 2016).
c.
Demographic profile is a group which include sex, age, income etc. Thus, to identify the
profile, it is suggested to use secondary data collection method over primary. As it is not possible
to examine the trend of particular community living in Hume City council, Melbourne.
Therefore, the data pertaining to demographic is available on Australian Bureau Statistics and
government sites such as (info.australia.gov.au) which is updated by government side and more
reliable over others (Trinh, 2018). Moreover, different articles and journals from the past 10
years are selected that helps to exactly determine the trend of Melbourne’s community. Apart
from this, there is no sample size and sampling method is chosen because this aspect is not
including while performing secondary data collection method.
d.
Marijuana is illegal in Australia but most of the adult wants that it will be legal in
upcoming years because there is some positive health effect of in -taking marijuana like
improves lung capacity. Lose weight, relief from chronic pain etc. Therefore, it is required to
identify the opinion of adults and for that primary data collection method is chosen that assist to
analyze their views regarding marijuana. It is so because it provides valid output along with fresh
research. On the other side, secondary data collection method is not chosen because it does not
⊘ This is a preview!⊘
Do you want full access?
Subscribe today to unlock all pages.
Trusted by 1+ million students worldwide
provide fresh information as it completely relied upon already published articles, books and
Journals. That is why, primary method is chosen over secondary (SYLVIA, 2018).
Beside this, simple random sampling method is chosen under purposive sampling
because random adults (50) of Australia are selected to examine their opinion for legalizing
marijuana in same country. This method is simple to use and also eliminates the bias while other
method does not. Hence, output generated through this method will free from errors, but it is not
possible in other case.
e.
To examine the average age of children in city of Melbourne, secondary data collection
method has been used because the population of city is quite large and it is not possible to
conduct primary data collection method. Hence, with the help of secondary data, scholar uses
specific government sites that provide complete data of Melbourne as per age for specific years,
which in turn help to meet the aim (Johhson and Sylvia, 2018). Under secondary data, authentic
sites are considering which provide complete statistic from last many years that provides an idea
of average age of children in particular area.
Question 4
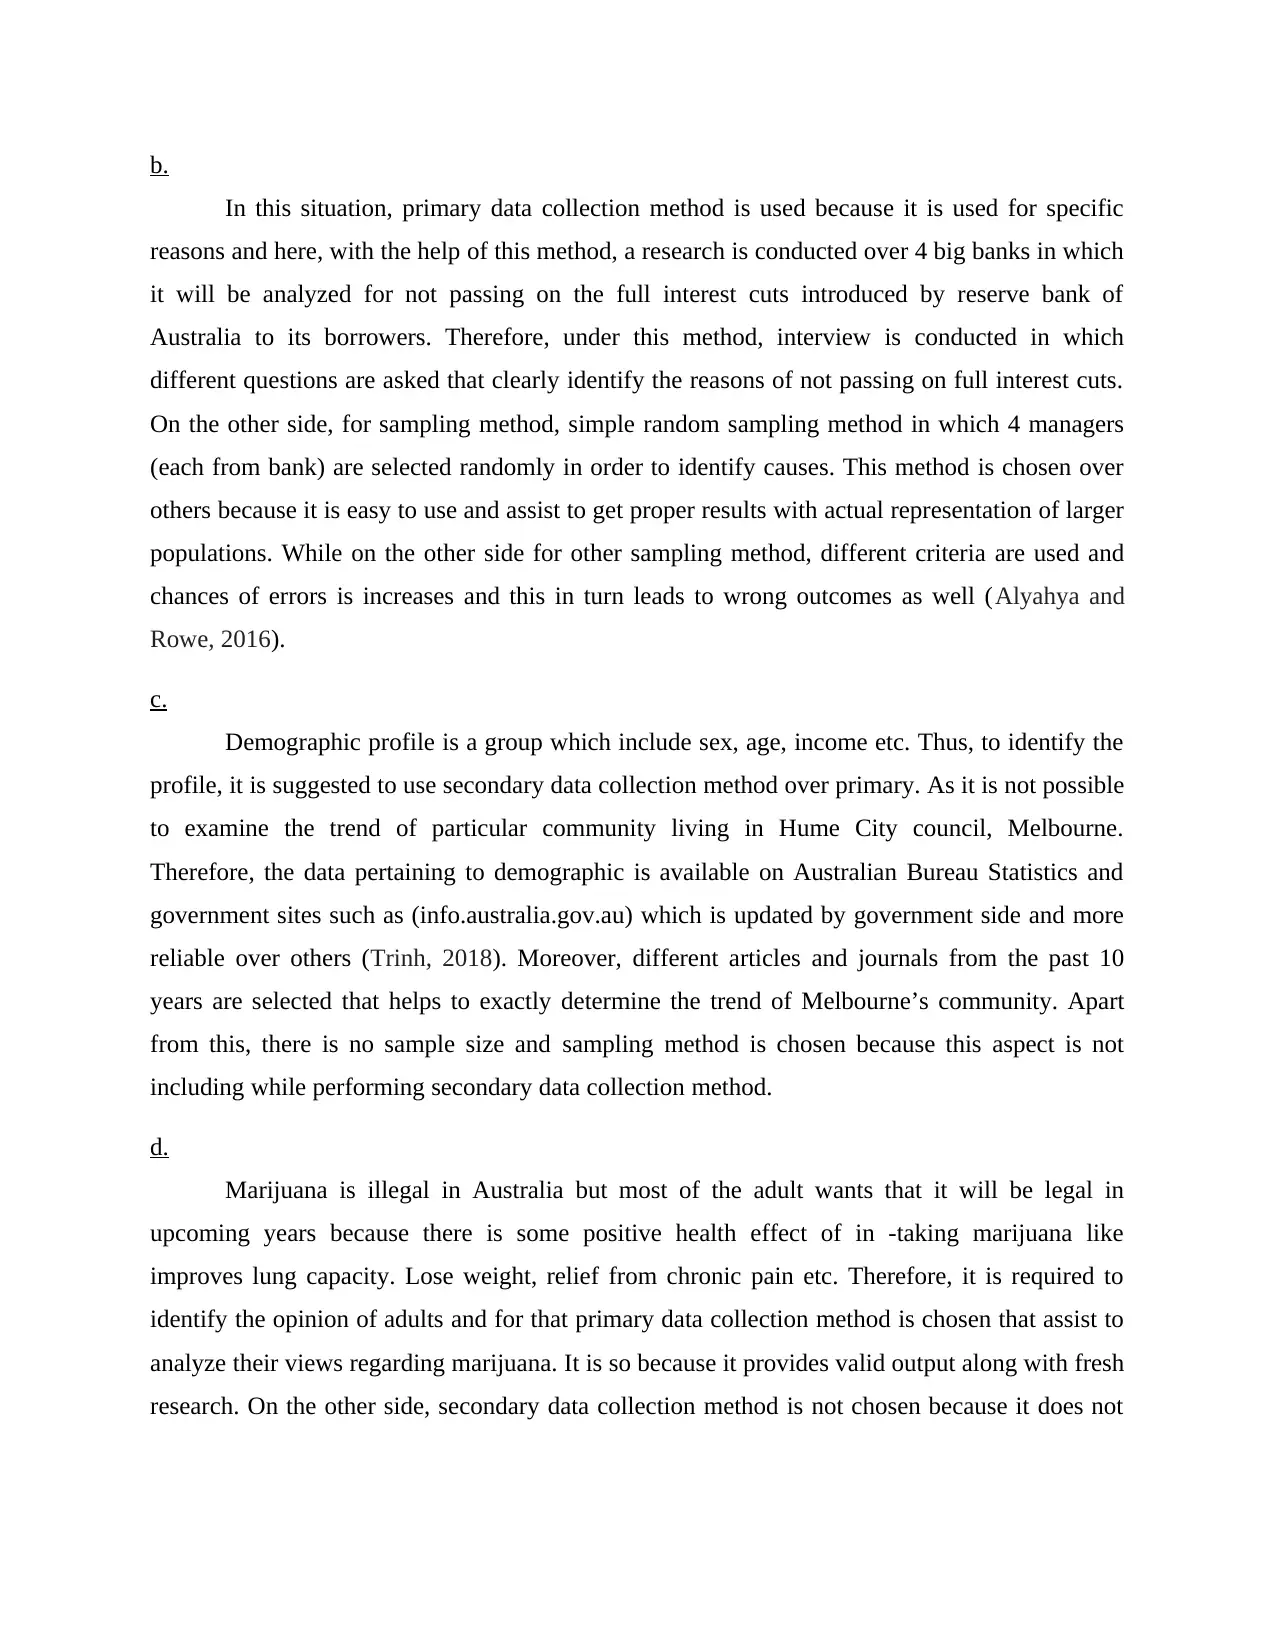
a.
0 20 40 60 80 100 120
-5
0
5
10
Normal Probability Plot
Sample Percentile
Overweight
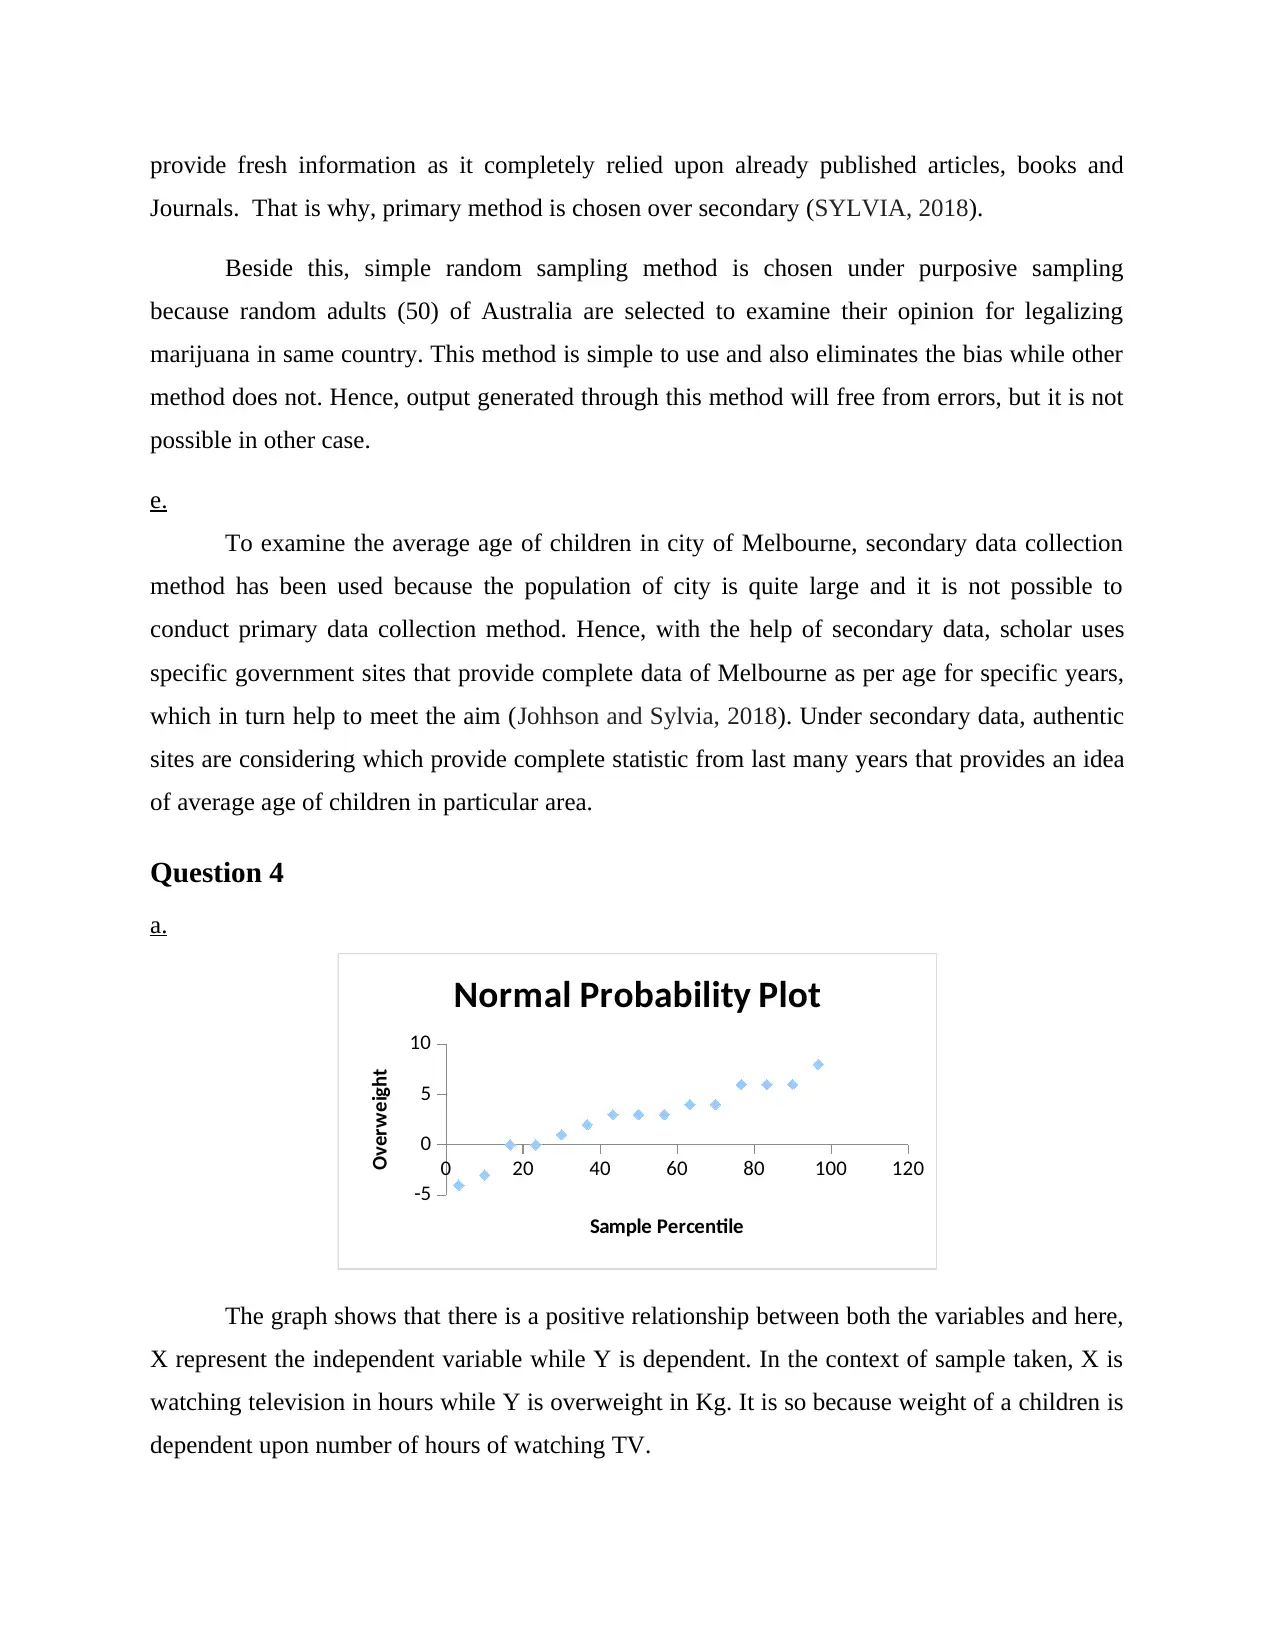
The graph shows that there is a positive relationship between both the variables and here,
X represent the independent variable while Y is dependent. In the context of sample taken, X is
watching television in hours while Y is overweight in Kg. It is so because weight of a children is
dependent upon number of hours of watching TV.
Journals. That is why, primary method is chosen over secondary (SYLVIA, 2018).
Beside this, simple random sampling method is chosen under purposive sampling
because random adults (50) of Australia are selected to examine their opinion for legalizing
marijuana in same country. This method is simple to use and also eliminates the bias while other
method does not. Hence, output generated through this method will free from errors, but it is not
possible in other case.
e.
To examine the average age of children in city of Melbourne, secondary data collection
method has been used because the population of city is quite large and it is not possible to
conduct primary data collection method. Hence, with the help of secondary data, scholar uses
specific government sites that provide complete data of Melbourne as per age for specific years,
which in turn help to meet the aim (Johhson and Sylvia, 2018). Under secondary data, authentic
sites are considering which provide complete statistic from last many years that provides an idea
of average age of children in particular area.
Question 4
a.
0 20 40 60 80 100 120
-5
0
5
10
Normal Probability Plot
Sample Percentile
Overweight
The graph shows that there is a positive relationship between both the variables and here,
X represent the independent variable while Y is dependent. In the context of sample taken, X is
watching television in hours while Y is overweight in Kg. It is so because weight of a children is
dependent upon number of hours of watching TV.
Paraphrase This Document
Need a fresh take? Get an instant paraphrase of this document with our AI Paraphraser
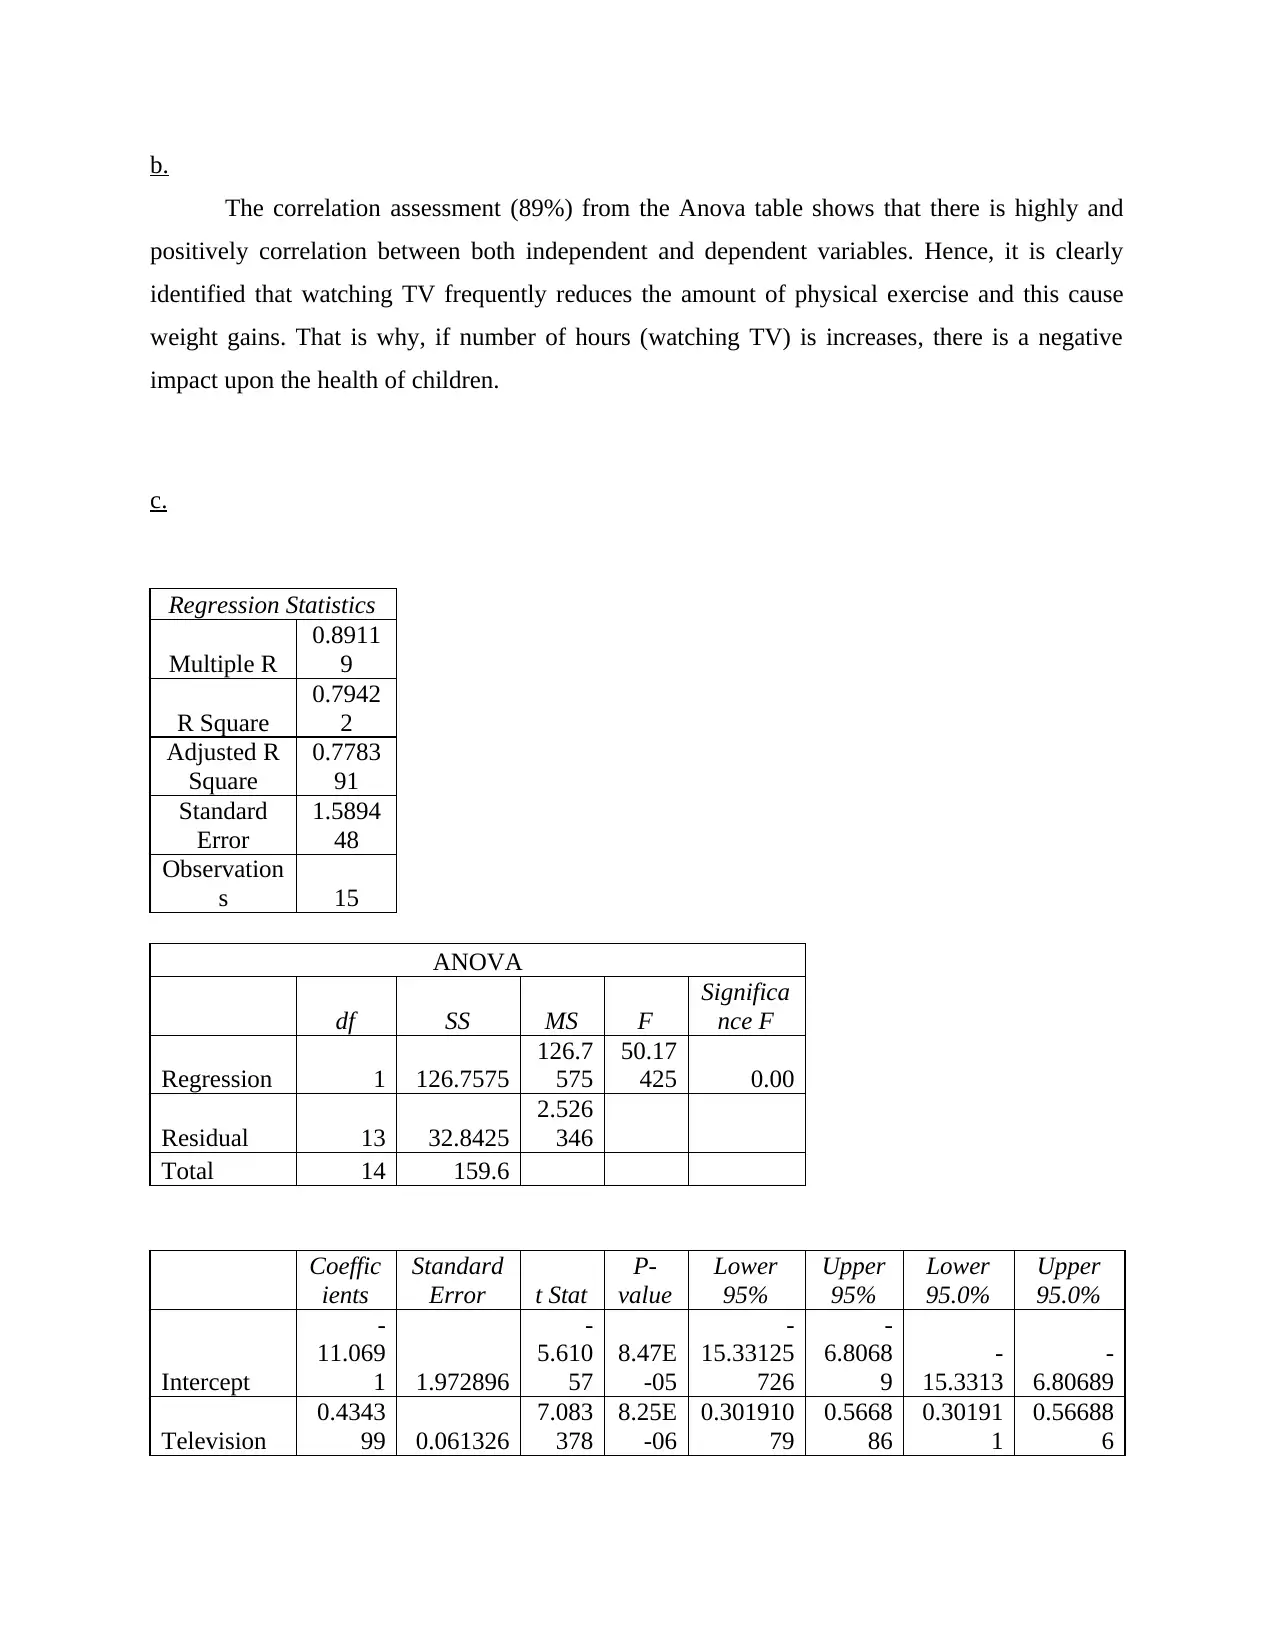
b.
The correlation assessment (89%) from the Anova table shows that there is highly and
positively correlation between both independent and dependent variables. Hence, it is clearly
identified that watching TV frequently reduces the amount of physical exercise and this cause
weight gains. That is why, if number of hours (watching TV) is increases, there is a negative
impact upon the health of children.
c.
Regression Statistics
Multiple R
0.8911
9
R Square
0.7942
2
Adjusted R
Square
0.7783
91
Standard
Error
1.5894
48
Observation
s 15
ANOVA
df SS MS F
Significa
nce F
Regression 1 126.7575
126.7
575
50.17
425 0.00
Residual 13 32.8425
2.526
346
Total 14 159.6
Coeffic
ients
Standard
Error t Stat
P-
value
Lower
95%
Upper
95%
Lower
95.0%
Upper
95.0%
Intercept
-
11.069
1 1.972896
-
5.610
57
8.47E
-05
-
15.33125
726
-
6.8068
9
-
15.3313
-
6.80689
Television
0.4343
99 0.061326
7.083
378
8.25E
-06
0.301910
79
0.5668
86
0.30191
1
0.56688
6
It is the simple linear regression model which estimates the relationship between one
independent and dependent variables. Thus, the equation is Y =a+bX where Y is dependent
variable (Overweight) and X is independent (TV).
d.
The output table exhibits the value of R square is 0.79 or 79% which means if children
spend less hours on television than amount of physical exercise increases, as a result, weight
affected. Hence, it can be said that if hours of TV watching increases by 79%, the changes in
physical exercise is also affected by same.
e.
Null Hypothesis (H0): There is no statistical difference takes place in the mean value of
watching Television and Overweight.
Alternative Hypothesis (H1): There is a statistical difference takes place in the mean value of
watching Television and Overweight.
Interpretation: Outcome of regression analysis shows that watching Television (in hours)
frequently has a direct impact upon weight among students. Anova table shows that p value is
lower than 0.05 which in turn indicates that alternative hypothesis is appropriate over null. Thus,
watching TV reduces the physical exercise and that is why, it leads to weight gains.
f.
The output table reflected that the standard error of estimation is 1.58 which means the
fitness of regression model is positive. Thus, if there is a change in independent variable,
dependent value automatically changes. So, with the help of depicted value, if hours of watching
TV is increases, then weight of students directly increases and vice versa.
⊘ This is a preview!⊘
Do you want full access?
Subscribe today to unlock all pages.
Trusted by 1+ million students worldwide
REFERENCES
Books and Journals
Mertens, W., Pugliese, A. and Recker, J., 2017. Quantitative data analysis. A companion.
SYLVIA, M.L., 2018. Primary Data Collection. Clinical Analytics and Data Management for
the DNP, p.87.
Johhson, E. and Sylvia, M.L., 2018. Secondary Data Collection. Critical Analytics and Data
Management for the DNP, p.61.
Zhao, H. and et.al., 2016, April. Stratified over-sampling bagging method for random forests on
imbalanced data. In Pacific-Asia Workshop on Intelligence and Security Informatics (pp. 63-
72). Springer, Cham.
Alyahya, K. and Rowe, J.E., 2016, September. Simple random sampling estimation of the
number of local optima. In International Conference on Parallel Problem Solving from
Nature (pp. 932-941). Springer, Cham.
Trinh, Q.D., 2018, April. Understanding the impact and challenges of secondary data analysis.
In Urologic Oncology: Seminars and Original Investigations (Vol. 36, No. 4, pp. 163-164).
Elsevier.
1 out of 10
Related Documents


Your All-in-One AI-Powered Toolkit for Academic Success.
+13062052269
info@desklib.com
Available 24*7 on WhatsApp / Email
![[object Object]](/_next/static/media/star-bottom.7253800d.svg)
Unlock your academic potential
Copyright © 2020–2026 A2Z Services. All Rights Reserved. Developed and managed by ZUCOL.