Exploring Statistical Data: Analysis, Plots, and Interpretation
VerifiedAdded on 2023/05/29
|8
|642
|52
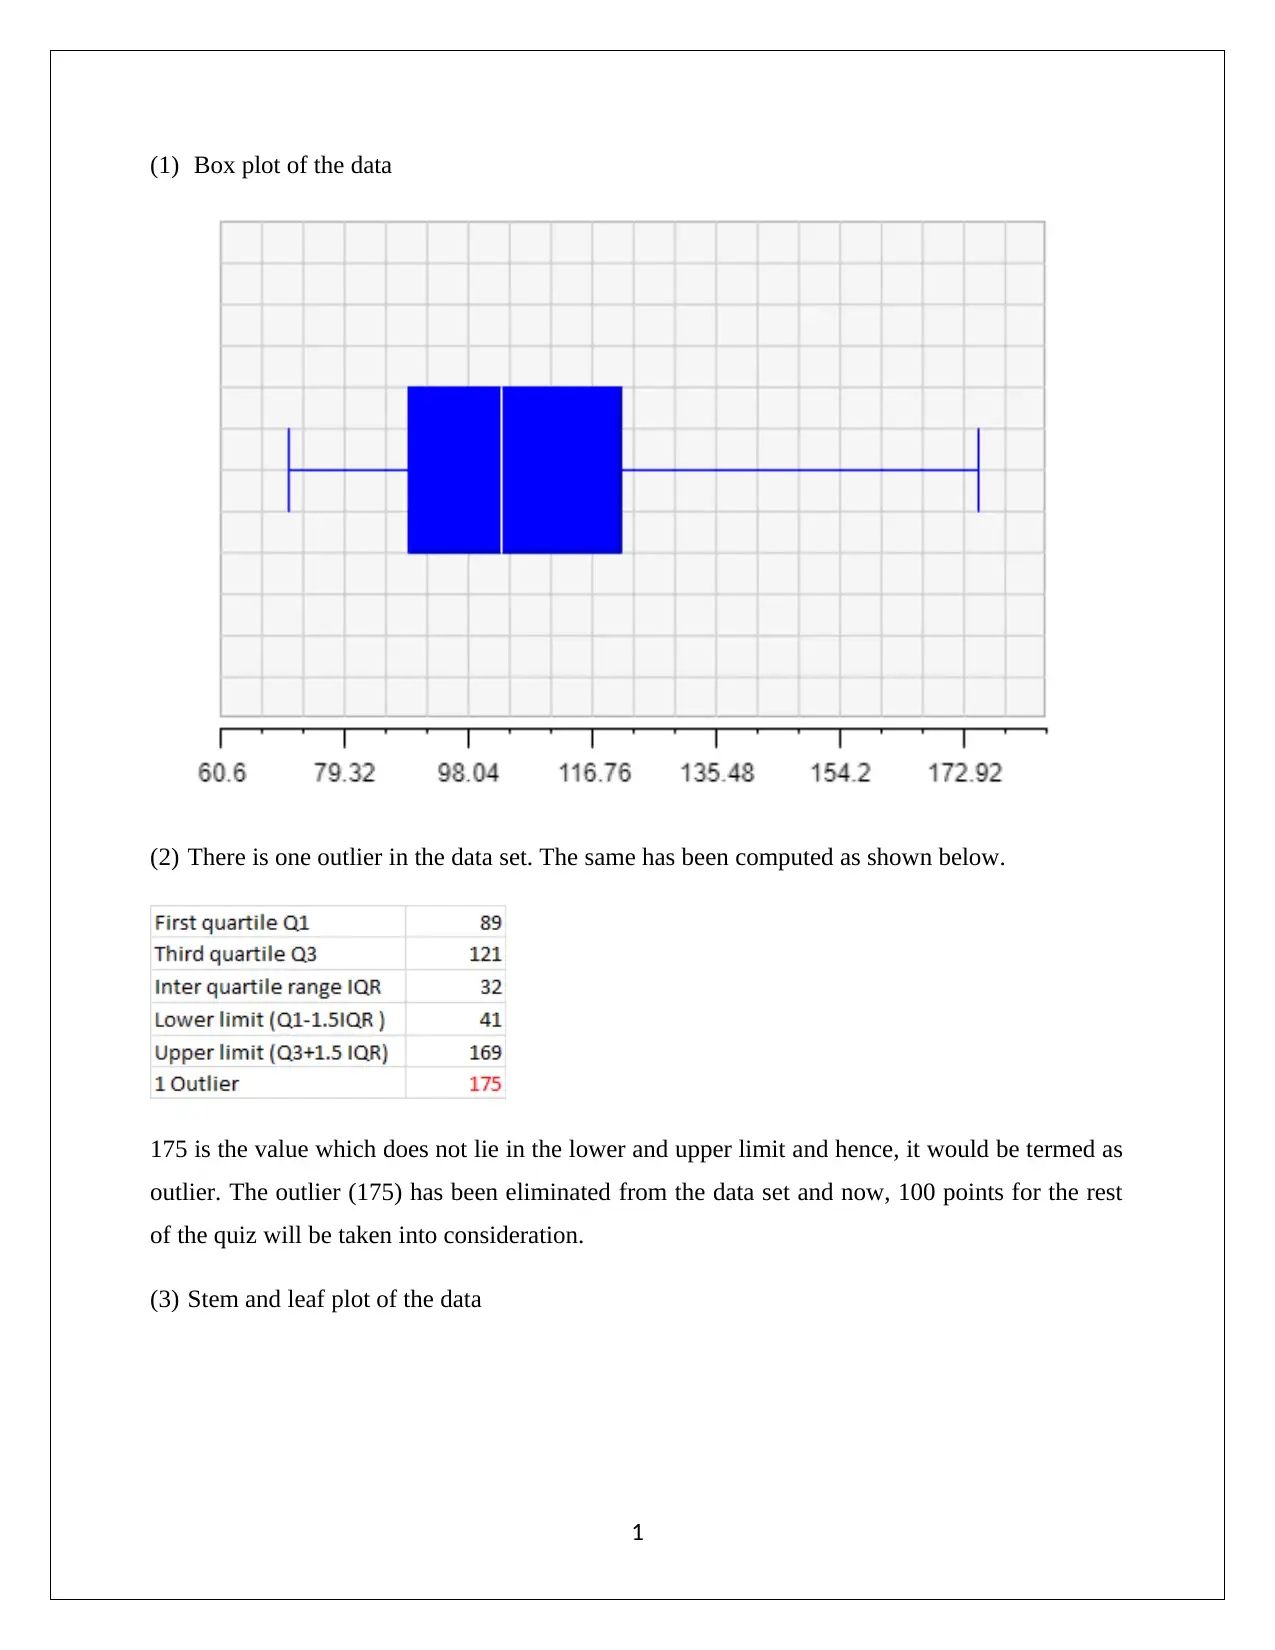
Homework Assignment
AI Summary
This statistics assignment solution includes a box plot analysis identifying an outlier, which is then removed for subsequent calculations. The solution proceeds with a stem and leaf plot, followed by the calculation of the mean, median, mode, and standard deviation for the sample data. It verifies the relationship between sample and population standard deviations and confirms the median calculation using both sorted data and Excel functions. The 72nd percentile is computed and interpreted, followed by the creation of a histogram and frequency table. Relative and cumulative relative frequency histograms are also generated. The assignment further calculates the required sample size for a given margin of error and analyzes the characteristics of different distributions based on mean and median. Finally, bar and pie charts are presented to visualize popular and electoral vote data. Desklib is a platform where students can find similar solved assignments and study tools.


1 out of 8
Related Documents


Your All-in-One AI-Powered Toolkit for Academic Success.
+13062052269
info@desklib.com
Available 24*7 on WhatsApp / Email
![[object Object]](/_next/static/media/star-bottom.7253800d.svg)
Copyright © 2020–2026 A2Z Services. All Rights Reserved. Developed and managed by ZUCOL.