Statistics Assignment: Descriptive Statistics and Probability Analysis
VerifiedAdded on 2020/06/04
|10
|2040
|38
Homework Assignment
AI Summary
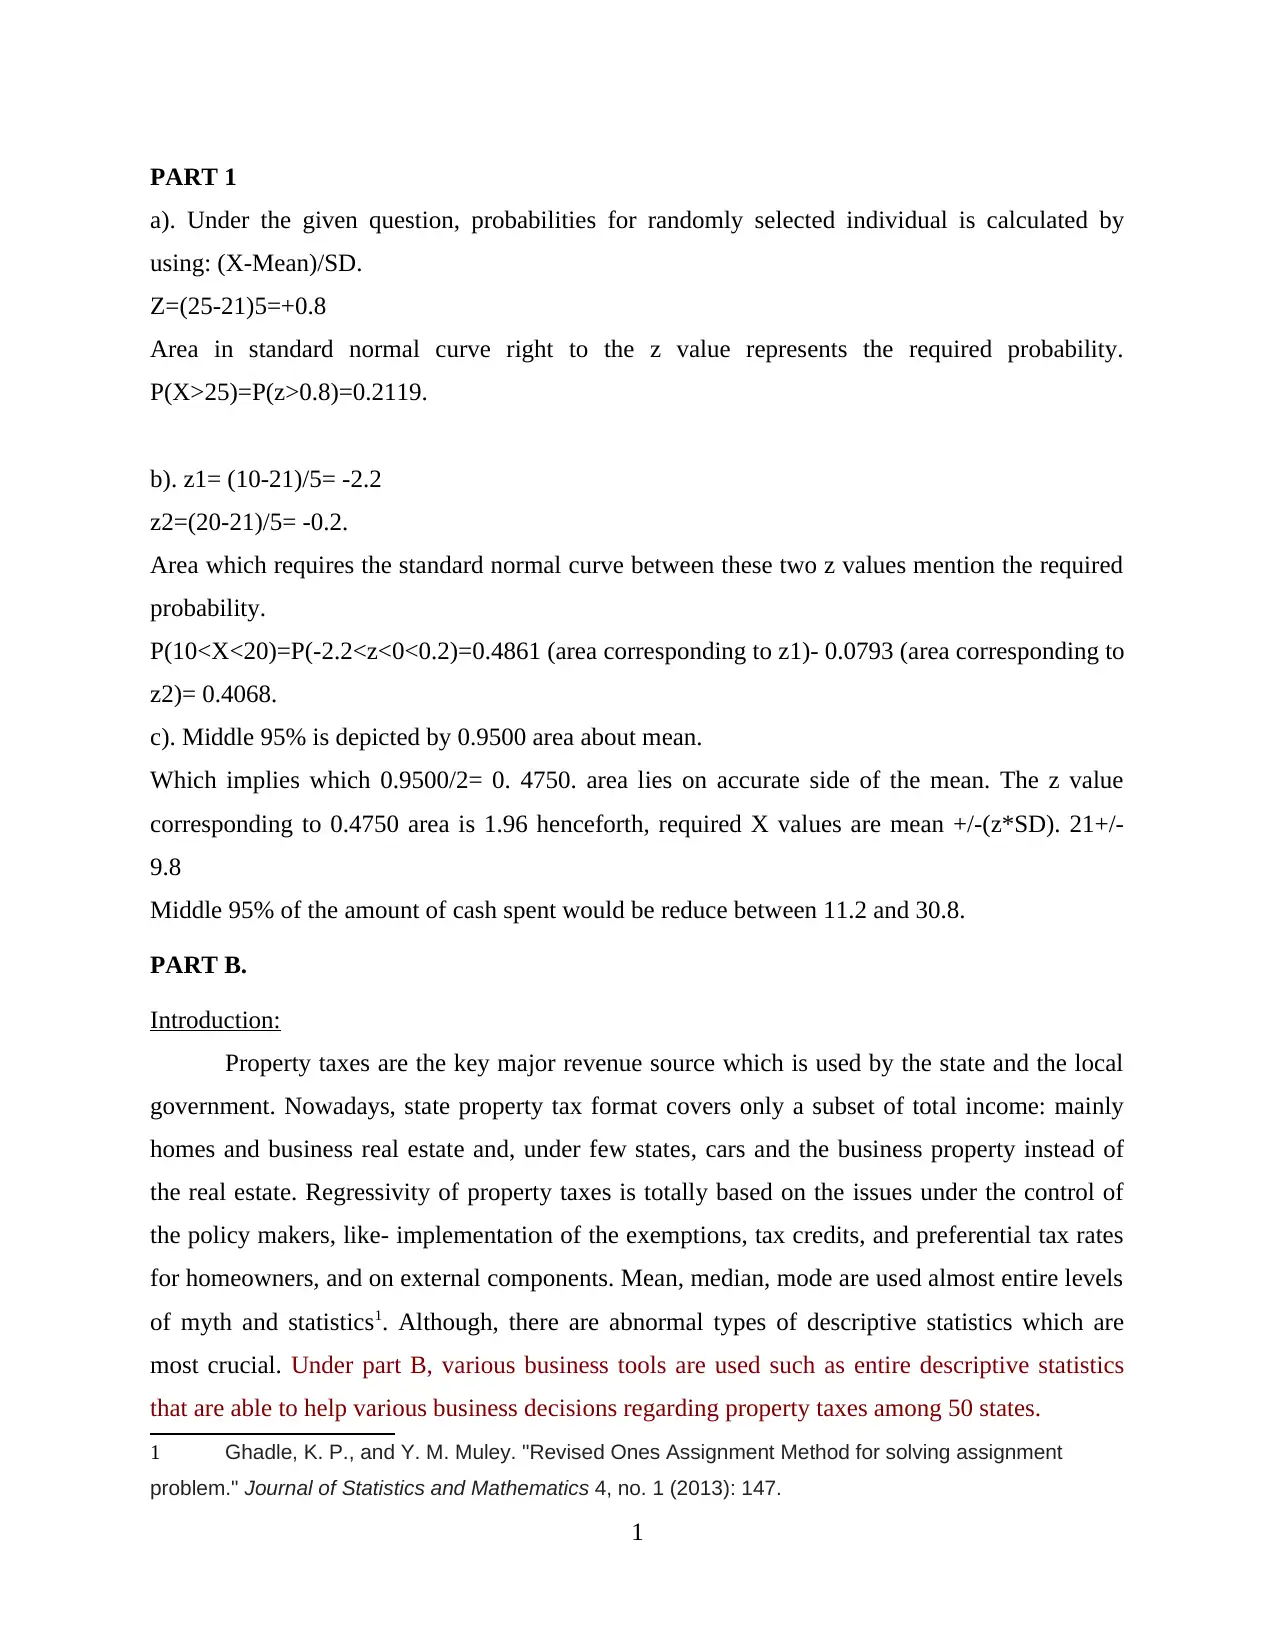
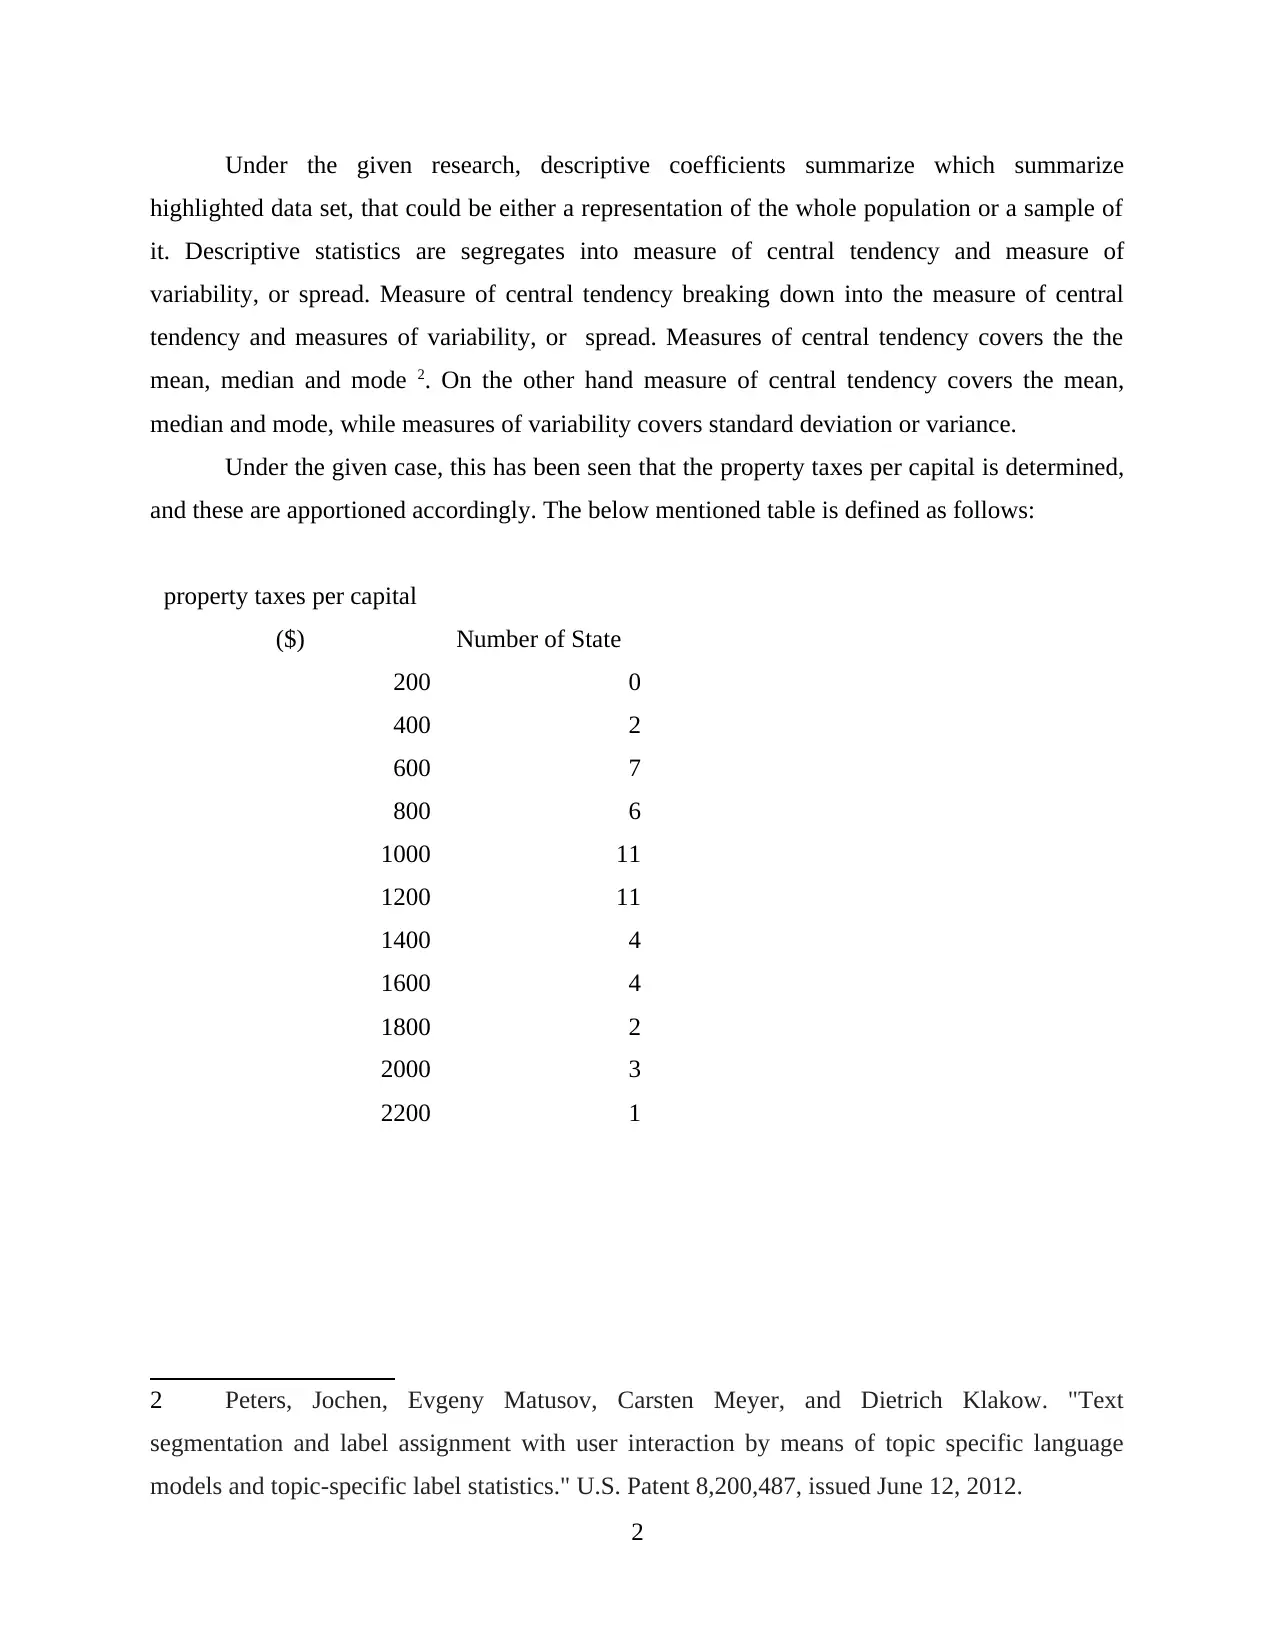
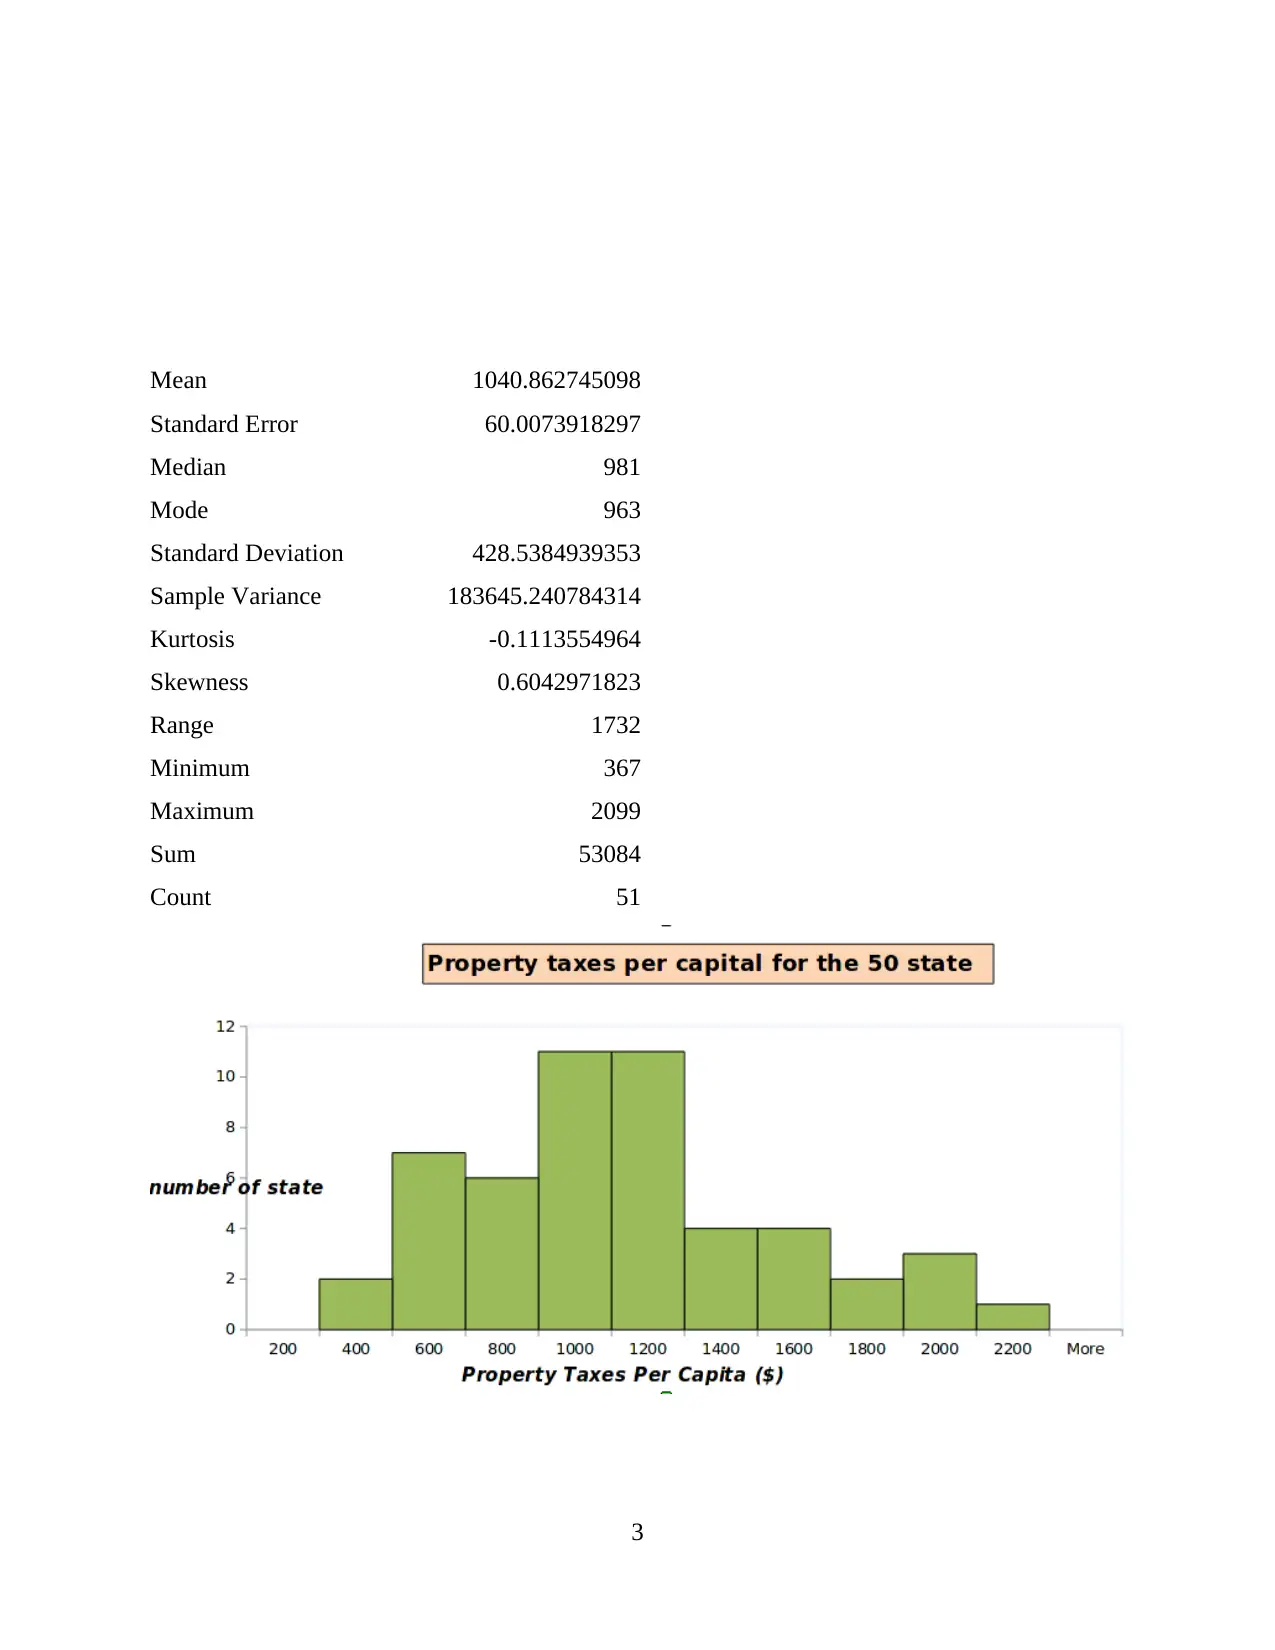
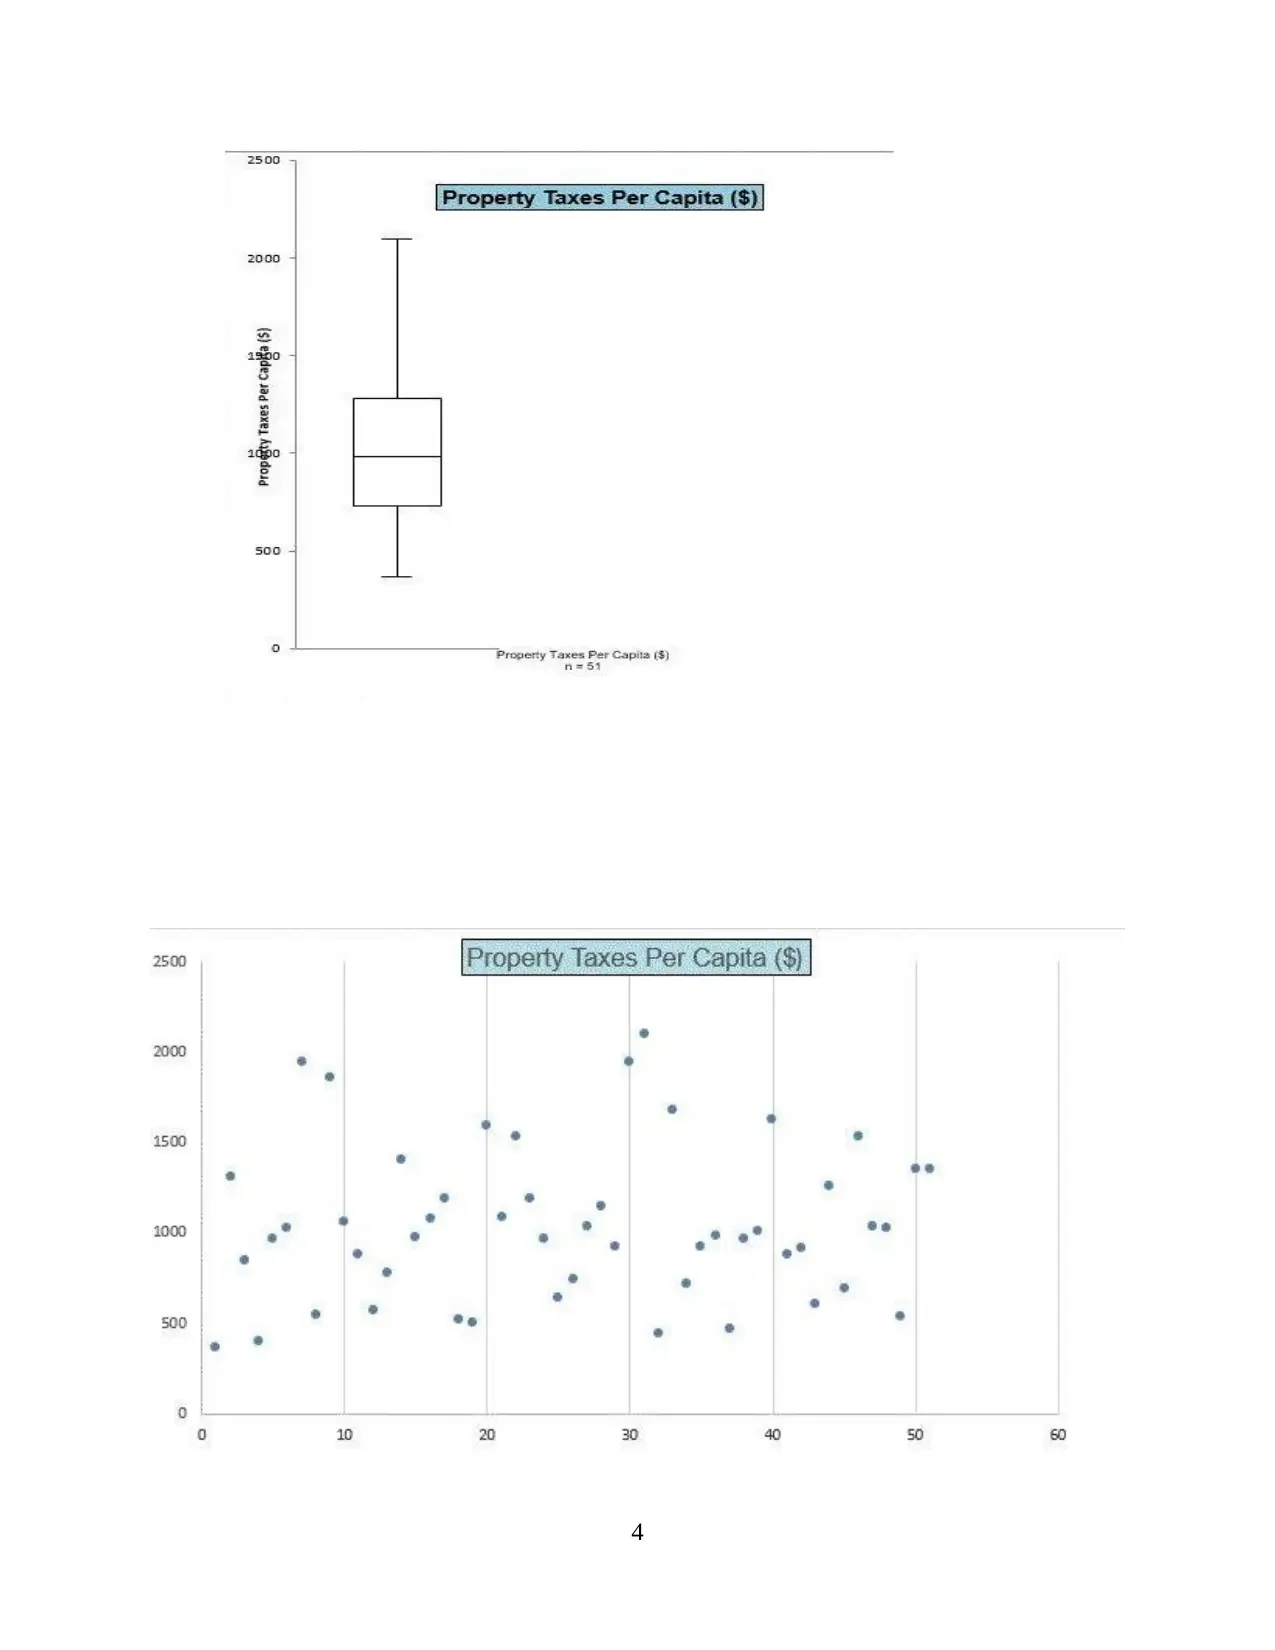
This statistics assignment is divided into two parts. Part 1 involves probability calculations using z-scores to determine probabilities for different scenarios, such as the probability of a value exceeding a certain threshold and the probability of a value falling within a range. Part 2 focuses on descriptive statistics, analyzing property taxes per capita across 50 states. It includes calculations of mean, median, mode, standard deviation, skewness, and kurtosis, along with visual representations like histograms and scattered graphs. The assignment highlights the application of these statistical measures to understand the distribution and variability of property tax data, providing insights for business decision-making. The analysis includes a conclusion summarizing the findings and the utility of descriptive statistics in drawing valid conclusions.
1 out of 10
Related Documents


Your All-in-One AI-Powered Toolkit for Academic Success.
+13062052269
info@desklib.com
Available 24*7 on WhatsApp / Email
![[object Object]](/_next/static/media/star-bottom.7253800d.svg)
Copyright © 2020–2026 A2Z Services. All Rights Reserved. Developed and managed by ZUCOL.