Statistics Report
VerifiedAdded on 2019/10/30
|23
|2647
|186
Report
AI Summary
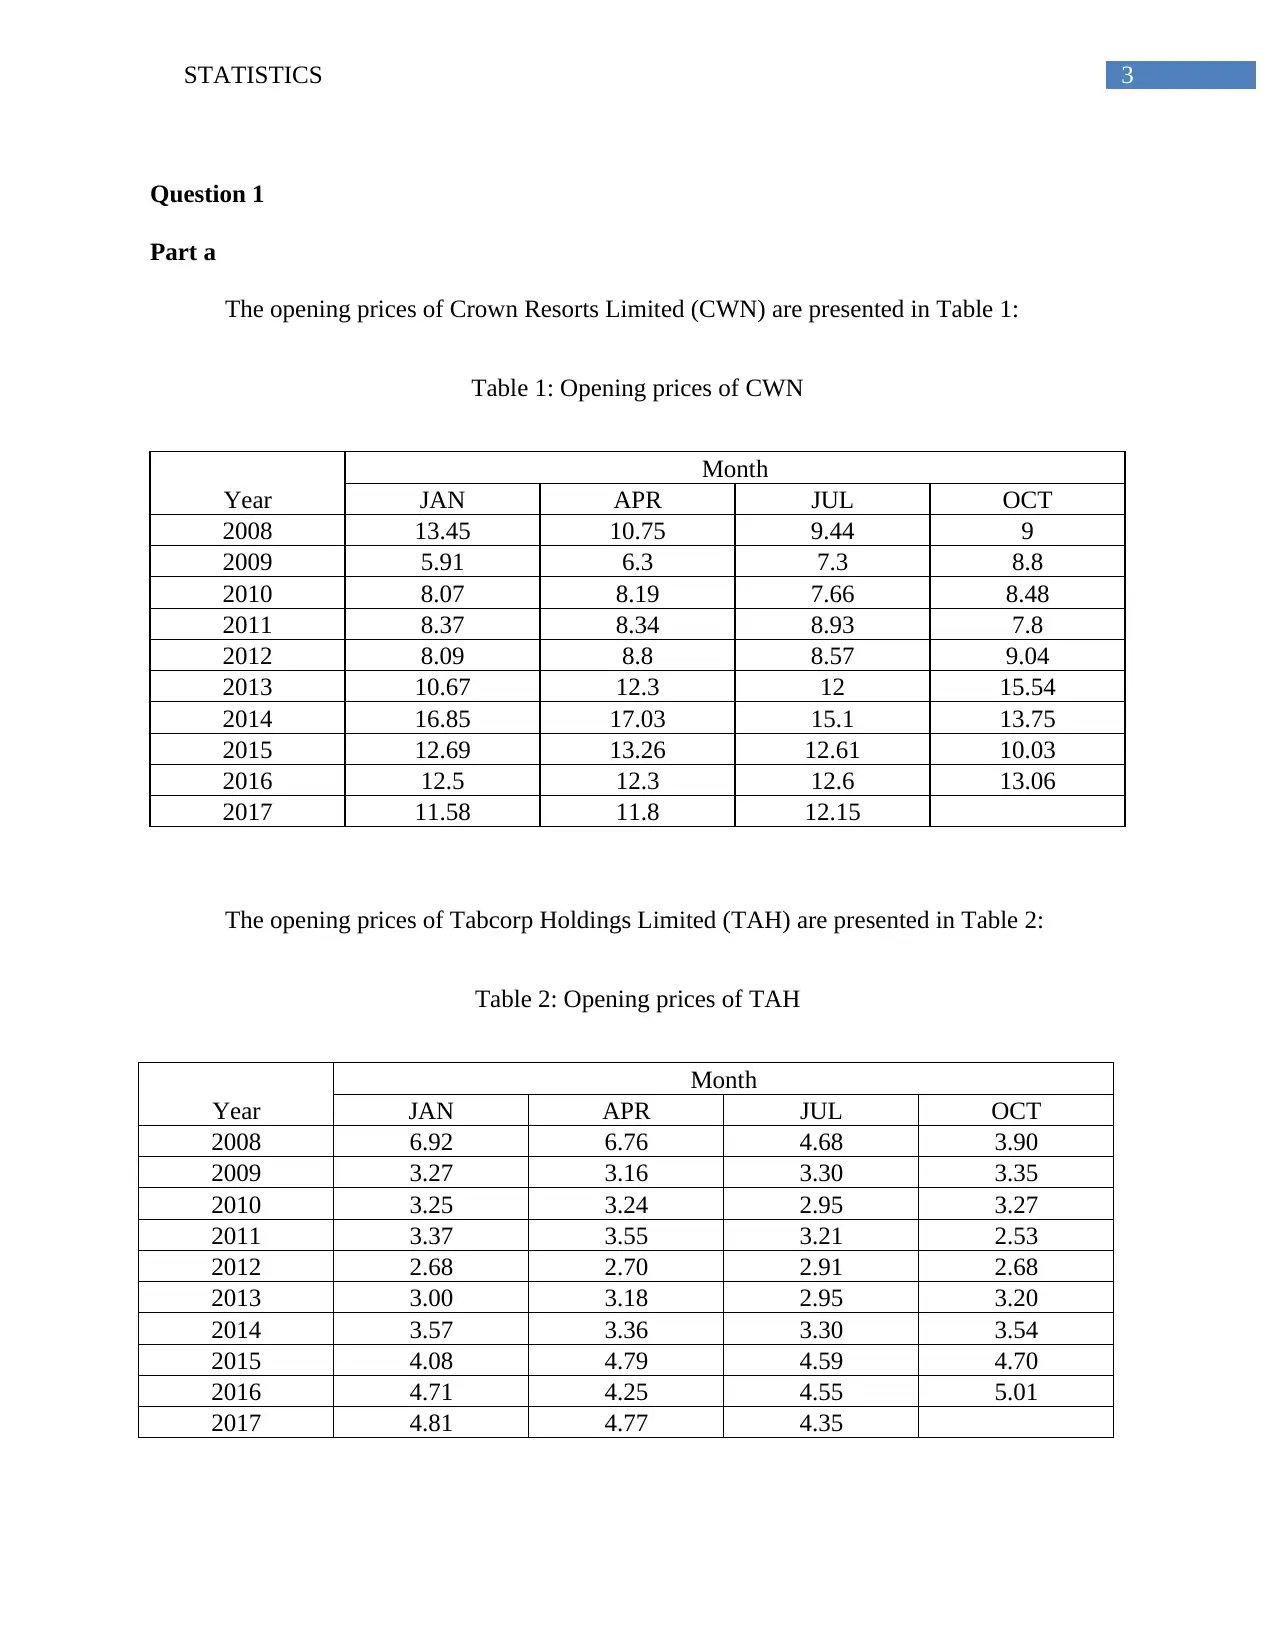
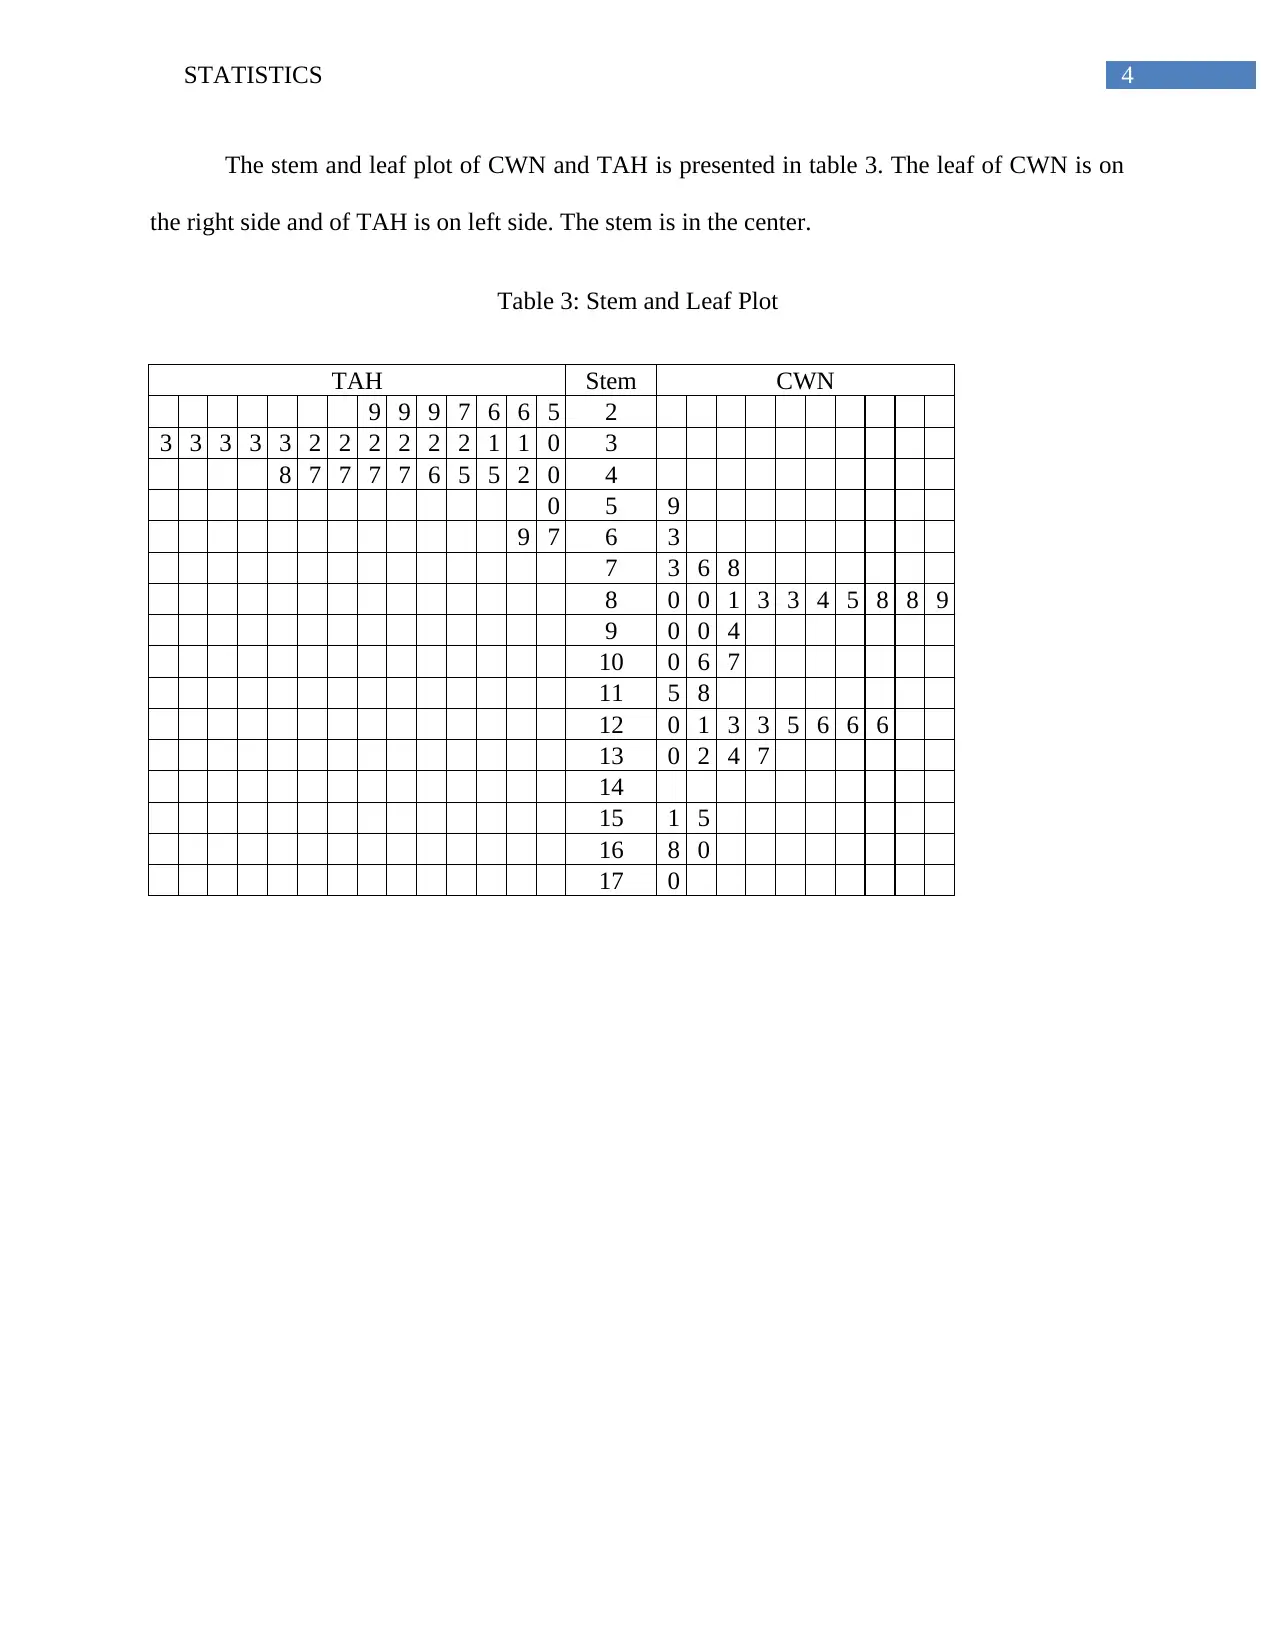
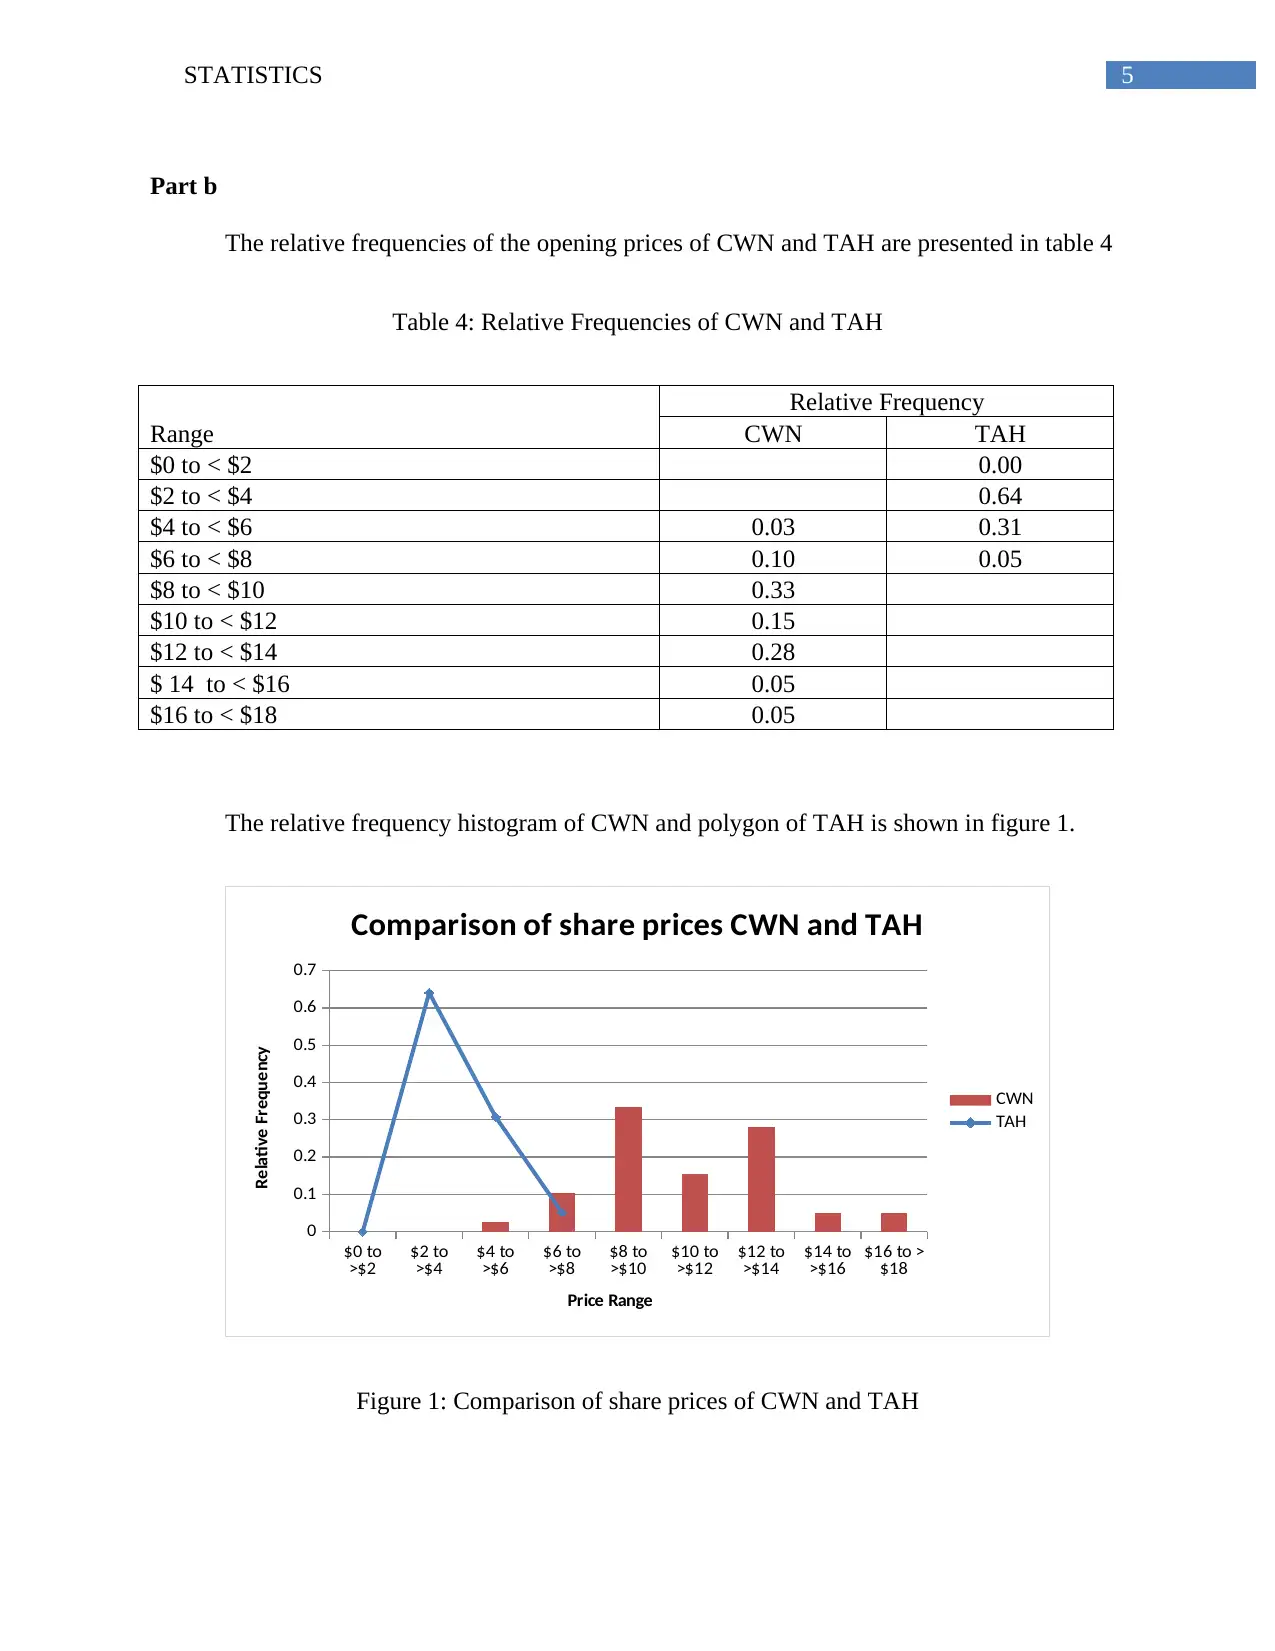
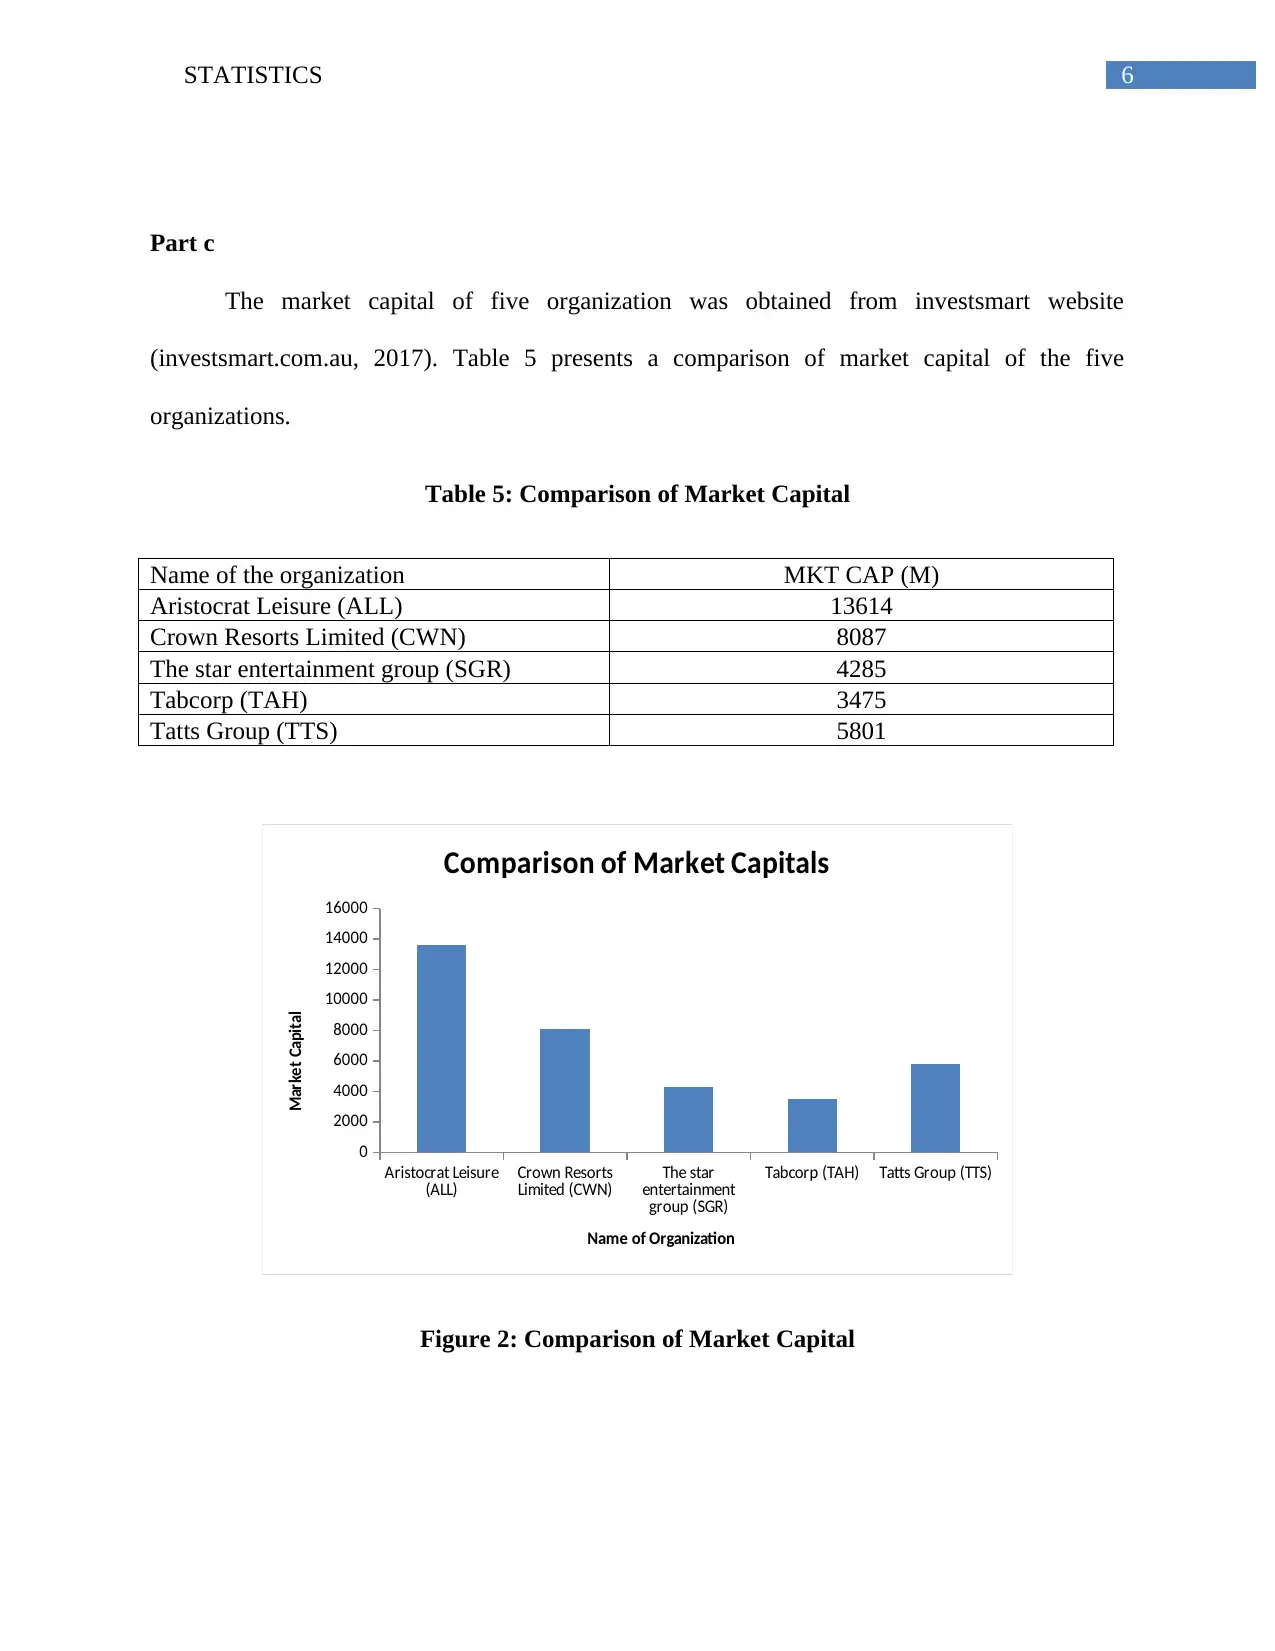
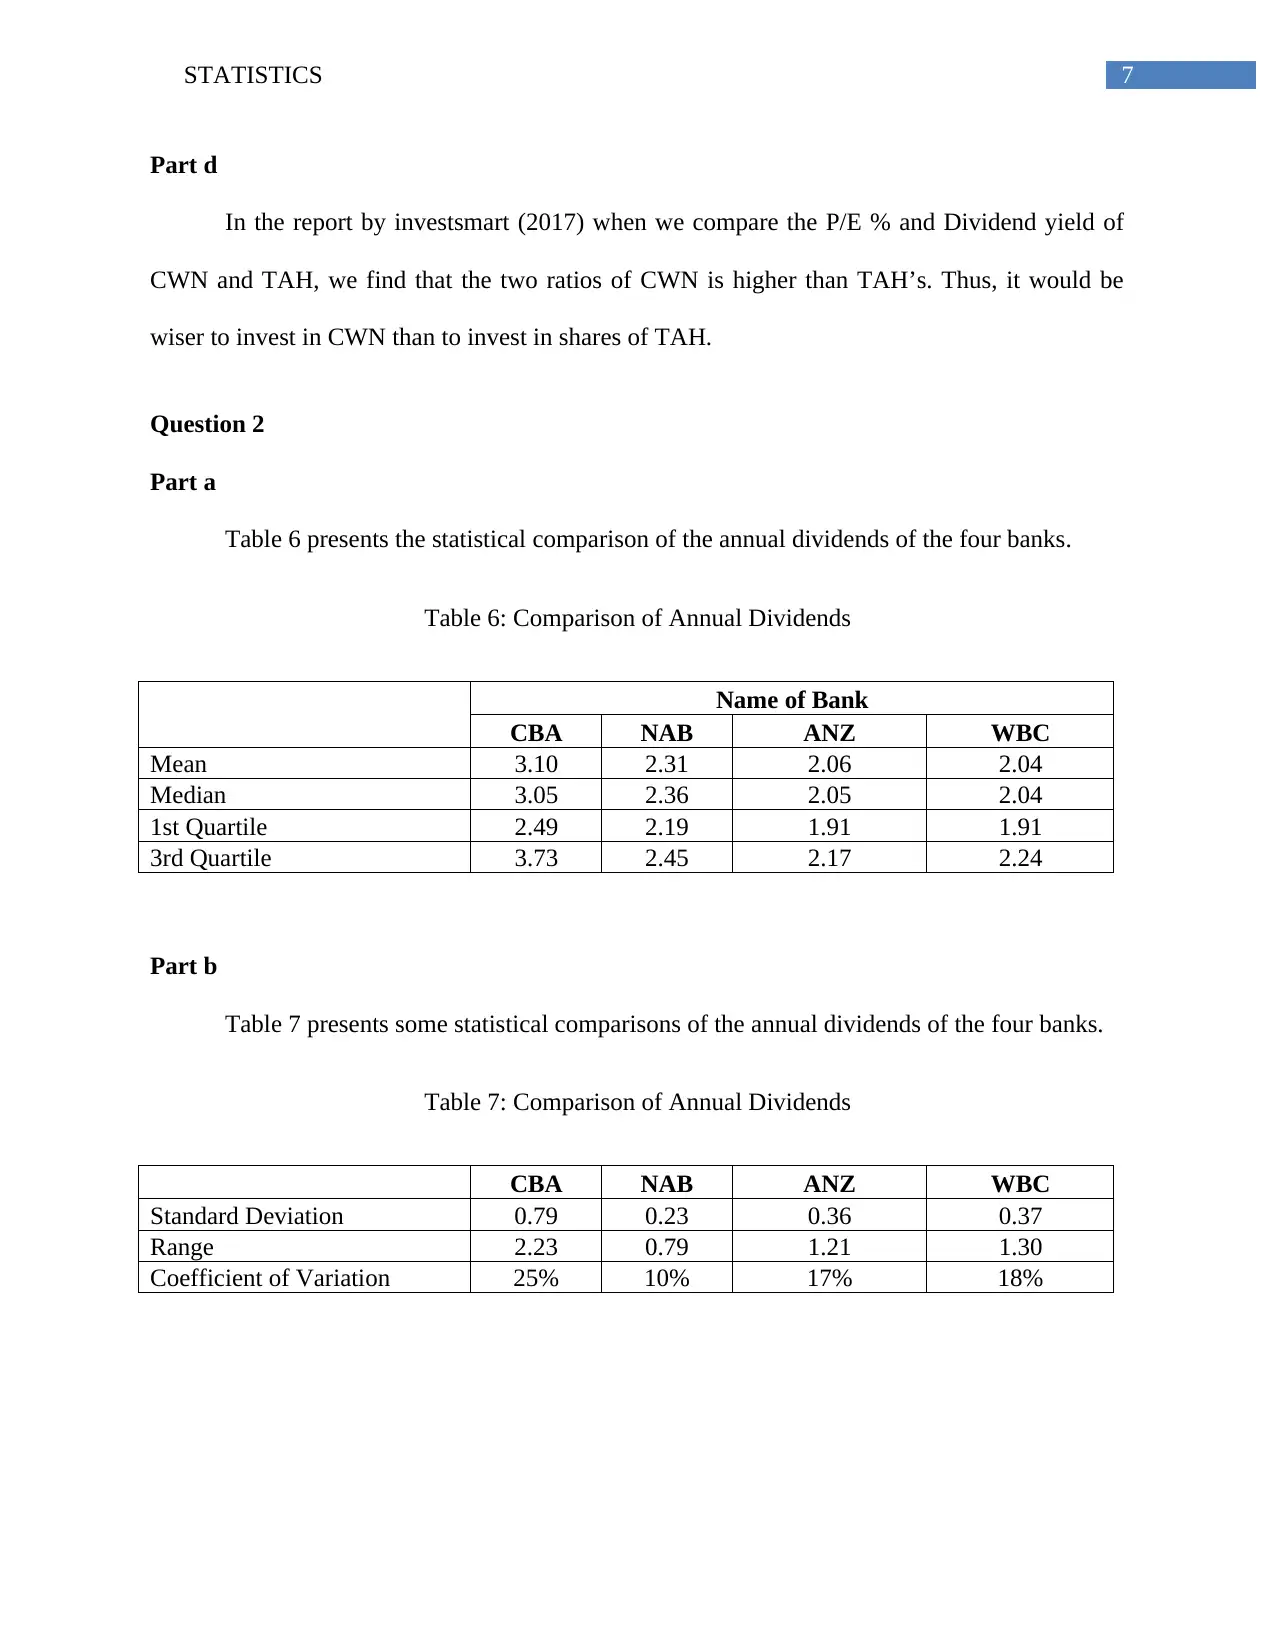
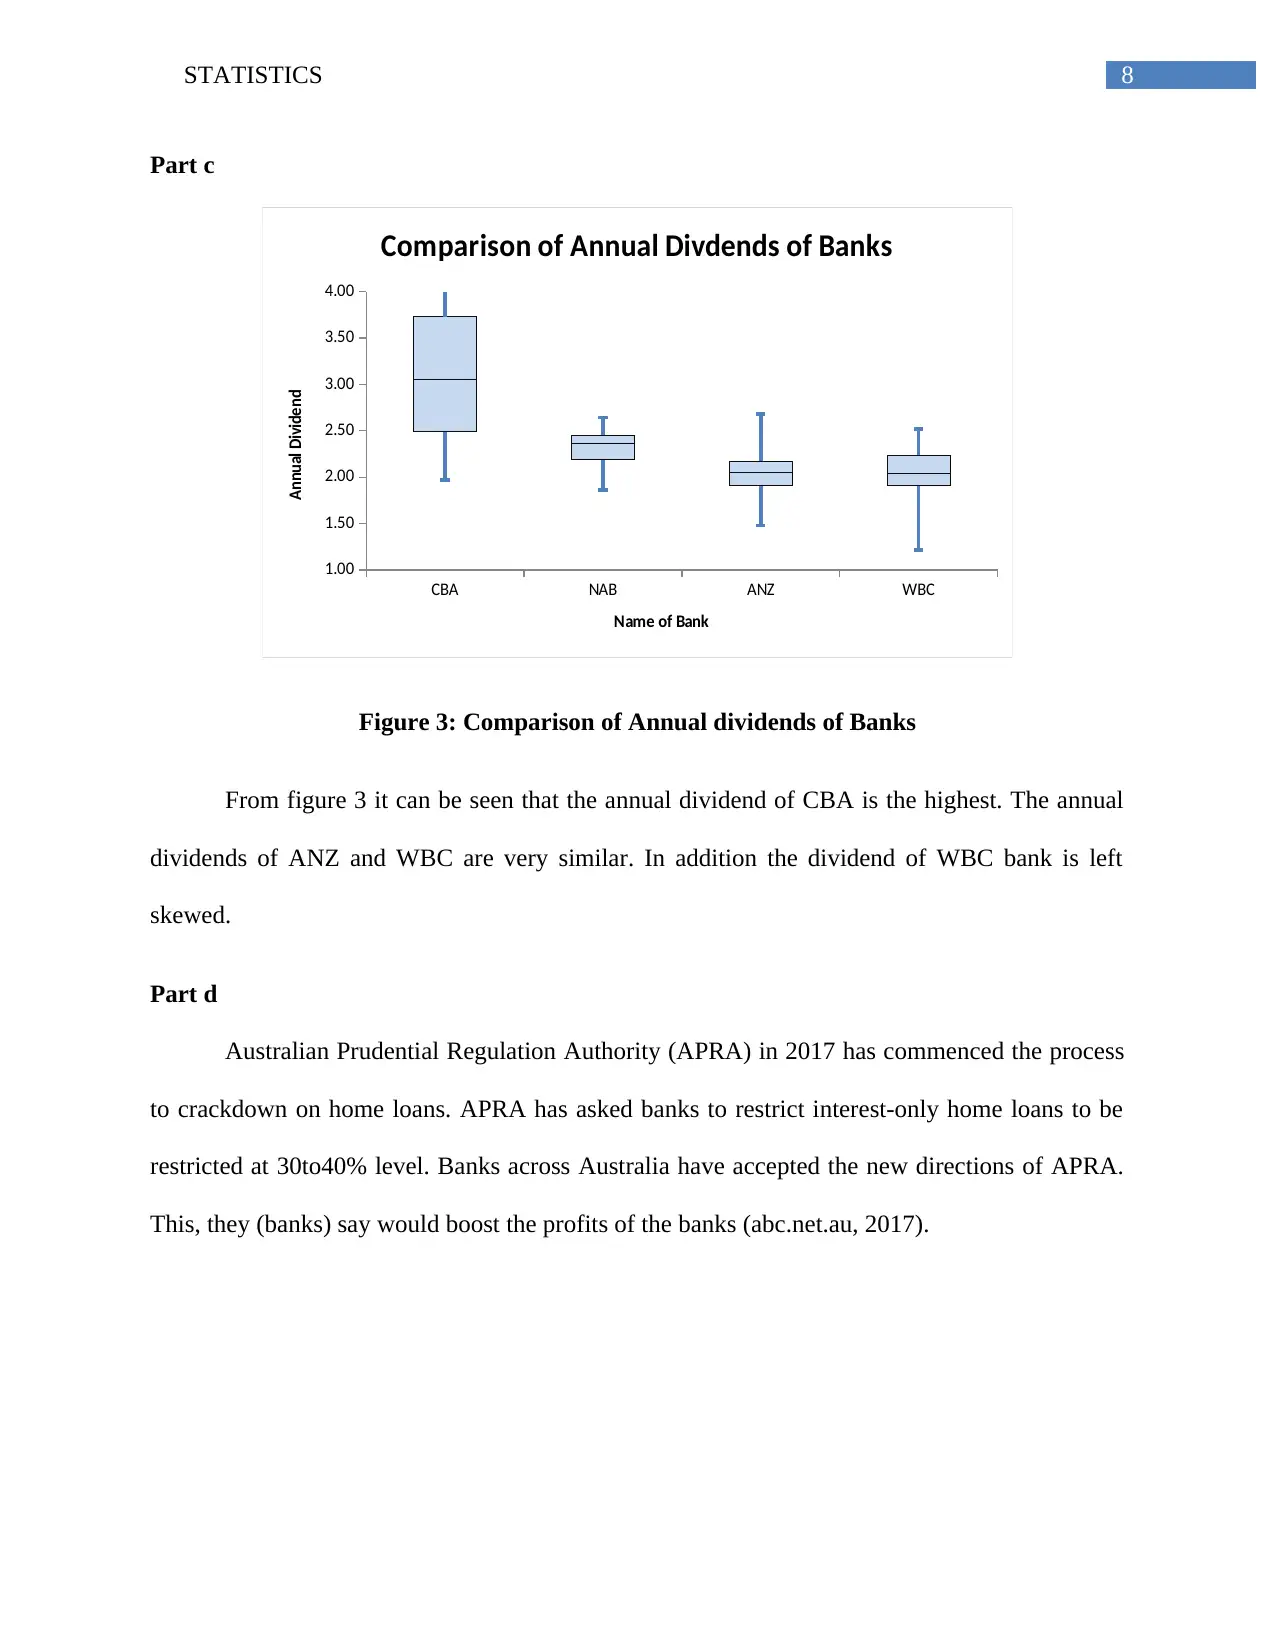
This statistics report presents a comprehensive analysis of financial data, encompassing various statistical techniques. The report begins by examining the opening prices of Crown Resorts Limited (CWN) and Tabcorp Holdings Limited (TAH), utilizing stem-and-leaf plots and relative frequency histograms to compare their share prices. Further analysis involves comparing the market capital of five organizations and evaluating investment strategies based on P/E ratios and dividend yields. The report then shifts focus to a statistical comparison of annual dividends from four Australian banks, employing descriptive statistics and visualizations to highlight key differences. A detailed analysis of ATAR scores for Australian students across different fields of study is also included, along with probability calculations based on rainfall data from Adelaide Airport. Finally, the report investigates bankruptcy prediction using multiple regression analysis, examining the normality of predictors, constructing confidence intervals, and performing hypothesis tests to determine statistically significant differences between bankrupt and non-bankrupt firms. The report concludes by identifying key factors that can predict bankruptcy.

Running head : STATISTICS
Statistics
Name of the student
Name of the university
Author’s note
Statistics
Name of the student
Name of the university
Author’s note
Paraphrase This Document
Need a fresh take? Get an instant paraphrase of this document with our AI Paraphraser

1STATISTICS
Table of Contents
Question 1........................................................................................................................................3
Part a............................................................................................................................................3
Part b............................................................................................................................................5
Part c............................................................................................................................................6
Part d............................................................................................................................................7
Question 2........................................................................................................................................7
Part a............................................................................................................................................7
Part b............................................................................................................................................7
Part c............................................................................................................................................8
Part d............................................................................................................................................8
Question 3........................................................................................................................................9
Part a............................................................................................................................................9
Part b............................................................................................................................................9
Part c............................................................................................................................................9
Part d..........................................................................................................................................10
Question 4......................................................................................................................................11
Part a..........................................................................................................................................12
Part i.......................................................................................................................................12

2STATISTICS
Part ii......................................................................................................................................12
Part b..........................................................................................................................................12
Part i.......................................................................................................................................13
Part ii......................................................................................................................................13
Question 5......................................................................................................................................14
Part a..........................................................................................................................................14
Part b..........................................................................................................................................17
Part c..........................................................................................................................................17
References......................................................................................................................................22
⊘ This is a preview!⊘
Do you want full access?
Subscribe today to unlock all pages.

Trusted by 1+ million students worldwide

3STATISTICS
Question 1
Part a
The opening prices of Crown Resorts Limited (CWN) are presented in Table 1:
Table 1: Opening prices of CWN
Year
Month
JAN APR JUL OCT
2008 13.45 10.75 9.44 9
2009 5.91 6.3 7.3 8.8
2010 8.07 8.19 7.66 8.48
2011 8.37 8.34 8.93 7.8
2012 8.09 8.8 8.57 9.04
2013 10.67 12.3 12 15.54
2014 16.85 17.03 15.1 13.75
2015 12.69 13.26 12.61 10.03
2016 12.5 12.3 12.6 13.06
2017 11.58 11.8 12.15
The opening prices of Tabcorp Holdings Limited (TAH) are presented in Table 2:
Table 2: Opening prices of TAH
Year
Month
JAN APR JUL OCT
2008 6.92 6.76 4.68 3.90
2009 3.27 3.16 3.30 3.35
2010 3.25 3.24 2.95 3.27
2011 3.37 3.55 3.21 2.53
2012 2.68 2.70 2.91 2.68
2013 3.00 3.18 2.95 3.20
2014 3.57 3.36 3.30 3.54
2015 4.08 4.79 4.59 4.70
2016 4.71 4.25 4.55 5.01
2017 4.81 4.77 4.35
Paraphrase This Document
Need a fresh take? Get an instant paraphrase of this document with our AI Paraphraser

4STATISTICS
The stem and leaf plot of CWN and TAH is presented in table 3. The leaf of CWN is on
the right side and of TAH is on left side. The stem is in the center.
Table 3: Stem and Leaf Plot
TAH Stem CWN
9 9 9 7 6 6 5 2
3 3 3 3 3 2 2 2 2 2 2 1 1 0 3
8 7 7 7 7 6 5 5 2 0 4
0 5 9
9 7 6 3
7 3 6 8
8 0 0 1 3 3 4 5 8 8 9
9 0 0 4
10 0 6 7
11 5 8
12 0 1 3 3 5 6 6 6
13 0 2 4 7
14
15 1 5
16 8 0
17 0

5STATISTICS
Part b
The relative frequencies of the opening prices of CWN and TAH are presented in table 4
Table 4: Relative Frequencies of CWN and TAH
Range
Relative Frequency
CWN TAH
$0 to < $2 0.00
$2 to < $4 0.64
$4 to < $6 0.03 0.31
$6 to < $8 0.10 0.05
$8 to < $10 0.33
$10 to < $12 0.15
$12 to < $14 0.28
$ 14 to < $16 0.05
$16 to < $18 0.05
The relative frequency histogram of CWN and polygon of TAH is shown in figure 1.
$0 to
>$2 $2 to
>$4 $4 to
>$6 $6 to
>$8 $8 to
>$10 $10 to
>$12 $12 to
>$14 $14 to
>$16 $16 to >
$18
0
0.1
0.2
0.3
0.4
0.5
0.6
0.7
Comparison of share prices CWN and TAH
CWN
TAH
Price Range
Relative Frequency
Figure 1: Comparison of share prices of CWN and TAH
⊘ This is a preview!⊘
Do you want full access?
Subscribe today to unlock all pages.

Trusted by 1+ million students worldwide

6STATISTICS
Part c
The market capital of five organization was obtained from investsmart website
(investsmart.com.au, 2017). Table 5 presents a comparison of market capital of the five
organizations.
Table 5: Comparison of Market Capital
Name of the organization MKT CAP (M)
Aristocrat Leisure (ALL) 13614
Crown Resorts Limited (CWN) 8087
The star entertainment group (SGR) 4285
Tabcorp (TAH) 3475
Tatts Group (TTS) 5801
Aristocrat Leisure
(ALL) Crown Resorts
Limited (CWN) The star
entertainment
group (SGR)
Tabcorp (TAH) Tatts Group (TTS)
0
2000
4000
6000
8000
10000
12000
14000
16000
Comparison of Market Capitals
Name of Organization
Market Capital
Figure 2: Comparison of Market Capital
Paraphrase This Document
Need a fresh take? Get an instant paraphrase of this document with our AI Paraphraser

7STATISTICS
Part d
In the report by investsmart (2017) when we compare the P/E % and Dividend yield of
CWN and TAH, we find that the two ratios of CWN is higher than TAH’s. Thus, it would be
wiser to invest in CWN than to invest in shares of TAH.
Question 2
Part a
Table 6 presents the statistical comparison of the annual dividends of the four banks.
Table 6: Comparison of Annual Dividends
Name of Bank
CBA NAB ANZ WBC
Mean 3.10 2.31 2.06 2.04
Median 3.05 2.36 2.05 2.04
1st Quartile 2.49 2.19 1.91 1.91
3rd Quartile 3.73 2.45 2.17 2.24
Part b
Table 7 presents some statistical comparisons of the annual dividends of the four banks.
Table 7: Comparison of Annual Dividends
CBA NAB ANZ WBC
Standard Deviation 0.79 0.23 0.36 0.37
Range 2.23 0.79 1.21 1.30
Coefficient of Variation 25% 10% 17% 18%

8STATISTICS
Part c
CBA NAB ANZ WBC
1.00
1.50
2.00
2.50
3.00
3.50
4.00
Comparison of Annual Divdends of Banks
Name of Bank
Annual Dividend
Figure 3: Comparison of Annual dividends of Banks
From figure 3 it can be seen that the annual dividend of CBA is the highest. The annual
dividends of ANZ and WBC are very similar. In addition the dividend of WBC bank is left
skewed.
Part d
Australian Prudential Regulation Authority (APRA) in 2017 has commenced the process
to crackdown on home loans. APRA has asked banks to restrict interest-only home loans to be
restricted at 30to40% level. Banks across Australia have accepted the new directions of APRA.
This, they (banks) say would boost the profits of the banks (abc.net.au, 2017).
⊘ This is a preview!⊘
Do you want full access?
Subscribe today to unlock all pages.

Trusted by 1+ million students worldwide

9STATISTICS
Question 3
Part a
The best students have an ATAR of 90.05 or more.
30.0% of all students of “Engineering and Related Technologies” have more than 90.05 or
more ATAR.
The number of students = 4203.
The total number of students offered in 2016 = 14027.
Thus the proportion of students offered = 4203
14207 =0.2996
Part b
The total number of student’s admitted in 2016 = 221060
The total number of students admitted in “Society and Culture” = 46841
The number of students having 80.05 to 90.00 = 6043
The number of students having 90.05 or more = 8180
Thus the number of students having more than 80.05 = 6043 + 8180 = 14223
Hence, number of students having less than 80.05 = 46841 - 14223 = 32681
Hence, a randomly selected Australian Student studying in “Society and Culture” and has
ATAR score of less than 80.05 = 32681
221060 =0.148
Paraphrase This Document
Need a fresh take? Get an instant paraphrase of this document with our AI Paraphraser

10STATISTICS
Part c
The lowest ATAR grade is 50.00 or less
Education course has the highest proportion of students with ATAR grade less than or equal
to 50.00
The proportion of students = 0.073
Part d
The maximum number of students with “No ATAR/Non-Yr 12” is in the field of health
education. According to Macquarie (2017) ATAR score of a student is just of the ways to
measure a student. Macquarie also uses other methods to determine the suitability of a candidate.
Thus the other methods are found suitable by a large number of students to take admission.

11STATISTICS
Question 4
The weekly data for Adelaide Airport, number 23034 is presented in the following table:
Table 8: Rainfall data for Adelaide Airport, Number 230304
week Jan Feb Mar Apr May Jun July Aug Sep Oct Nov Dec
1st 0 0 0 0.4 3.6 3.4 9.2 1.4 1.8 0.2 0
2nd 10.8 0 0 0 0 0.4 1 0 0 0 0
3rd 3 0 0 0 2.4 0 0.6 0.4 11 0 0
4th 0 0 0 0 5.6 0 0 0 1 9.4 0 0
5th 0 0 0 0 0 0.4 32.8 0 0 0 0 4.6
6th 0 0 0 4.4 0 6.8 1 0 0 0 0 0
7th 0 0 11.6 0 0 2 3 0 0 0 0 0
8th 0 0 0 0 1 4.8 0 0 2.4 0 0 7.8
9th 0 0 0 0 0.2 5.8 0 0.4 18.4 0 0 2.4
10th 0 0 19.6 0 11.8 0.6 7.4 2.4 0 1 0 0
11th 0 0 0.6 0.2 0.2 0.4 0 9.2 0.2 0.6 0 0
12th 1.2 0 0 0 1.2 0.2 3 0 0 0.6 13.2 0
13th 0 0 0 0 1.2 0 4.6 0 4.8 0 12.2 0
14th 0 0 0 0 0 0 0.2 0 7.6 0 2.2 0.2
15th 0 0 0 0 0 0 0 0 9.8 0 0.4 0
16th 0 0.6 0 0 0.2 0.6 0 0 0 0.8 0 0
17th 0 0 0 0 0 3.6 0 0.8 0 11.6 0 0.4
18th 0 0 9 0 0 0 0 0 3 8 0 0
19th 0 0 0 0 0 0 0 11.8 0.4 2.4 0 0
20th 1 0 0 0 0 0.6 1 4.2 0.6 0 0 0.8
21st 0 0 0 0.6 0 3.8 0 0.6 2.2 11.2 0 0
22nd 6.6 0 0 0 0 12.2 0.2 0 0 0 1.6 0
23rd 8.8 0 0 0 3.8 2.6 3.4 0 0 0 0.4 0
24th 0 0.4 0 0 0.4 14 0.8 0 1.6 0 0 0
25th 0 0 0.8 0 4.2 0 8 0 1.6 0 0 0
26th 0 0 0 0 22.8 0 8.6 0.6 0 0.4 0 0.8
27th 0 0 0 0 1.8 5.4 14.4 0 0 0 0 4.4
28th 0 0 0 0.2 8 0 0 0 0 0 0 53.2
29th 6.2 0 0 2.6 0 0 0.2 2.4 38 0 0 1.2
30th 12.2 0 0 0.6 2.2 0 5.8 8.8 0 0 0
31st 0.2 0 0.8 3 0 0.8 0
⊘ This is a preview!⊘
Do you want full access?
Subscribe today to unlock all pages.

Trusted by 1+ million students worldwide
1 out of 23
Related Documents
Your All-in-One AI-Powered Toolkit for Academic Success.
+13062052269
info@desklib.com
Available 24*7 on WhatsApp / Email
Unlock your academic potential
Copyright © 2020–2025 A2Z Services. All Rights Reserved. Developed and managed by ZUCOL.


